Análisis de la app Smith Charts para 25 de diciembre
Smith Charts
- Edoardo Orzes
- App Store de Apple
- Pagado
- Productividad
A great experience of the Smith chart. Also in dark mode.
Design matching networks, insert S parameters and convert them, or import from touchstone file.
Compute stability circles, equi gain and noise circles.
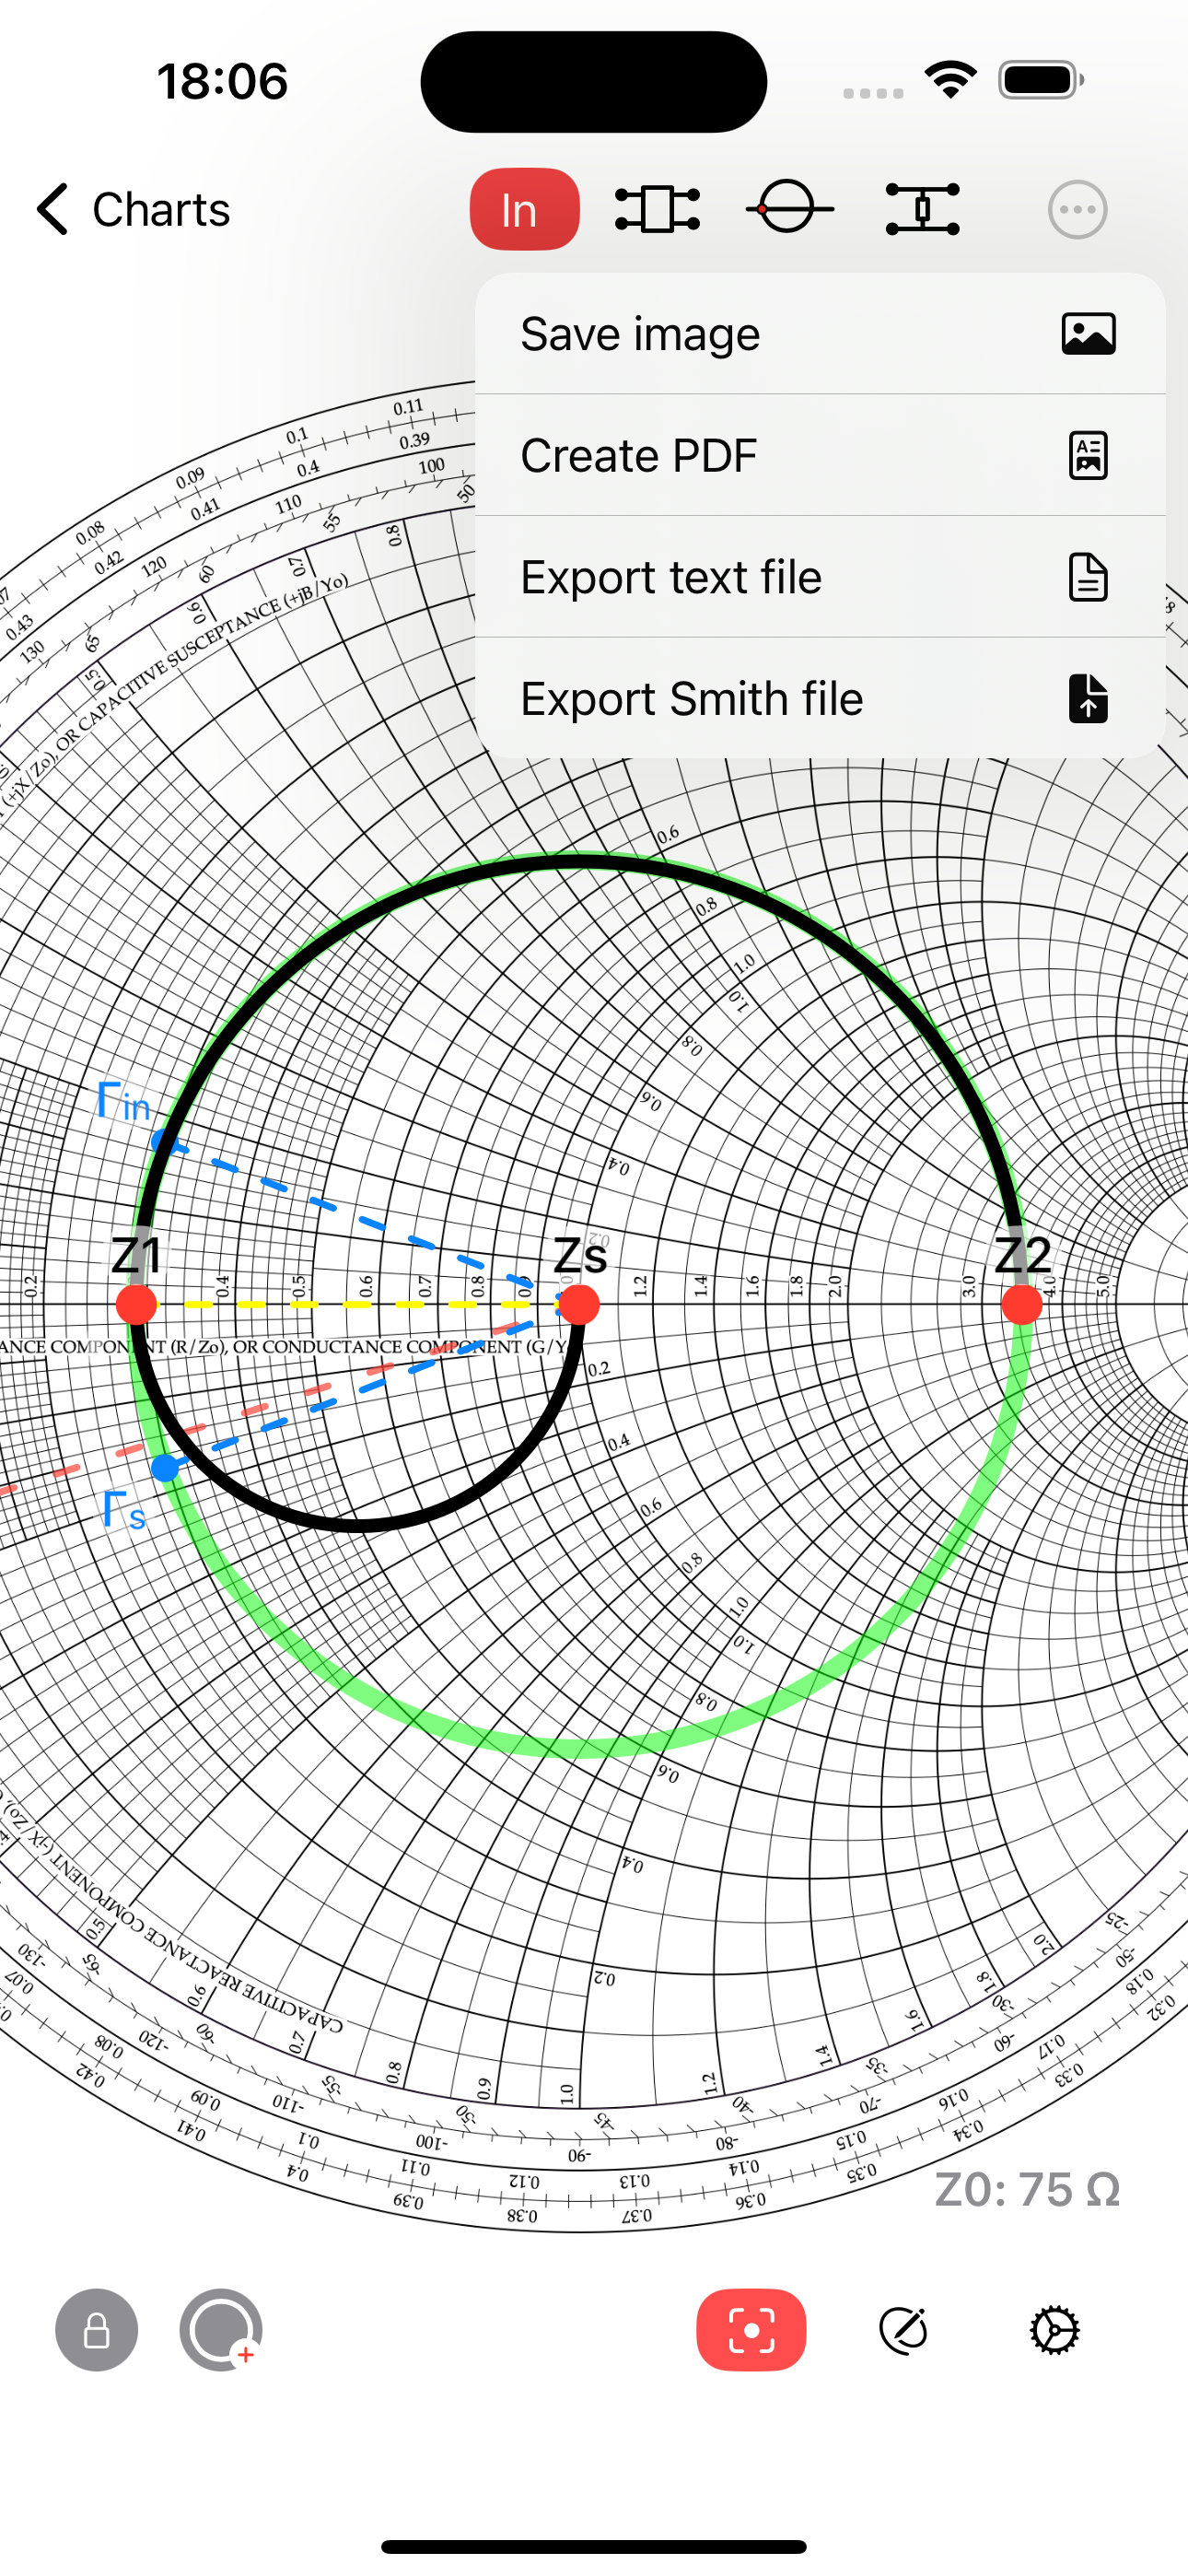
Easy interaction with the Smith chart.
This chart can easily replace a physical one, making its use much faster.
Smith chart interactivity:
- Works on iPhone, iPad and Mac (on Apple Silicon).
- Drag and zoom in the chart.
- Create multiple Smith Charts and name them.
- Switch easily between input and output planes.
- Use a ruler and drag it to obtain the wavelength toward generator of a point on the chart, instantly.
- Tap the chart to show the coordinates in algebraic notation, you will see also magnitude and phase of that location, and the corresponding impedance.
- Insert circles by hand; modify the radius dragging a circle to keep the center in place, or press to translate them and modify the radius keeping the opposite side in place. Then use the padlock button to disable interaction of gestures with circles.
- You can also insert a custom circle and a segment in the input and in the output plane, defining its center and radius in a textfield.
- Export to file, image or PDF
Advanced tools for engineering:
Matching networks:
- Choose electronic components to design a matching network for your device.
- Available components are: L, C, R, Z and lines (transmission line, parallel or series stub, open or shorted).
- For each component it is possible to specify the parasites.
- For transmission lines, it is possible to choose between Z0, K or L, C representations, and converting between the two (also for parasites).
- Tapping on a component it is added to the network and the impedance seen from your device toward the matching network is shown on the smith chart.
- You can create a matching network both for input and output planes of the device.
- Each network has its own termination (source or load), which can be a one port device or a two ports device where you can choose a termination for the second port.
- Each termination can be defined by network parameters (S, Z, Y or h) and the parameters can be imported from a touchstone file.
- Components supported: Resistor, Capacitor, Inductor, General impedance (R+jX), Transmission line, Parallel stub, series Stub (both shorted or open).
- Each component can be cascaded in series or in parallel, no limits of components.
- You can choose a frequency for the impedance calculation and a frequency span for the plot on the Smith Chart.
- For S parameters, you can specify a dedicated characteristic impedance, the tool will renormalize the Γ of that termination to be correctly shown on the Smith chart, when the smith chart is defined on a different characteristic impedance.
Device analysis:
- You can insert the following parameters of a device: network parameters (S, Z, Y or h), specifications (Ga, Gp, Gt, NF), noise data (gamma s optimum noise, minimum NF, rn) and the input/output reflection coefficients.
- You can convert network parameters (S, Z, Y, h), and the port type (Γ, Z, Y).
- While you are inserting data, you will see the computed results appearing on the chart and on the relative fields.
- Results representable on the smith chart: input/output stability circles, power gain and noise circles (equiGa, Gp, Gt, NF circles), reflection coefficients towards load and source and optimum power coefficients.
- Other results: obtained power gains and noise (Ga, Gp, Gt, NF) and stability (D, K, kind of stability).
- You can display on the Smith chart the input impedance of your component versus frequency (as a function of load impedance) when importing a touchstone file.
- For S parameters, you can specify a different characteristic impedance and the tool will automatically convert it to the one defined for the Smith chart, it will let you know the new renormalized parameters.
Clasificación de tiendas
El Store Rank se basa en múltiples parámetros establecidos por Google y Apple.
Todas las categorías en
Alemania--
Productividad en
Alemania--
Principales competidores & aplicaciones alternativas
Aplicaciones con una alta probabilidad de ser utilizadas por los mismos usuarios, desde la misma tienda.
iSmith
splotRF
matchedRF
RF Path
25iciembre d, 2025