Looking for the latest insights? Contact us.
The world of online shopping is fiercely competitive, with a plethora of retailers vying for consumers’ eyeballs and wallets. Measuring both time spent online and the number of pages visited is crucial for retailers trying to build and grow their online business. Only retail giants like Amazon and eBay have mastered the art of capturing and keeping shoppers engaged, with average Desktop sessions lasting 9:43 minutes.
Most retailers who began in traditional brick-and-mortar stores are not yet performing well in these metrics. Top performers like Kohl’s and IKEA only average 7:49, almost 2 minutes less than Amazon and eBay.
We looked at the top online U.S. retailers, measured by the volume of web traffic. We compared multichannel retailers that transitioned their business from traditional stores to develop successful websites and apps, with online-only retailers. The latter include e-commerce giants Amazon and eBay, who together see more traffic than the next 23 retailers combined.
Online-only retail outperforms multichannel
Online-only retailers performed better at attracting visitors to their websites, keeping them engaged longer, and encouraging them to visit more pages per session. On average, desktop visitors spent 22% more time and visited 7% more pages per visit on online-only retailers’ sites than they did on multichannel stores’ sites. This trend was also true for mobile web visits.
Presumably, multichannel retailers are counting on consumers to spend time in their brick-and-mortar stores, browsing many more items than they do online. Still, online-only retailers, with more extensive experience, consistently outperform multichannel.
Not surprisingly, desktop visits rank higher for engagement, as people are likely to spend more time shopping on their computers, where product images are bigger and navigation is easier.
Time online is money
The average time spent on a website is a strong indicator of engagement, and in the case of retail, it is also an important predictor of the site’s ability to convert visitors into buyers. As expected, the most successful sites in this metric are four online-only retailers: eBay, Zulily, Amazon, and Etsy.
These stores created an online experience that keeps visitors engaged the longest.
For multichannel retailers, while time spent on-site is a measure of how successfully they’ve been able to extend their business online, it doubles as a key indicator of complementary shopping of the in-store experience. For both of these reasons, it’s particularly important that multichannel retailers strengthen this metric.

The most improved in this category is JCPenney, which increased its average time per visit from 6:42 in October 2014 to 7:40 in October 2015, an increase of 12%. This increase is probably a reflection of the company’s successful comeback in Q2 of 2015 and a transition to a much-lauded new CEO.
For multichannel vs. online-only retail, sometimes, more is more
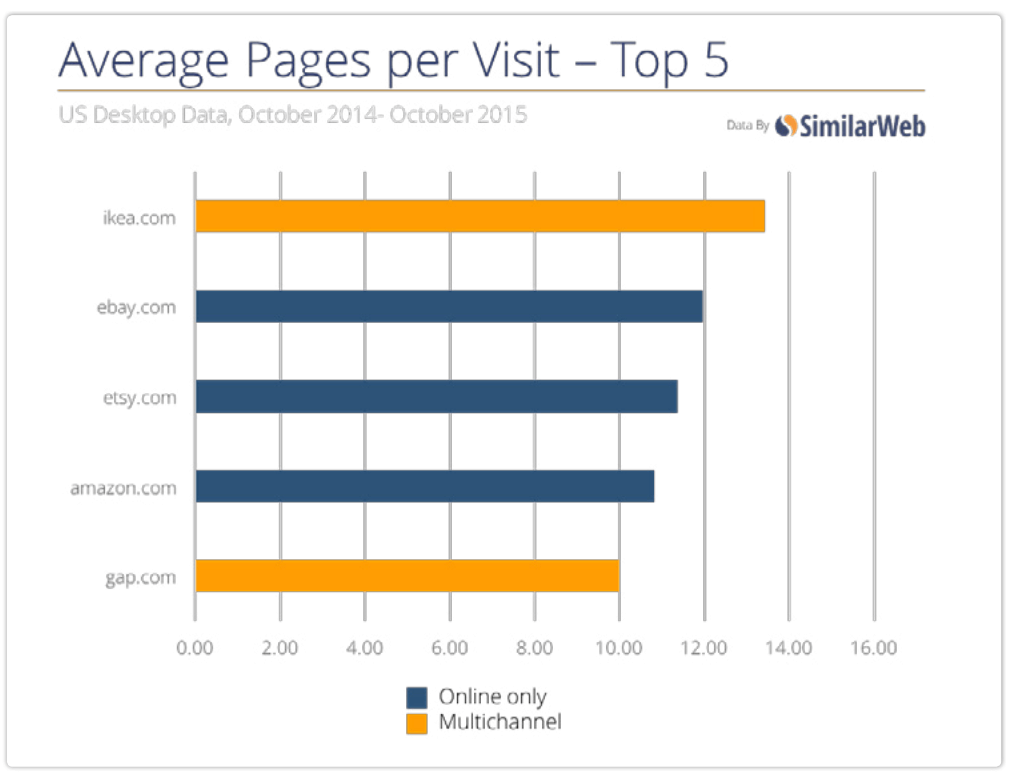
The other important engagement metric is the number of pages per visit, which for retailers indicates the site’s ability to attract visitors’ attention to more items. Here, the online-only retailers are not as dominant as they are in the visit duration category, but they are still ahead of the multichannel retailers as a whole.
One notable multichannel retailer is IKEA, outperforming the competition with the highest number of pages visited per session. In the 12-month period studied, IKEA’s average reached 13.42 on desktop and 10.62 on mobile. Both of these figures were the highest average of all 25 retailers in this study. IKEA successfully designed its site to reproduce its in-store experience, which forces visitors through a maze of products.
Multichannel stores more dependent on the Holiday Season
Online retailers follow a similar traffic pattern across the board, with traffic spiking during November and December when many offer holiday specials. (eBay is a notable exception in this case, with fairly stable Web traffic year-round, suggesting its auction model does not follow the traditional holiday sale pattern). However, when comparing the holiday volatility between the two categories in this study, we see that multi-channel retailers experience a far larger spike in traffic between October and December, and ultimately a more significant decrease after the end of the year.
From Oct. to Dec. 2014, online-only retailers saw their traffic rise by 41%. Meanwhile, multichannel retailers saw a staggering 84% increase in traffic. What came easily also went easily, though, and after the holidays the drop for multichannel retailers was sharper.
More channels, more challenges
Multichannel retailers have an advantage in their physical presence, but they also encounter a challenge; they must balance the cost of a brick-and-mortar presence with the unique marketing and engagement needs of an online retailing operation. Traditional retailers have to leverage their name and brand recognition to capture their customer’s attention online. In order to do so, they must work to improve their sites’ engagement metrics and provide shoppers with a complementary experience to the one they have in stores.
Similarweb’s Digital Insights Team will continue to research eCommerce traffic behavior and offer analysis that reveals actionable insights for retailers and their marketing teams. For more detailed information, please contact our Digital Insights Team via press@similarweb.com.
The data in this report was compiled from U.S. mobile and desktop web traffic data using Similarweb’s proprietary marketing intelligence platform, including market research and analysis. Similarweb data comes from 4 main sources:
- A panel of over 100 million monitored devices, is currently the largest panel in the industry.
- Local Internet service providers (ISPs) are located in many different countries.
- Our web crawlers scan every public website to create a highly accurate map of the digital world.
- Hundreds of thousands of direct measurement sources from websites and apps that are connected with us directly.
