Market Mapping Your Competitive Position: Why It Matters and How To Do It

Market mapping is a data-driven market research strategy that removes guesswork, and allows you to strategically position yourself in a market.
In competitive environments, the big names who make the most noise aren’t always the ones you should be paying attention to.
Your biggest threat could be flying under the radar while you’re distracted by companies that just don’t matter.
So, how well do you know your competitors?
Unless your answer is rooted in data, you can’t really be sure.
Keep reading to see how you can use market mapping as a competitive advantage.
What is market mapping?
Market mapping is a method of visualizing your position or product within a specified market. You create different market segments to measure and benchmark against. It’s a type of market positioning map that takes into account various forces in your market, such as supply, demand, and saturation, and where you fit into the puzzle.
Market mapping gives you a complete picture of your competitive landscape, including customer segments, product comparisons, and market forecasting. Market segmentation actually works similarly to a traditional SWOT analysis in that it recognizes your strengths, weaknesses or gaps, opportunities, and threats. By projecting your competitive landscape onto a value graph, you can easily gauge competitive advantages and disadvantages.
But let’s start at the beginning. In every analysis, you first need to define your objective. In this case, the goals you set determine the type of market mapping you need to execute, and the values you’ll use in your market positioning map.
How to do market mapping
Companies of all sizes and at all stages can leverage the benefits of market mapping. The concept is useful when you want to enter a new market, launch a new product, increase market share, strengthen your position, and evaluate products against competitors. Let’s take a look at some market map examples that serve different purposes.
Market mapping competitors
Imagine you’re a start-up company and need to create your go-to-market strategy. Or you are an existing company defending your rank against the competition. You’d want to understand who the strongest players in the market are. In this case, you’ll position companies on a graph representing relevant measures such as yearly revenue and reach, or product range and price level.
When you view the various companies on the competitive map, you can detect gaps or weak points in the market that present an opportunity for you.
Let’s get even more specific. If your purpose is to identify how successful companies are in their marketing effort, you would evaluate traffic share and conversion rate, for example. Find out where your competitors are positioned on the graph and benchmark against them.
You’ll quickly see who is more successful and can pinpoint companies that you want to continue analyzing to understand their strategy.
Market mapping products
Mapping products is another example of how you can identify your competitive position.
Let’s say, you are about to launch a new product and need to figure out the best way to introduce it into the market. Or better yet, you think it’s time to innovate and need to present your audience with something new. Which benefits should you focus on? Which audience should you target?
You need to conduct a competitive analysis to determine how different products are positioned in terms of features, quality, and price. In this case, you will plot products on a graph with product-related parameters. Do low prices correlate to low quality? How do high-tech vs. low-tech products fare? If you put your product at a higher price, what would your customers’ expectations be?
For SaaS apps, this could include complex vs. simple, extensive range of features vs. limited functionality or the number of subscription packages. For eCommerce, this could include the quality or pricing of a particular product.
Market mapping the audience
Another type of market mapping focuses on the customer. For example, an eCommerce marketer may focus on the frequency of purchases or website demographics such as age, gender, or location. You’ll create a map to identify which type of people are your best customers. This lets you target the prospects with the highest potential of buying from you.
You get the idea. Define what you want to measure and find the relevant metrics that provide you with accurate, representative data.
You can use any type of data point to identify your competitive positioning among your audience. If you need to position yourself in terms of popularity, you will take engagement metrics, such as active users, bounce rate, click-through rate, and more, and plot each company’s position on the graph.
What is a market positioning map?
Most market map examples include the well-known market positioning map. It’s a visual comparison of your product vs. that of your rivals. Based on which features are important to your customers, you take two, then plot these benefits on an X and Y axis of a graph. It allows you to assess the competition, spot opportunities for new product development, and determine how a company will position itself in a market.
How to do market mapping
The best way to pinpoint your competitive position in the market is to use a price-benefit graph, in which one axis measures price, and the other evaluates the main benefit offered. The idea is to identify the factors that dictate prices so that you can increase profit.
However, calculating the value of a benefit offered by a particular company is rather complex. Another possibility is to calculate market share against other parameters such as sales volume, product range, and price level.
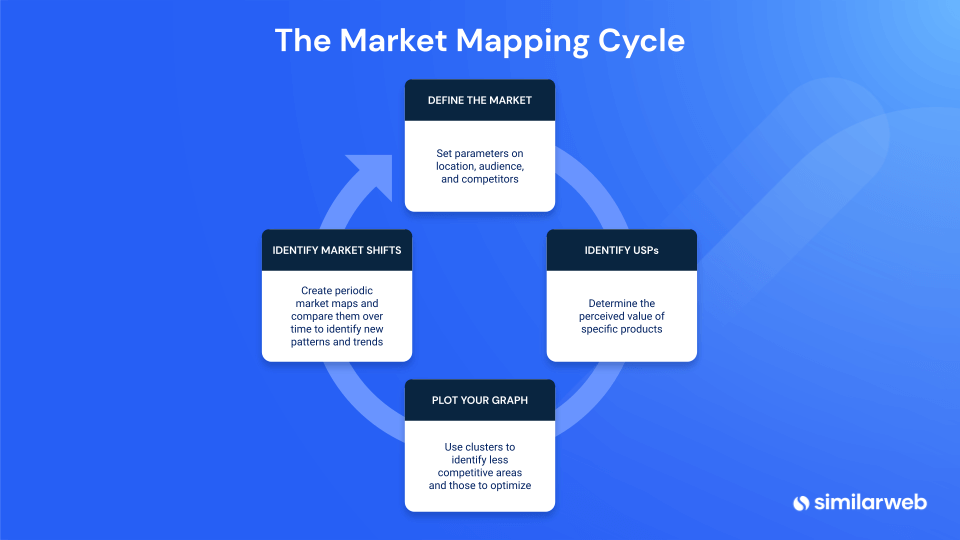
1. Define your market, customer, and competitor coordinates
The first step of every market map is to define the market. Set the borders for location, potential customers, and competitors.
This means defining the geographical region(s) you sell to (or want to sell to) and identifying who the relevant competitors and audiences in the area(s) are. Your competitors should include all companies that solve the same issue as your product or address the same customer needs. It’s a good idea to make a target audience analysis, using your competitors’ audiences as a benchmark.
2. Pinpoint your unique selling points
Identify the unique benefit each competitor offers. Understand which features or advantages represent their unique selling point (USP). An analysis of features and prices lets you determine the perceived value of specific benefits or products.
If you are looking for a more straightforward way, choose the KPIs relevant to your evaluation. For example, you could map competitors according to market share and product range. You will learn the ideal product range for your market and at what point having to broad of a range turns into a disadvantage.
3. Measure your market share
Plot each company and its product offering on the graph. In a price-benefit diagram, you’ll have clusters in some areas and can quickly identify less competitive areas.
If you are measuring market share and price level, you can identify the optimal price range and gaps in product offerings to the market. You can also view market share in relation to age to identify the best age group to target or find missing age groups.
4. Map your market regularly
Take it one step further. Keep tracking the data and creating periodic market maps. Comparing them over time helps you visualize shifts in the market, identify emerging trends, and anticipate competitors’ moves. Use them to pinpoint who’s strategies and data you need to investigate further.
Get a competitive advantage
Market mapping is extremely useful for positioning yourself in the competitive arena. You can discover exactly who is outperforming you in which area and where you rank for specific KPIs. As such, market mapping is highly relevant as part of your market research. It helps point you to the areas and the data you need to dive into.
The market mapping method is a great way to identify gaps in specific areas. On the other hand, not every gap means there’s market potential. You may have to experiment with different parameters until you create a market map that can give you actionable insights.
Watch our 2-minute video on how to run an effective competitive analysis:
Another pain point you may face is the simplicity of market mapping when it is limited to specific data points. The map helps you see the market from a particular angle but does not provide clues as to how or why. That’s why you need to dig deeper into your analytics to get insights that support strategic decision-making.
Your market mapping partner
Similarweb’s Research Intelligence tool allows you to view your competitor’s data as if it were your own from any chosen metric and use it to create a comprehensive and accurate competitive market map.
Our role in helping you map your competitive position starts with the first step. Our analytics platform helps you clearly define your market for your competitive mapping. You can identify audience geographics and demographics and find the relevant competitors in the target market.
Similarweb analytics lets you dive deeper into your market analysis and research. Engagement metrics and app analysis help you gauge the volume of visitors to different pages and features. You can understand the level of activity and engagement. Investigate audience demographics and understand who is targeting the same audience. Also, identify which competitors are most successful with which audience.
You can also uncover channels that drive traffic to their sites to identify your competitors’ marketing strategies. Understand their SEO strategies by finding which keywords drive traffic and where.
Now that you understand the value of market mapping, it’s time to start! Try Similarweb for free and start tracking your competitive performance today.
Track your digital metrics and grow market share
Contact us to set up a call with a market research specialist


