2022 Industry Benchmarks to Boost Your eCommerce Strategy

If you’re an eCommerce marketer, researcher, or strategist, measuring performance is probably one of your main responsibilities. But to do so effectively, you need to focus on the right data. In other words, you need to understand what your competitors and industry are doing to drive traffic, and how you stack up against them. In short, you need to conduct competitor benchmarking.
As part of a series of blogs using the latest data for 2022, this article reveals must-have competitive eCommerce benchmarking metrics for your business. These insights will help you contextualize both consumer and purchase behavior based on your digital strategy and marketing budget.
See how Similarweb can support your post-mortem analysisAll of the engagement benchmarks in the blog post are based on Similarweb data for January 2022, looking at total traffic to the top websites in the category, worldwide.
Why should you benchmark online shopping habits?
Online shopping has become one of the most popular online activities. According to Statista, eCommerce and shopping sales in the U.S. were estimated at $768 billion in 2021, and by 2025 that number could reach roughly $1.3 trillion. That’s a lot of add-to-carts.
With 12-24 million eCommerce websites around the world, it’s never been more important to benchmark your digital performance against the competition.
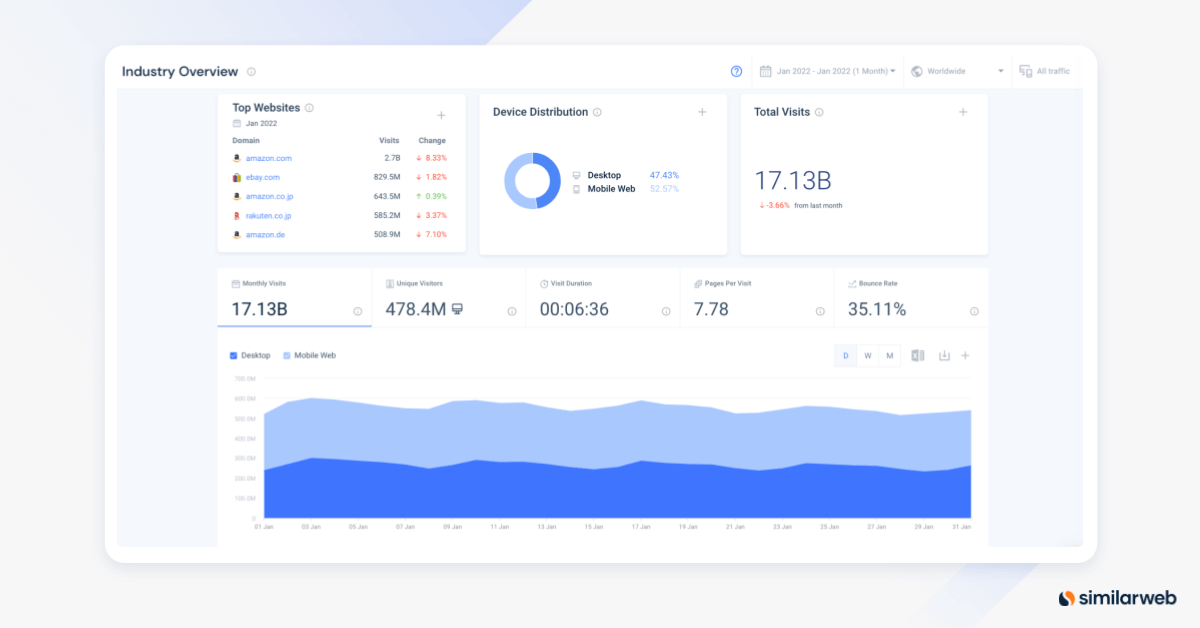
Let’s start by looking at total visits over time to the top 100 eCommerce businesses. We can see that the industry is still growing year-over-year (YoY), although not as rapidly as at the peak of COVID-19. Total visits grew 11% in 2020, compared to only 1.5% last year.
January 2022 saw 17.1 billion visits worldwide, a slight dip after the classic holiday spikes in traffic.
How does your own performance compare? Read on to find out why you’re either leading the pack or falling behind the industry benchmark.
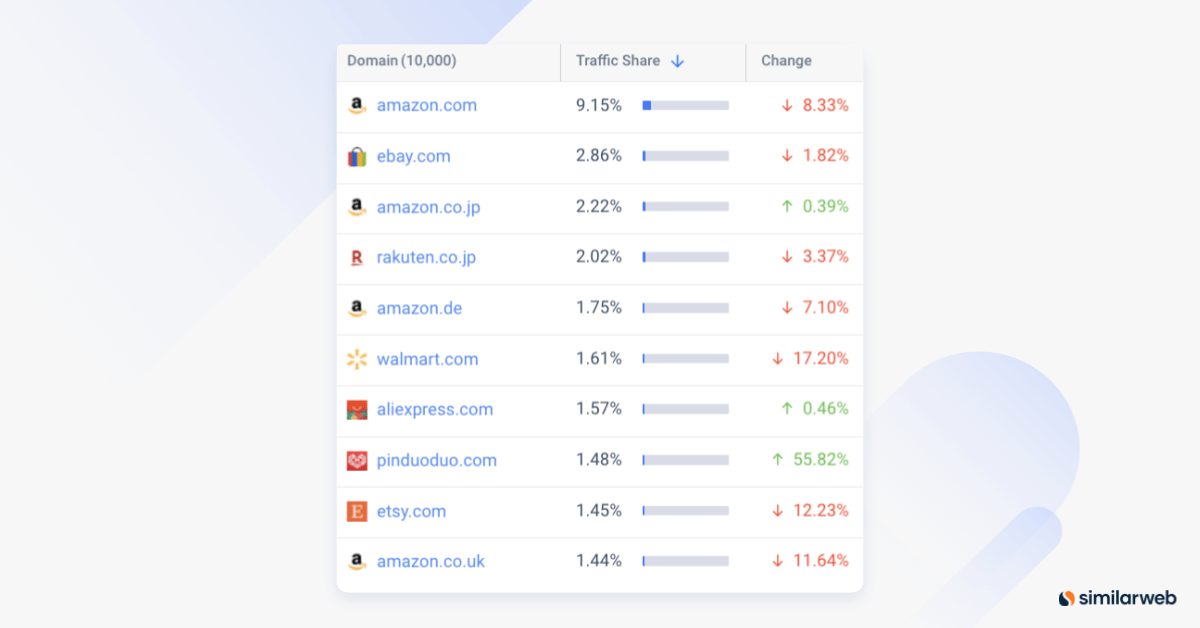
Top 10 eCommerce websites by traffic share
Despite the growing number of online retailers, amazon.com, ebay.com, and rakuten.co.jp maintain their leading positions. Amazon’s top global domains – in the U.S., Japan, Germany, and the U.K. – are all ranked in the top 10 eCommerce websites worldwide and collectively responsible for just nearly 15% of the category’s traffic. In the U.S., Amazon dominates with roughly 33% of traffic share, followed by eBay with 10%, and Walmart with 7%.
Although the market is dominated by these powerhouse brands, traffic share for seven of the top 10 websites decreased in January 2022, which means there’s more room for up-and-coming players.
Device split: Desktop vs. mobile web
We can expect mobile usage to top eCommerce sites to continue to grow in 2022. The norm is to be able to shop from anywhere, at any time. Compared to January 2021, we’ve seen a 1% jump for mobile compared to a slight decrease for desktop.
Top 100 websites in the category:
- Desktop – 47% (vs. 48% in 2020)
- Mobile Web – 53% (vs. 52% in 2020)
Pro Tip: As mobile continues to drive the lion’s share of traffic, make sure your website is smartphone-friendly, loads quickly, and allows for easy scrolling and purchasing. You want shoppers to be able to browse, search, and view products just as they would from desktop computers.
Traffic acquisition sources (by marketing channel)
Various marketing channels send visitors your way. To know which to invest in, you need to understand how they’re performing.
Consider this: Worldwide direct brought in 56% of eCommerce traffic in January 2022, while organic drove 26%. The value of building brand awareness and a competitive organic strategy is clear — recognition plays a big part in consumers’ purchase decision process.
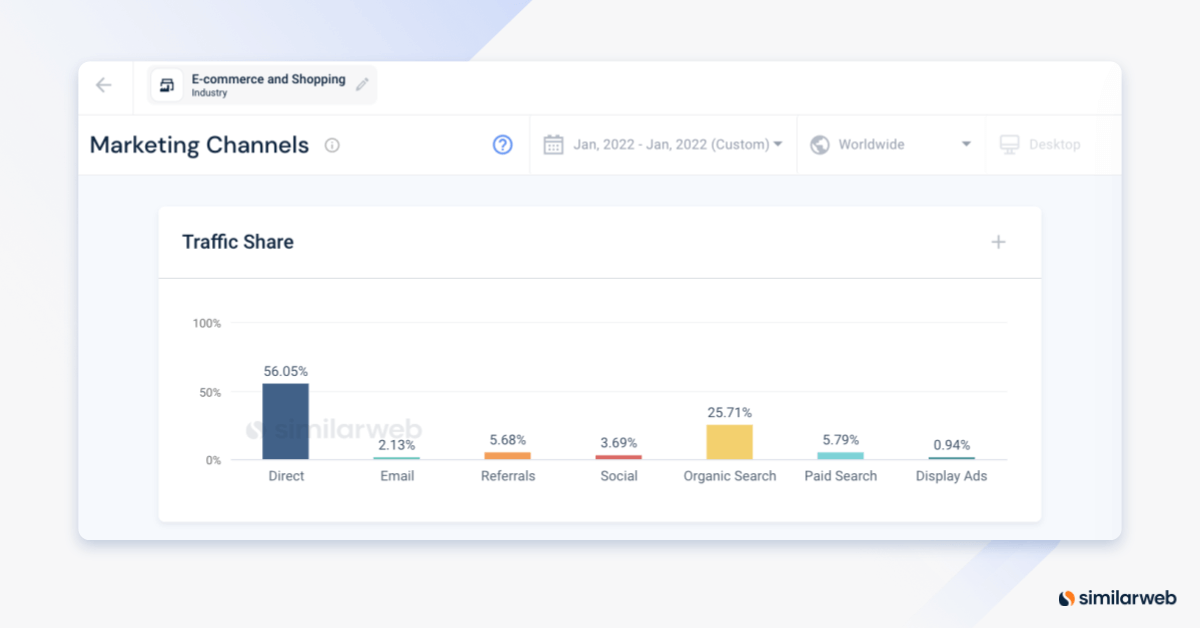
- Direct – 56.1% (vs. 55.4% in 2021)
- Email – 2.1% (vs. 2.1% in 2021)
- Referrals – 5.7% (vs. 5.6% in 2021)
- Social media – 3.7% (vs. 3.7% in 2021)
- Organic search – 25.7% (vs. 26.7% in 2021)
- Paid search – 5.8% (vs. 5.6% in 2021)
- Display ads – 1.0% (vs. 1.0% in 2021)
Pro Tip: Compare the eCommerce stats above with your user acquisition sources to see where you might be underperforming. Also, look for shifts and trends over time.
Free vs. paid traffic
Free traffic vs. paid, or acquired, traffic is another way of looking at the same traffic acquisition sources above (i.e. by combining them). Free traffic refers to organic search, direct, email, and social media; paid traffic refers to referrals, paid search (PPC/SEM), and display advertising.
- Free traffic – 87.6%
- Paid traffic – 12.5%
Pro Tip: Use the benchmark above to gauge the effectiveness of your digital strategy: Are you spending too much or too little money on capturing new leads?
Search traffic: SEO vs. PPC
Besides marketing channels and free traffic vs. paid traffic, there’s a third and equally important way to benchmark eCommerce traffic and that’s by looking specifically at search traffic: organic vs. paid (or SEO vs. PPC). A changing SEO-to-PPC ratio indicates that it is, in general, more difficult for retailers and brands to maintain an organic traffic pipeline, or that they’re focusing on specific, long-tail keywords that have less competition.
Pro Tip: Compare your SEO-to-PPC ratio to the industry average and look at your rivals’ online behavior to find opportunities to increase your PPC spend (when they’re higher) or decrease it (when they’re lower).
Read More: eCommerce SEO 101: Best Practices for Online Stores

Measuring stickiness: Unique visitors/total visits
Engagement metrics are the most relevant performance indicator for benchmarking online shopping. Website stickiness is one of the most common (and possibly most important) user engagement metrics to track if you want your eCommerce business to thrive in 2022.
Stickiness, which is defined as the average number of days in the month in which a user made a purchase on the retailer’s website, out of all the users who made a purchase, is another indicator of brand awareness and loyalty: the higher the number; the more loyal the consumer.
On average, a returning or “sticky” visitor is 70% more likely to add a product to their cart than a new visitor.
Top 100 websites in the category:
- Unique visitors/total visits: 4.5 billion/17.2 billion; 26.2%
Top 25 websites in the category:
- Unique visitors/total visits: 2.6 billion/11.0 billion; 23.6%
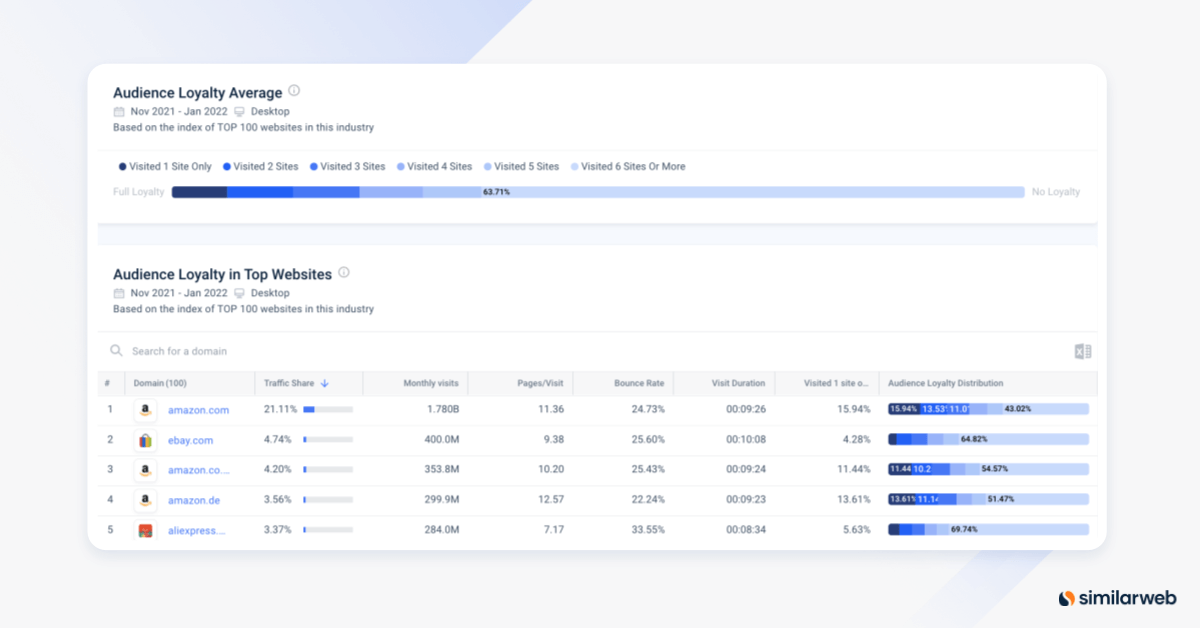
Pro Tip: A site with a low visits-to-unique visitors ratio has a less involved audience, whereas a site with a high ratio has a better rate of engaged visitors.
Key on-site engagement metrics
Your visitors’ on-site experience and satisfaction play a crucial role in determining whether they’ll continue to browse and shop in your store. Does your site load quickly? (Decreasing your website’s load time by just 0.1 seconds can increase conversion rates by up to 8%) Are users spending a long period of time on your site? Is a large percentage of visitors leaving after viewing just one page? (Also known as Bounce Rate).
- Average visit duration – 6 min 36 sec (vs. 6min 52sec in 2021)
- Average pages per visit – 7.8 (vs. 8.0 in 2021)
- Average bounce rate – 35.1% (vs. 36.0% in 2021)
Pro Tip: If your average visit duration and pages per visit are lower than the industry average, your website delivers a bad user experience to customers. Look for common signs of bad UX that can be removed and addressed.
eCommerce conversion rate benchmarks in 2022
At the end of the day, this is what really matters. A conversion rate (CVR) – also known as checkout or cart completion in eCommerce – is the backbone of any customer journey and your ultimate indicator of success.
To improve yours, you need to understand at which point potential buyers drop out of the funnel. Start by benchmarking your eCommerce conversion rate against industry standards.
For select eCommerce websites, the global average CVR is 7.7% (January–September 2021), compared to 6.6% the year prior.
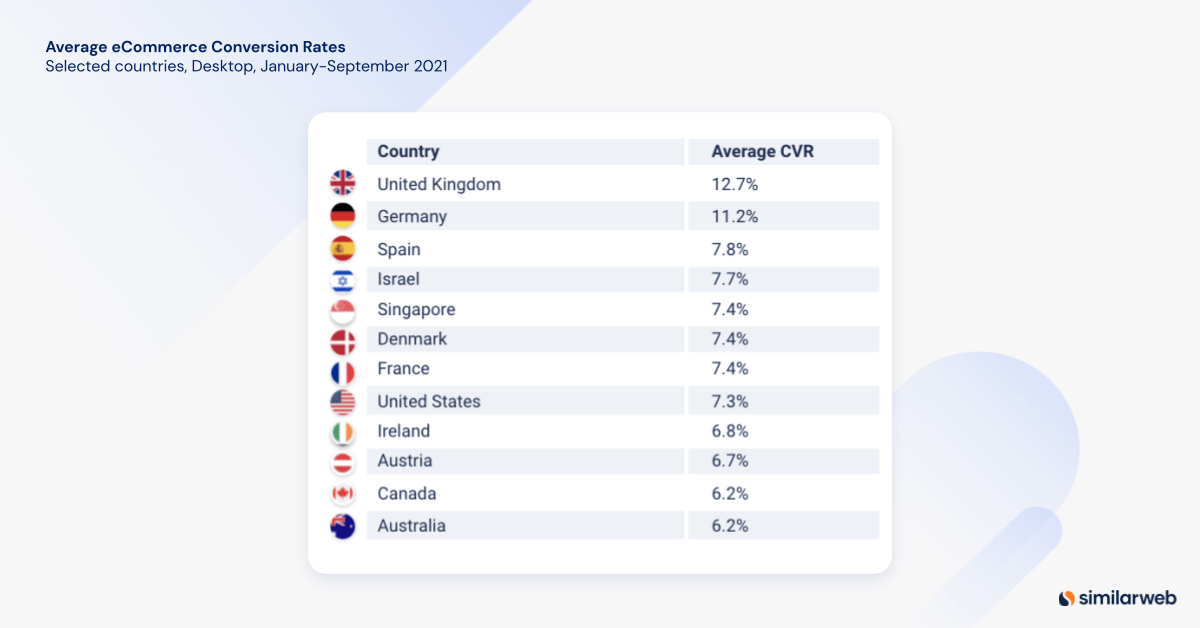
You can also use subcategory eCommerce benchmarks to analyze specific products and get a more accurate window into your performance.
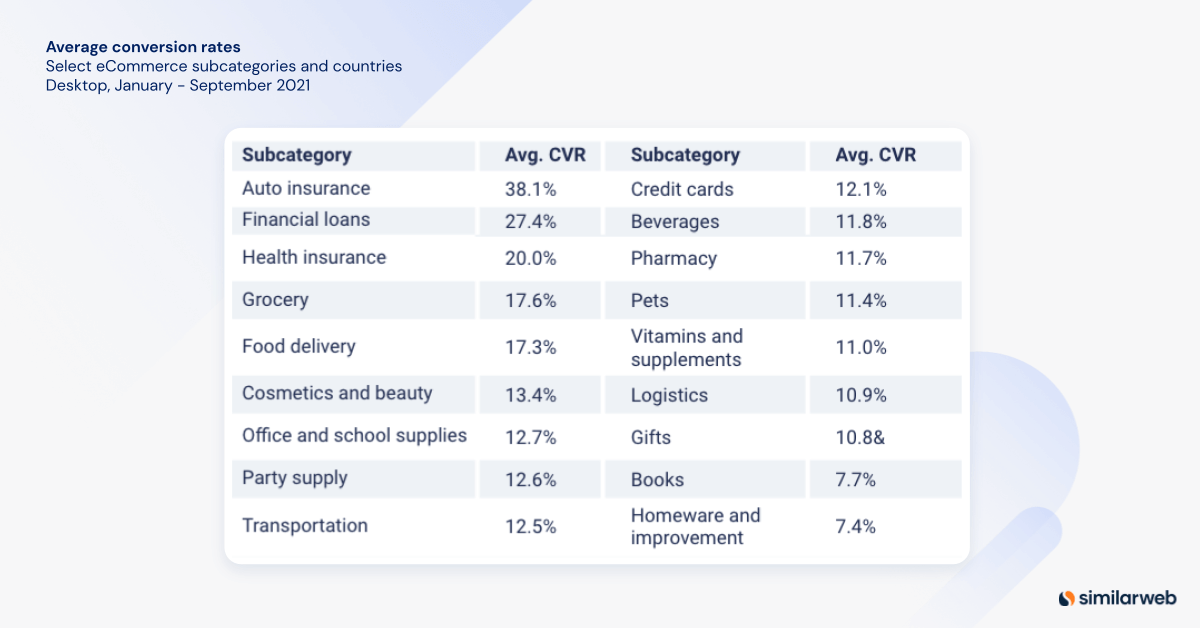
In the last year, essential items like auto and health insurance have had some of the highest conversion rates at 38.1% and 20% respectively.
With many individuals still working or studying at home, conversions for food delivery (17.3%), office and school supplies (12.7%), and books (7.7%) were also high throughout 2021.
At 11.4% CVR, pet supplies also ran high — possibly due to a large number of pandemic pets adopted.
Check out how your subcategory compares to averages across select countries:
Start collecting eCommerce benchmarks today
A competitive edge in the eCommerce world requires something that no one else has – the ability to adapt to market shifts before the rest.
Benchmarking helps you spot traffic and engagement changes, market shifts, and consumer habits early, so you can adapt quickly in an industry that’s evolving fast.
To learn more about using Similarweb to track your performance online, schedule a demo of Research Intelligence today.
FAQ
How do you attract customers to buy your product?
Use recognition to influence consumer purchase decision process.
How can I boost my eCommerce sales?
Start by benchmarking online shopping habits of your audience.
The ultimate edge in marketplace intelligence
Put the full picture at your fingertips to drive product views and sales


