87 Amazon Statistics and Facts Every Retailer Should Know

When I shop for anything online, the first place I check is Amazon. It’s easy, offers fast shipping, and my credit card and home address are already saved. In a world where convenience is key, it’s the obvious choice. And I’m not alone.
Amazon revolutionized the world of eCommerce years ago, but the pandemic is where it really shined.
The marketplace took on the challenges of COVID-19 and capitalized on consumers’ needs for buying everything, and we mean everything online. Between groceries, home goods, health supplements, electronics, and even furniture. There really isn’t anything you can’t find on Amazon anymore. It makes sense that last year nearly 50% of all eCommerce purchases in the U.S. happened through Amazon.
Using data from Similarweb Shopper Intelligence and Research Intelligence, we’re diving into 87 key Amazon statistics you need to know to make sure that you get the most of your marketplace listings and set yourself up for success in the eCommerce world.
The basic Amazon statistics everyone should know
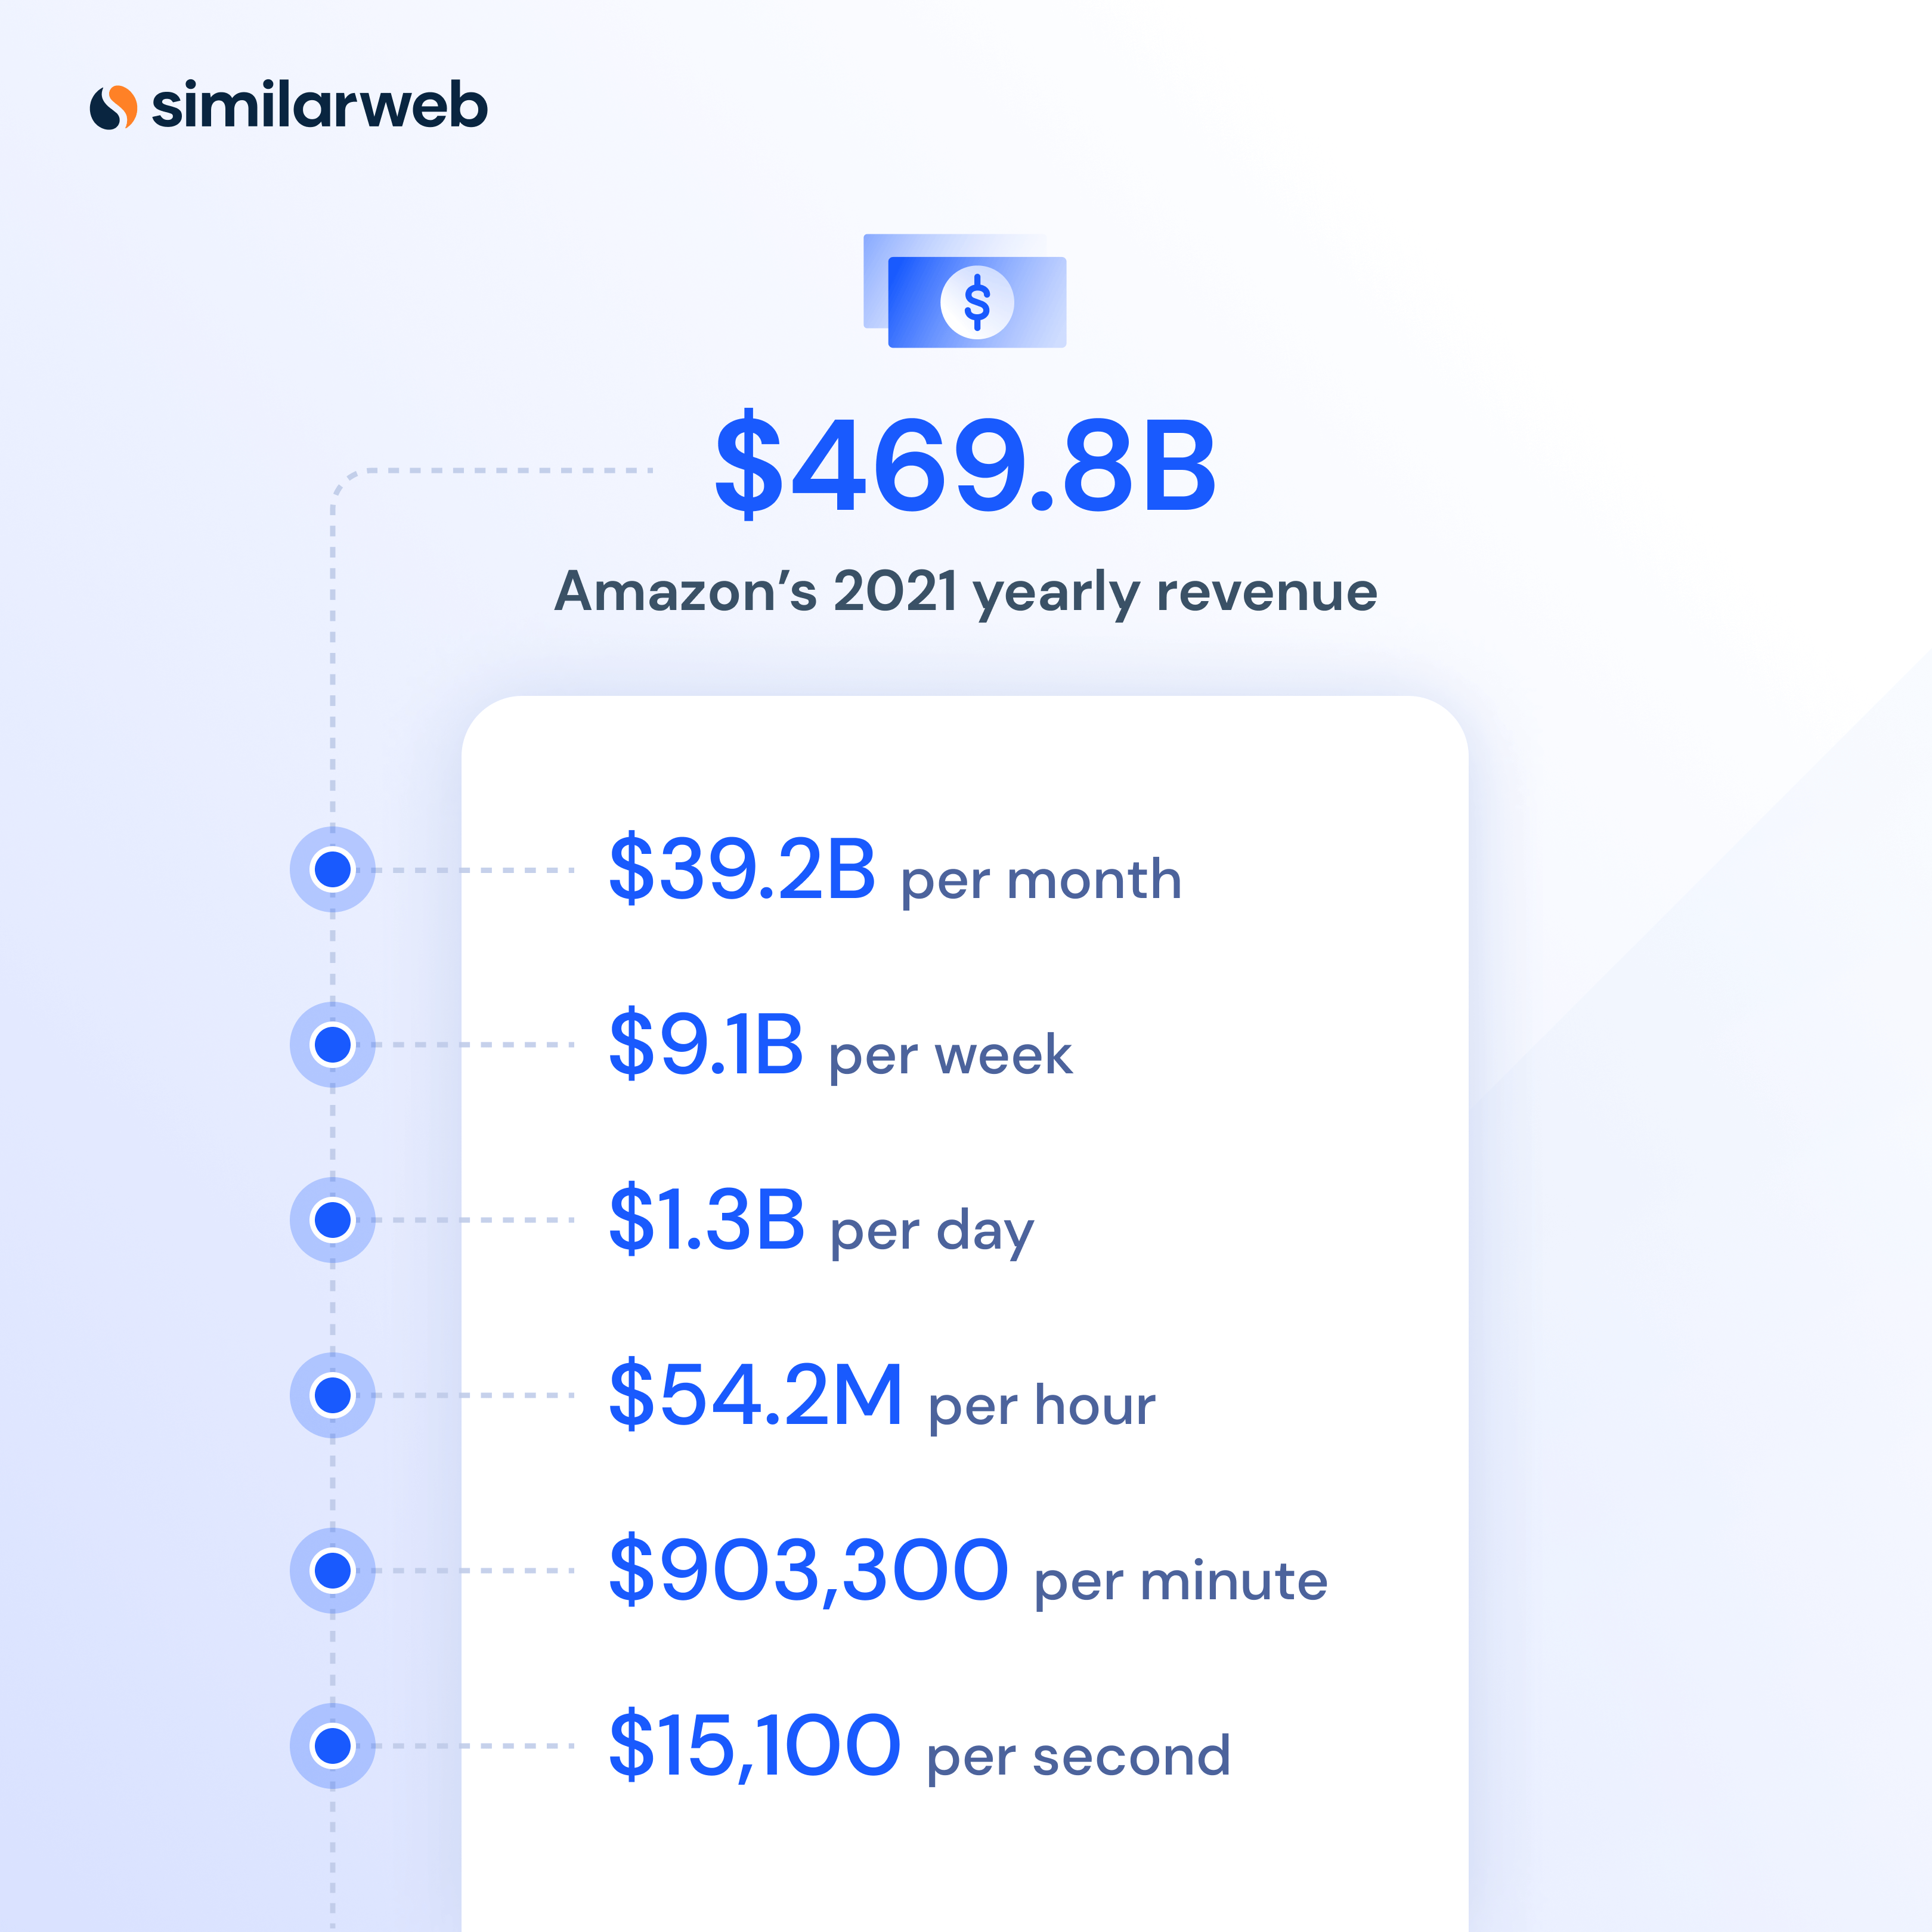
Amazon’s yearly revenue in 2021 was $469.8 billion.
So, how much does amazon make a day? per minute? per second?
That’s $39.2 billion per month, roughly $9.1 billion a week, $1.3 billion per day, $54.2 million per hour, $903,300 per min, and $15,100 per second.
Before we get into some of the nitty-gritty Amazon stats, let’s take a look at some key website metrics, and just how much the marketplace stands out from the competition. Since Amazon operates across different domains determined by country, we’re focusing solely on Amazon U.S. (amazon.com).
Amazon website traffic
- Q1 2022: 5.6 billion visits to Amazon.com (U.S) on both desktop and mobile web.
- 2021: 24.2 billion visits to amazon.com
This year, monthly visits have hovered around 1.2 billion in the U.S. on desktop only, a slight drop compared to the year before (1.3 billion) but this is to be expected given the return of in-person shopping and new consumer behavior. Website traffic is still steady, suggesting that Amazon has converted consumers who once shopped for certain goods unavailable in-store during the pandemic (groceries, home goods, pharmaceuticals, etc) to digital natives.
The following Amazon statistics are based on engagement data from May 2021-April 2022, desktop only.
- Total visits – There were 15.8 billion visits to Amazon’s desktop site between May 2021-April 2022.
- Bounce rate – The percentage of Amazon visitors who viewed only one page before leaving (or bouncing) the site stands at 22.0%.
- The average pages per visit for this time period are 11.6.
- The average session duration in the last year was 9 minutes and 32 seconds.
- Unique visitors – Average unique visitors (meaning the number of people using Amazon not duplicated between devices) from April 2021-April 2022 is 115.2 million.
- There were 15.3 billion page views on Amazon in the last year.
- Market share – Amazon earns 56.8% of traffic share compared to the top 100 marketplace websites in the U.S. (based on the last three months).
- Amazon’s top competitors in the U.S. are ebay.com, walmart.com, etsy.com, and target.com.
- Marketing channels – On desktop, direct is the most popular way to reach Amazon (61.6%), followed by organic search (20.9%), and referrals (5.4%).
- Desktop vs. mobile web split – 66.6% of web traffic comes from desktop, compared to 33.4% on mobile web.
Some important Amazon business statistics include:
- More than 4,000 items are bought in a minute on Amazon, from 12 million different products offered
- There are over 300 million active users on Amazon.
Amazon stats worldwide
Because Amazon operates across different domains, it’s important to analyze performance in specific countries to really understand the scope of the marketplace giant. Below we break down some Amazon statistics in some of its target markets outside of the U.S. (Desktop only, May 2021-June 2022).
U.K. – amazon.co.uk
- Total visits – 2.4 billion
- Average monthly visits – 200.2 million
- Unique visitors – 19.1 million
- Visit duration – 8 minutes 28 seconds
- Pages per visit – 10.3
- Bounce rate – 24.4%
- Page views – 2.1 billion
France – amazon.fr
- Total visits – 1.1 billion
- Average monthly visits – 94.8 million
- Unique visitors – 13.2 million
- Visit duration – 9 minutes 30 seconds
- Pages per visit – 12.1
- Bounce rate – 23.3%
- Page views – 1.1 billion
Germany – amazon.de
- Total visits – 2.6 billion
- Average monthly visits – 219.0 million
- Unique visitors – 20.4 million
- Visit duration – 9 minutes 08 seconds
- Pages per visit – 12.2
- Bounce rate – 22.4%
- Page views – 2.7 billion
Japan – amazon.co.jp
- Total visits – 4.0 billion
- Average monthly visits – 332.9 million
- Unique visitors – 24.4 million
- Visit duration – 9 minutes 08 seconds
- Pages per visit – 9.9
- Bounce rate – 26.2%
- Page views – 3.3 billion
Amazon product statistics
Website traffic analytics reveals how many consumers are visiting Amazon’s website over time, but how many of those visitors convert into paying customers?
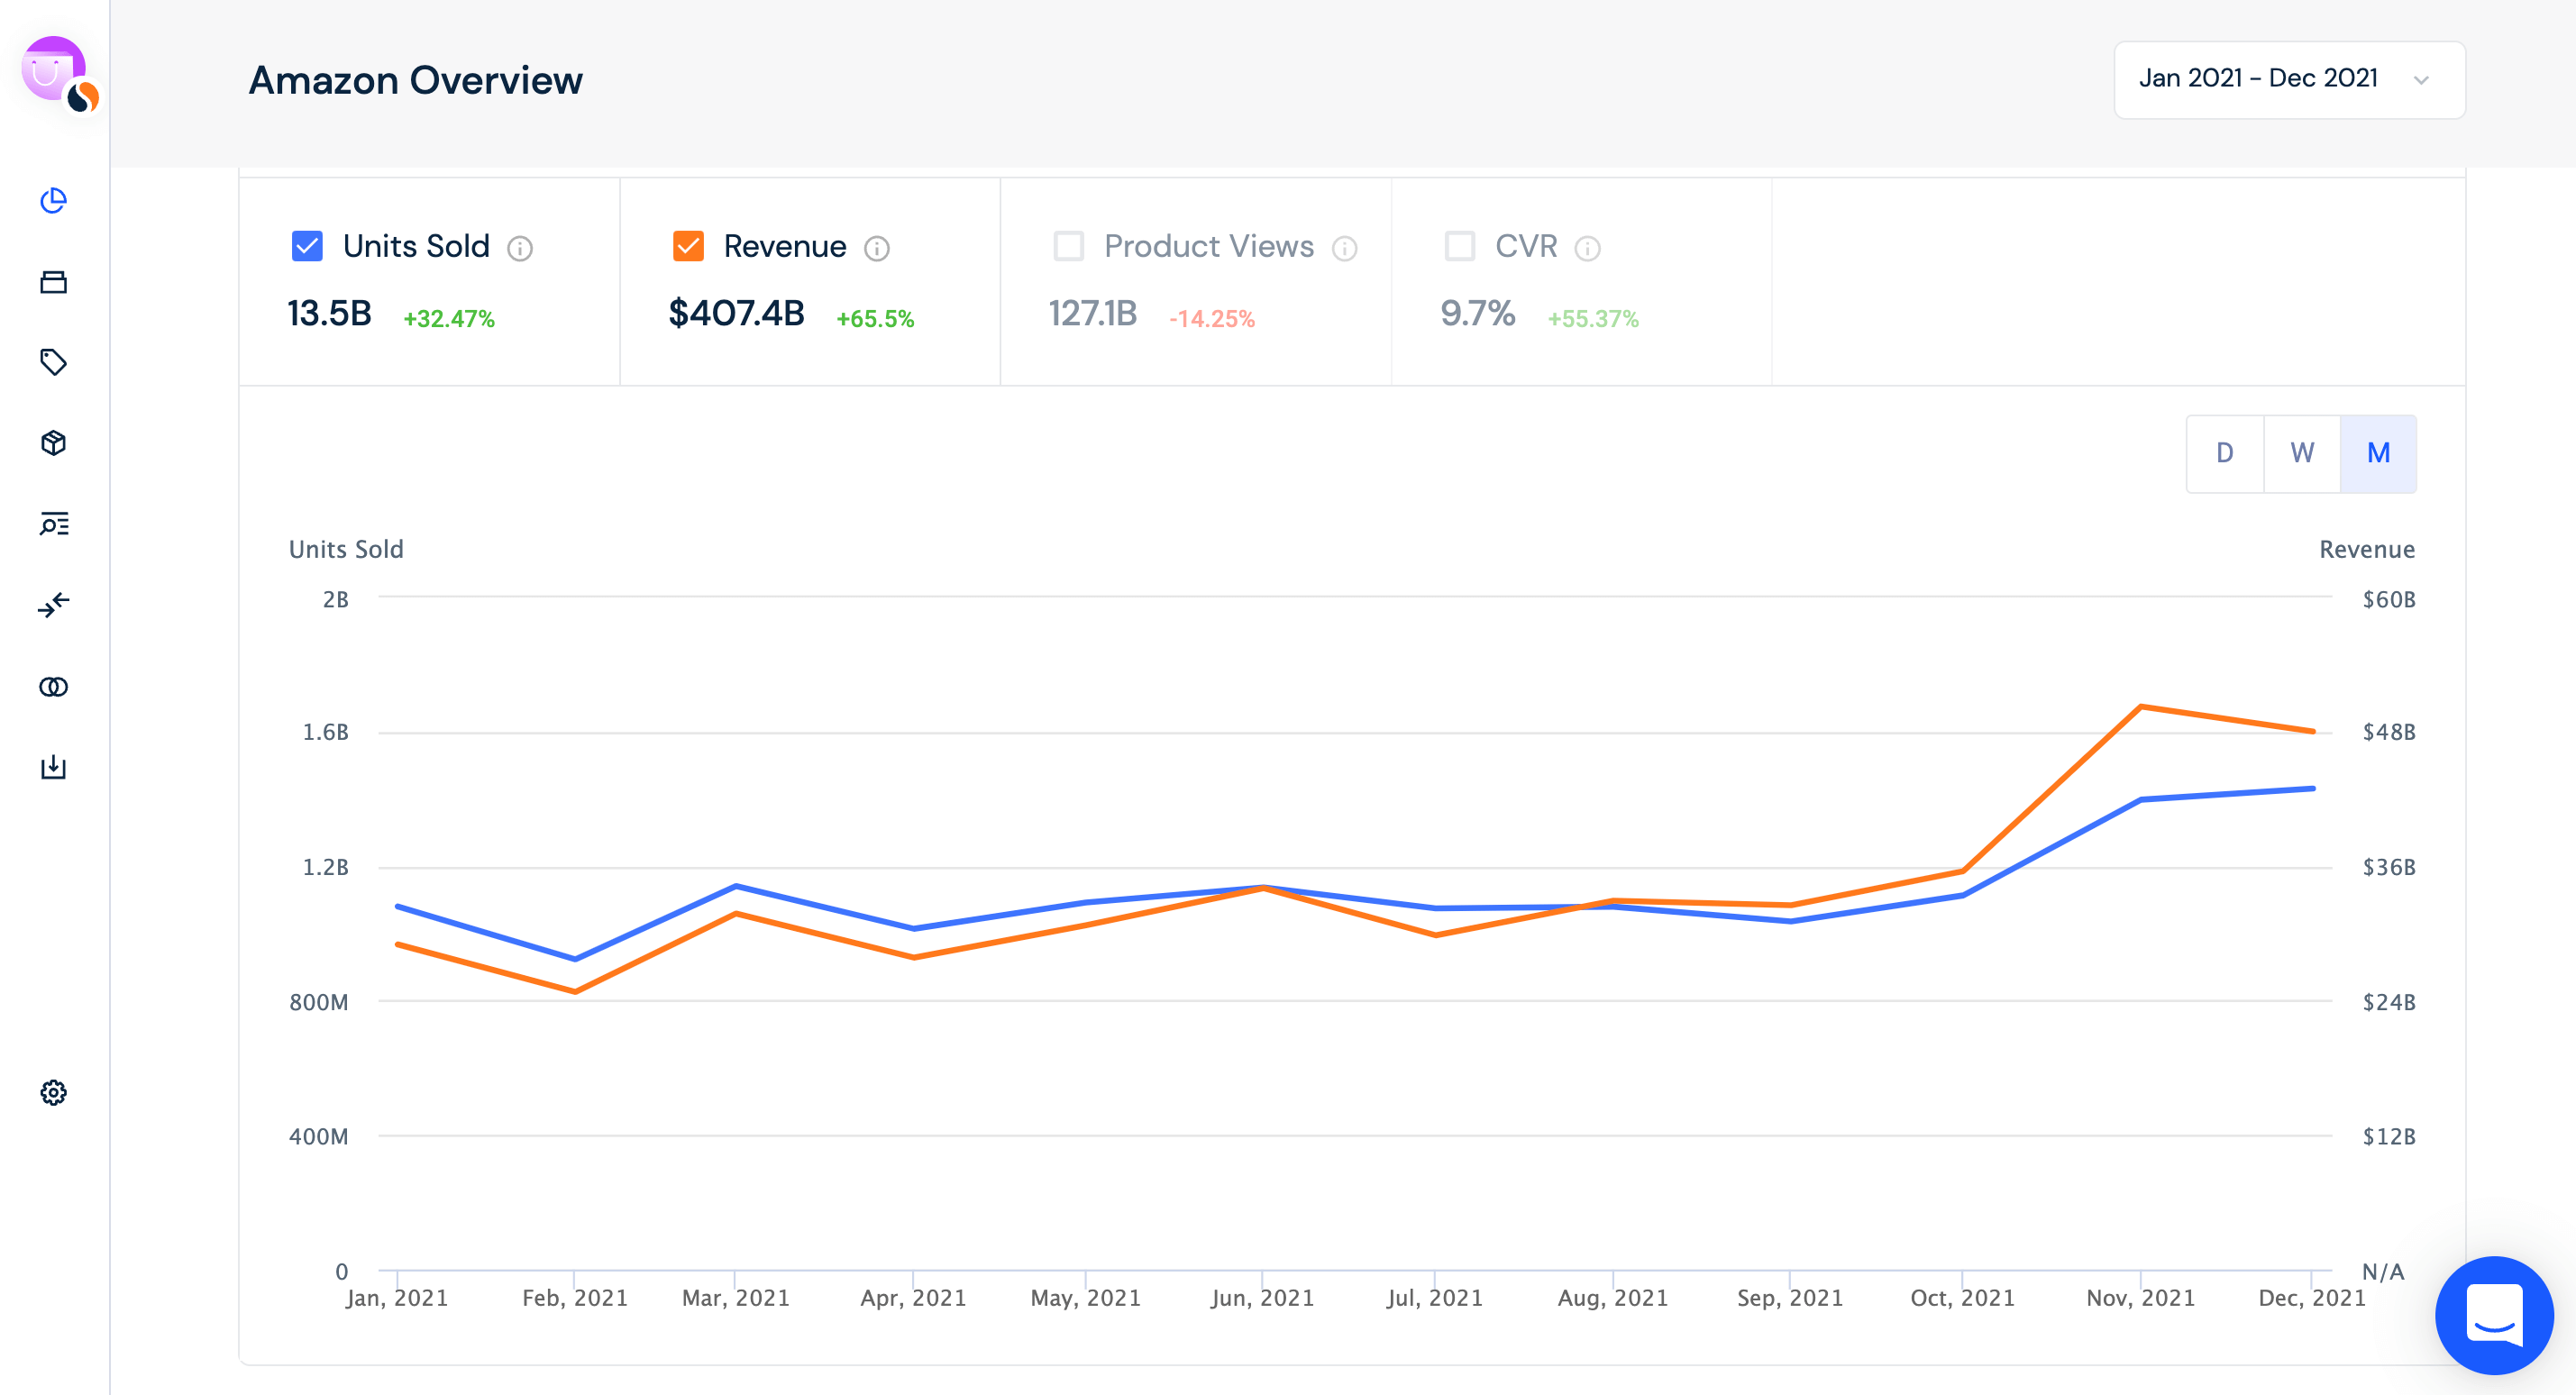
Throughout 2021:
- Amazon sold 13.5 billion units
- This totaled $407.4 billion in revenue
- There were 127.1 billion product views
- Amazon’s conversion rate was 9.7%
Amazon’s sales stats so far in 2022
Between January-May 2022, Amazon has:
- Sold 5.5 billion units
- Which totaled $180.4 billion in revenue
- And 49.6 billion product views
- With a conversion rate of 10.2%
In comparison to the same time period in 2021, Amazon has sold 200M more units and generated $30.2B more in revenue. However, there were fewer product views overall between January-May 2022 compared to the year before, suggesting that users come to the website knowing what they want and don’t need to browse or that they are willing to pay more for products that may have previously cost less.
Amazon category statistics: winners in revenue and units sold
Amazon offers its shoppers a variety of categories to choose from, making it a true one-stop shop for all eCommerce needs. Let’s dive into Amazon stats of top categories ranked by revenue.
Home & Kitchen is the highest-earning category on Amazon so far in 2022, with $28.1B in revenue, followed by Electronics ($18.7B) and Clothing, Shoes, and Jewelry ($17.1B). This makes sense given the higher price point of most products in these categories.
However, when we look at the same categories’ performance in terms of units sold, despite placing 9th on the list of revenue, Grocery & Gourmet Food nails the number one spot, with 742.6 million units sold between January-May 2022.
Clothing, Shoes, & Jewelry, and Home & Kitchen are the most searched categories on Amazon with 8.3 billion and 7.0 billion product views respectively.
To sum up:
- Home & Kitchen is the highest-earning category on Amazon with $28.1 billion so far in 2022
- Grocery & Gourmet lead in units sold with 742.6 million.
- Clothing, Shoes & Jewelry has the most product views, at 6.3 billion.
Amazon Prime statistics
Amazon Prime Day has become a summer staple for the marketplace, offering sales and discounts that drive traffic to the site and boost shopping during what’s normally a slower period for eCommerce sites. There are over 200 million Amazon Prime subscribers globally.
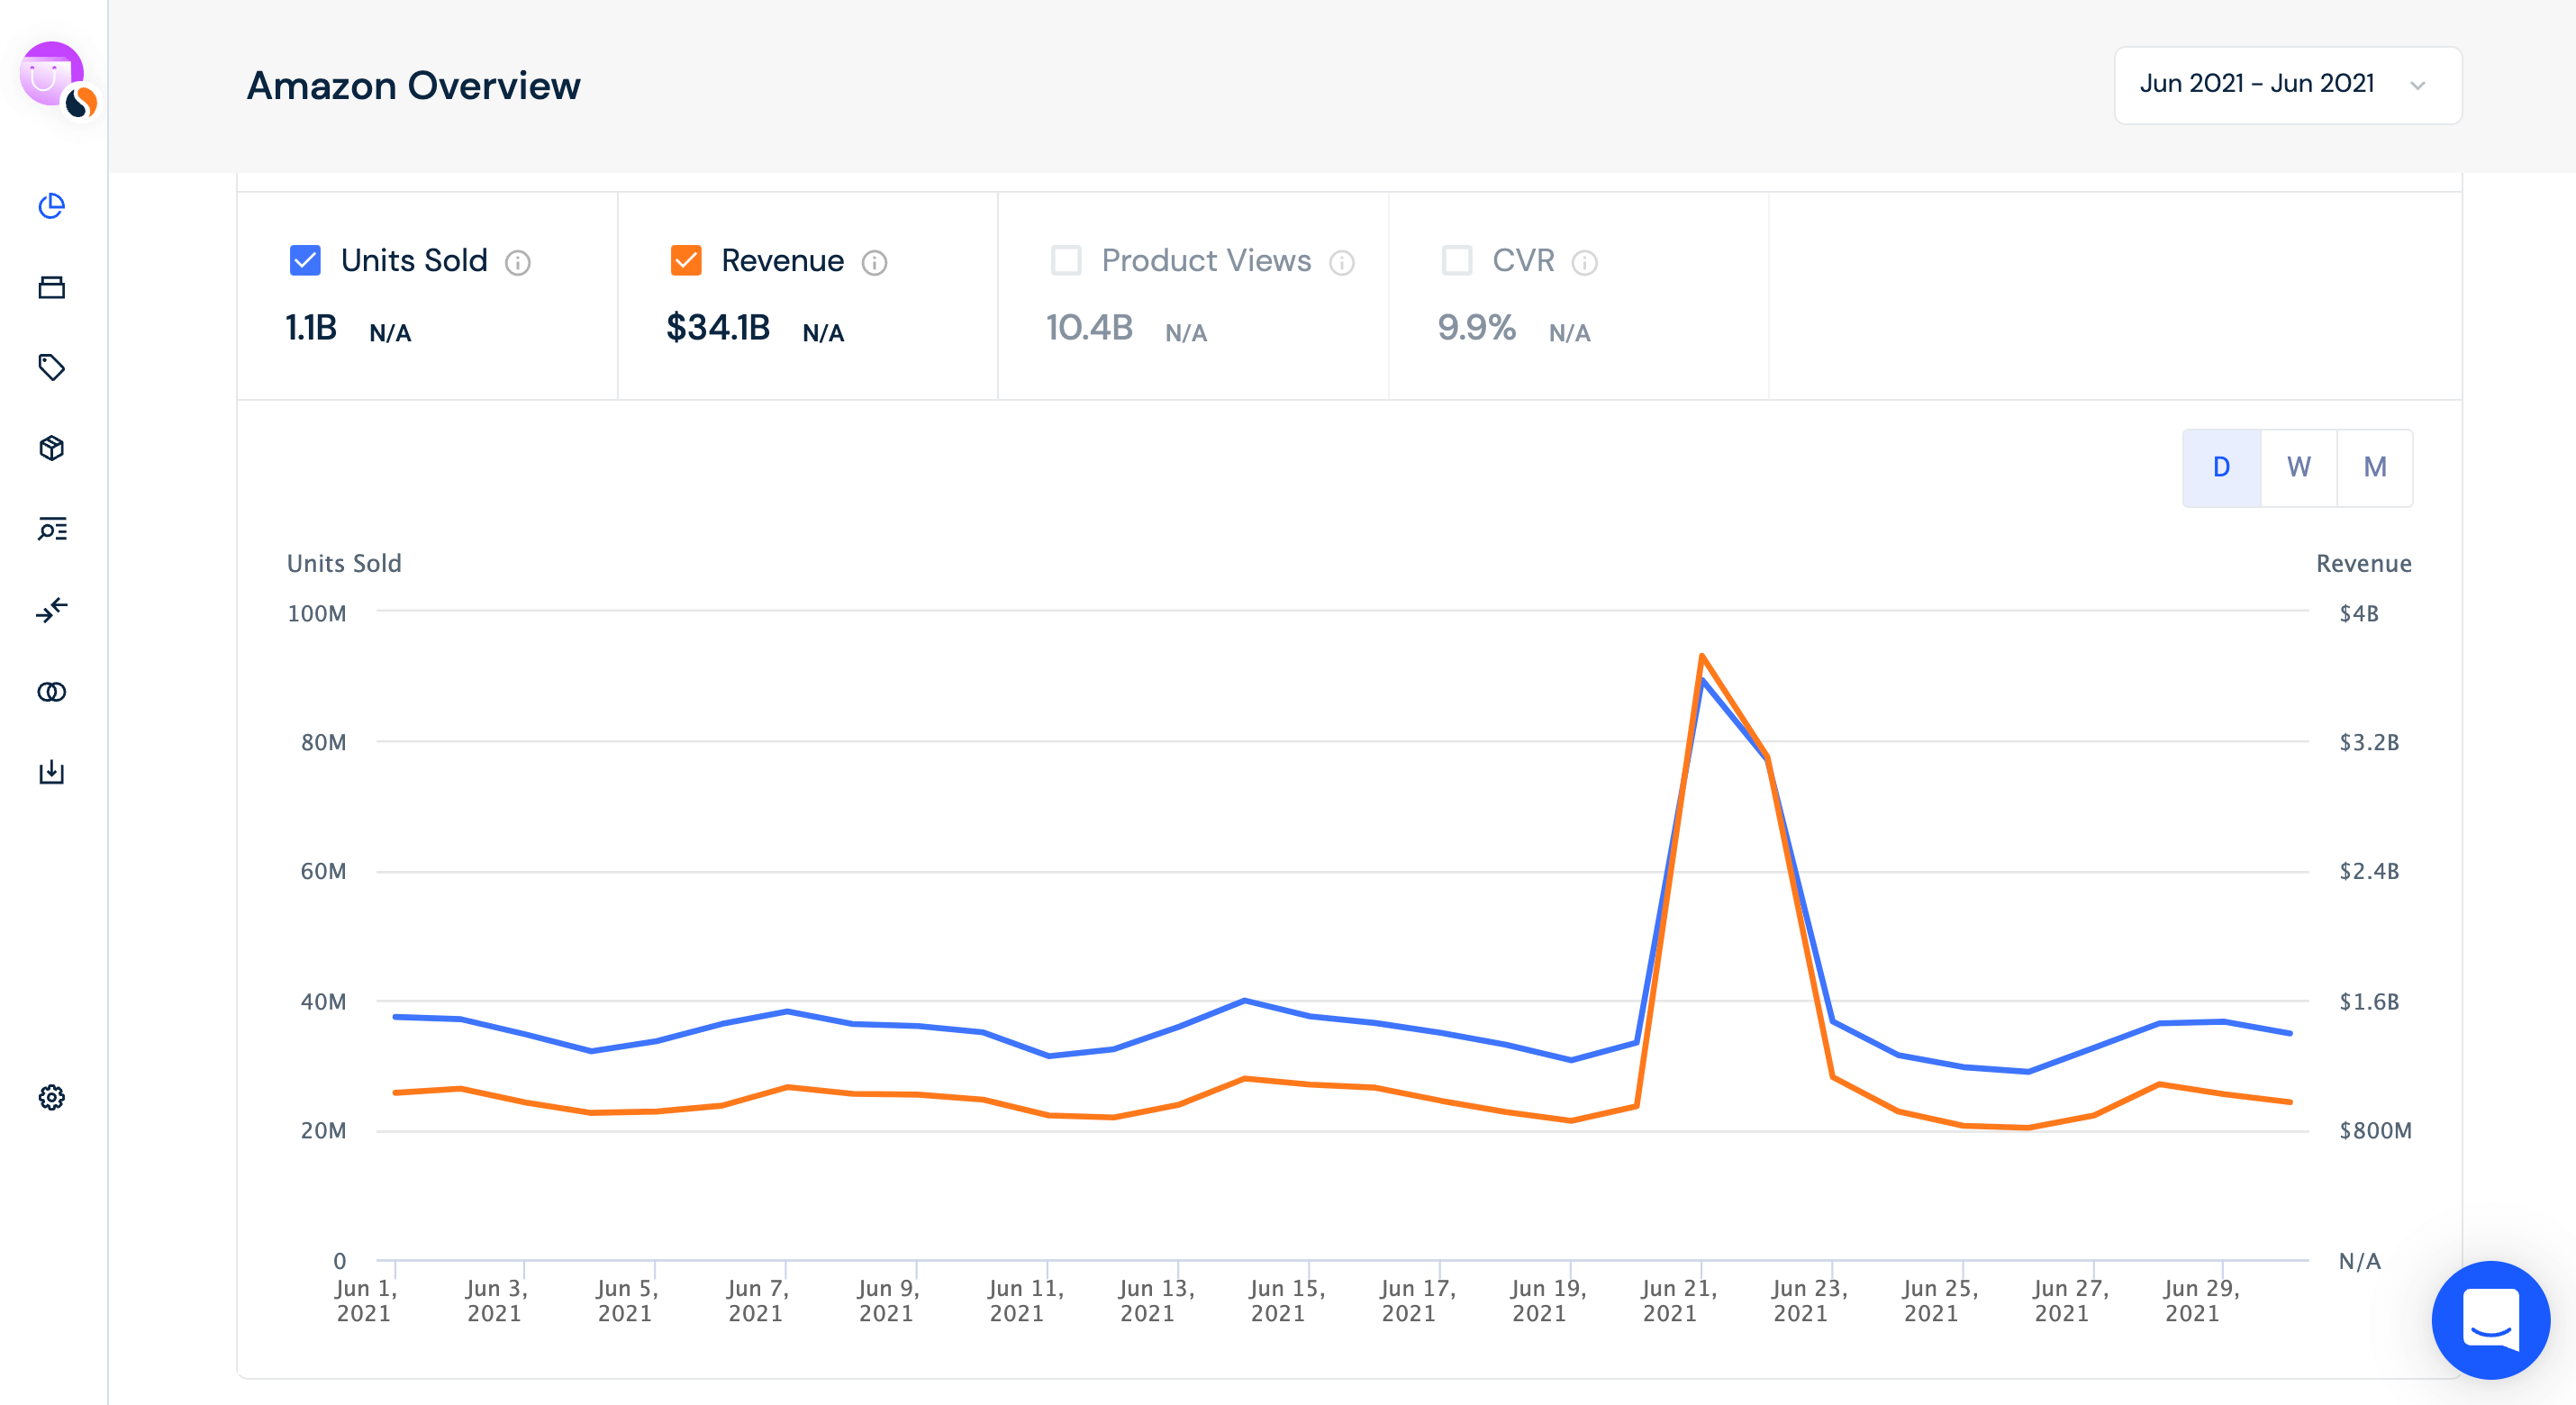
Last year, Amazon sales dramatically increased on Amazon Prime Day (June 21-22, 2021).
- On June 21 Amazon units sold rose 167% from 33.5 million to 89.4 million.
- Revenue increased by 291% compared to the day before from $946.6 million to $3.7 billion.
- Product views on June 21 and June 22 were 792.6 million and 642 million respectively, also significant jumps from the days leading up to Prime Day.
- Day 2 saw slightly lower numbers but was still high compared to the rest of June with 77.1 million units sold and $3.1 billion in revenue.
- Following the annual event, sales dropped back down to 36.7 million and $1.1 billion in revenue.
Amazon users statistics
Who’s frequently shopping on Amazon? Let’s break down some of the key audience demographic stats you should know:
- On average, 60% of the visitors to amazon.com are female and 40% are male
- Millennials (25-34-year-olds) are the most likely to shop on Amazon, making up approximately 25% of the traffic share, followed by 35-44-year-olds.
- Some categories, like Electronics, skew more toward males; while Clothing, Shoes, jewelry, Beauty & Personal Care are more frequented by females.
- 70.2% of visitors to Amazon have a college degree or higher
- 39.5% have an annual household income of over $100,000, 29.9% earn between $50,000 and $100,000 a year, and 30.6% earn under $50,000
- 81% of Amazon’s audience is employed full-time; only 3.4% are not actively working
- The average household size of Amazon shoppers is 2, followed by single-person homes.
Amazon mobile app statistics
Mobile has become an integral part of the consumer lifecycle, with most shoppers now expecting a seamless app experience. Amazon’s dominance in the eCommerce space is also present across mobile devices.
Amazon Android app statistics (U.S., May 2021-April 2022)
- Amazon app ranks #3 in the Google Play shopping category in the U.S., following the Shein app and Alibaba
- Amazon iOS app ranks #2 in the Apple Store’s shopping category in the U.S., following Shein for iOS.
- 57.2% of Android devices in the U.S. have the Amazon app installed (install penetration)
- The app was downloaded 46.5 million times in the last year
- There were 19.5 million unique installs
- Amazon has an average of 52.4 million monthly active users and 17.7 million daily active users
- An active Android user opens the app an average of 3.2 times a month
- Per month, the average session lasts 3 minutes and 22 seconds
- Per month, the total session time is 10 minutes and 50 seconds
Get more Amazon insights
We’ve covered a plethora of Amazon statistics and facts, but there are always more insights to uncover. Check out even more eCommerce stats or keep an eye on the eCommerce trends we expect to win big throughout the rest of the year.
To learn more about using Similarweb to benchmark your performance online, monitor your competitors, and track marketplace performance, schedule a demo of Research Intelligence and Shopper Intelligence today.
The ultimate edge in retail insight
Put the full picture at your fingertips to drive product views and sales


