4 New Features to Give the Complete View of Your Competitors

To stay ahead of the game, you need to know about industry trends, market changes, and competitor activity. Similarweb’s latest features unlock valuable insights that expand your scope of vision of your digital landscape. These new tools and metrics offer greater granularity and make finding vital competitor insights much simpler.
Here’s what you need to know.
Complete the view of your market with mobile app intelligence
In 2021, on average, 435K apps were downloaded every minute.
Crazy, isn’t it?
Mobile app usage is reaching a tipping point, which is impacting the entire digital landscape. Today, businesses that want to understand how their market operates need the complete picture. They need visibility into desktop, mobile web, and mobile apps’ performance.
This is why we’ve launched App Intelligence Premium – to provide you with the best quality web insights, plus mobile app coverage in up to 60 countries – all from your Digital Research platform. Now you can get a better view of how your consumers spend time and money and how your competitors are performing in the mobile app arena – alongside desktop and mobile web insights.
Here’s what you can do:
- Benchmark your app performance against competitors across key usage metrics.
- Spot trending apps, growing genres, and identify underserved markets.
- Analyze an app’s ranking over time and across markets.
- Get a dedicated suite of critical app usage and engagement metrics, spanning 60 countries, with solid coverage across both Android and iOS.
Let’s see it in action
The travel and tourism industry is a highly competitive space, that sees consumers using a combination of both desktop and mobile apps to research their next destination and book trips
Having a unified view of the competitive landscape is crucial for key players to master their digital strategy and anticipate market recovery.
Below, you can see the high fliers in the United States. While TripAdvisor has the biggest total audience, Airbnb is crushing it when it comes to engagement on the site with more visits, page views, and visit duration.
If the other players want to get their users poolside, they’re going to need to find ways to keep them on their own site for longer.
When you use App Intelligence Premium to compare the players, you quickly see that market disruptor Airbnb is the clear iOS winner, with nearly three times the monthly active users as TripAdvisor’s app.
There’s a similar story when we benchmark on Android, too. Here, Tripadvisor is stronger, but Airbnb is still far and away from the leader for monthly active users and has the best app engagement.
Get actionable insight into the competition with the revamped Competitive Tracker
To make your competitive monitoring more impactful, we’ve made some big enhancements to Competitive Trackers. Now located at the top of the platform’s sidebar with a host of new metrics, you can quickly get insights about competitor market share, traffic, top keywords, and more.
Get ready-to-use insights and automated alerts to help keep you informed of shifts across critical metrics, so you can make the right decisions for your business.
Use the Competitive Tracker to quickly answer questions like:
- How is a website of interest performing against its direct competition?
- Which competitor is gaining market share?
- Which topics and keywords are competitors gaining traffic from?
The publishing and media industry is under intense pressure to hit high audience engagement metrics that convince advertisers to spend mammoth marketing budgets with leading media publications.
When you’re working to tight deadlines, having competitive insights across all players in your market and the channel mix helps content and sales teams make quick decisions on where to invest editorial resources, and learn about changes in fast-changing news cycles before their competitors do.
Discover market leaders and rising players at a glance
Your market is unpredictable – companies rise and fall, almost overnight. It’s tough tracking the fast-growing players that are set to be disruptors, or ripe for acquisition.
So we’ve enhanced the Industry Leaders page with new ways to help you easily spot your market’s leaders and rising players. Get a quick view of the titans and upstarts in any industry, along with metrics like quarterly/yearly change.
Here’s what you can do:
- Easily spot market disruptors or fast-growth players for acquisition
- Identify which players are getting traction so you can uncover their growth strategies
- Evaluate any potential threats to your business by recognizing trends ahead of time
Here we can see the U.K.’s Jewelry and Luxury products market and a snapshot of the industry leaders there. While top high street brands like Pandora, H Samuel, Goldsmiths and Accessorize all experienced a decline in unique visitors year-over-year, other rising players, such as Nihao Jewelry (up by 377%) and Swatch (286%), had fast growth based on yearly changes.
If we use Similarweb’s Video creatives feature to dig further into Swatch’s success, we can see the brand recently launched a new biometric watch (in partnership with Omega). With this product launch campaign likely contributing to the fast growth on the Rising Players leaderboard.
Uncover trends in Audience Interests over time
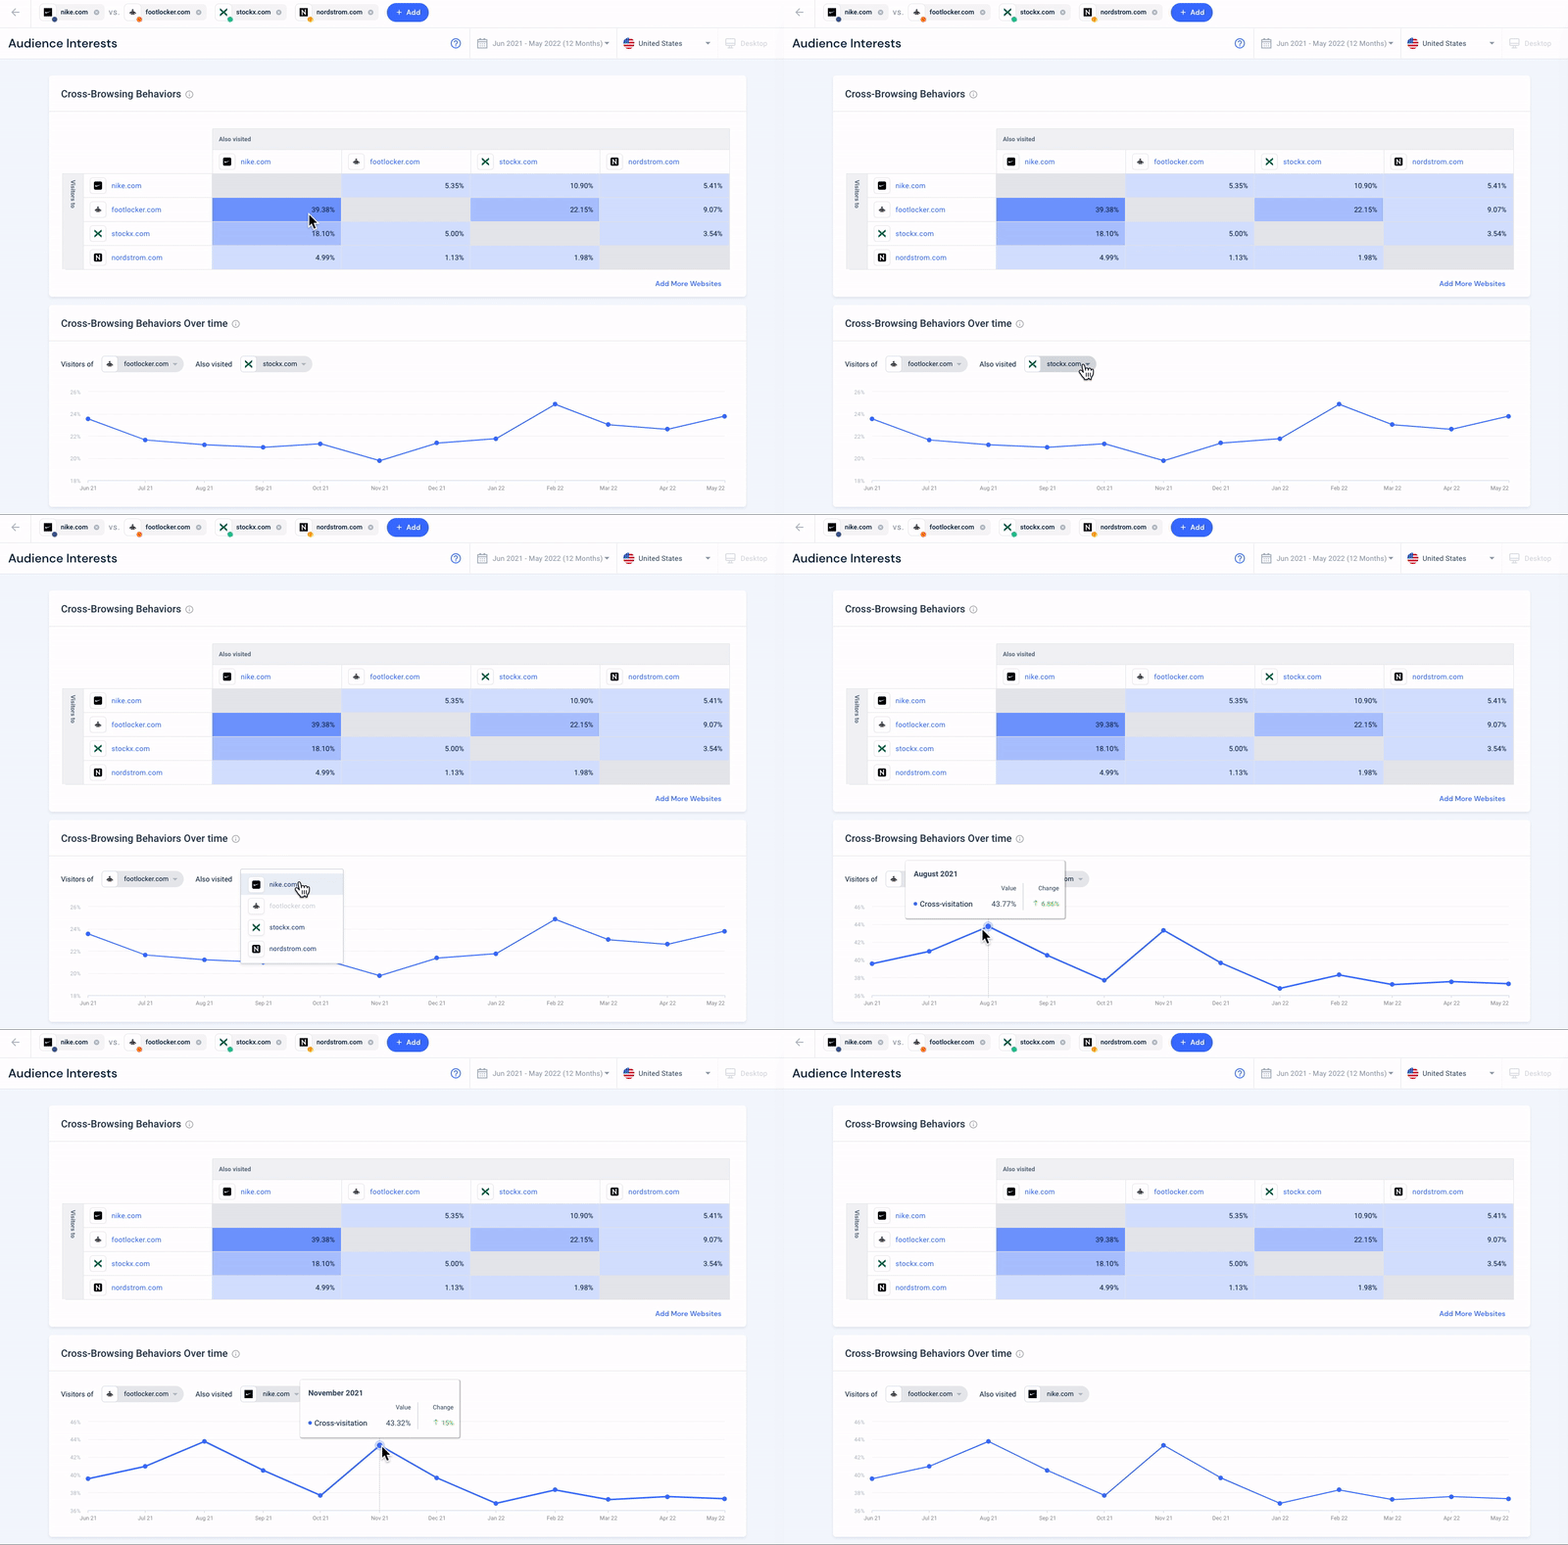
Sure, you already know our Audience Interests page helps you measure the cross-browsing habits of audiences that visit your site against a competitor’s. But with the page’s new additions, you can now see how this audience behavior trends over time. This helps you measure the impact of strategies you have implemented, and pinpoint peaks of cross-visitation on competitor sites.
For example, having these cross-shopping insights as a brand category manager means you can evaluate whether you’re gaining traction with key retail partners. Here we see Nike’s traffic compared to leading retailers Footlocker, Stock X and Nordstrom – all of whom sell Nike shoes.
During the last 12 months, 39% of Footlocker’s visitors also browsed Nike. On average, the PoP change was less than 2% versus last year.
When analyzing the trend over time in the chart below, cross-visitation peaked at 43% during August and November last year, then decreased during the first half of this year.
Ready to take it for a spin?
Check out our new features by logging into your Similarweb account or get in touch for a demo.
Have any feedback to share? We love hearing your ideas. Get in touch with the team to share or with your account manager.
Wondering what Similarweb can do for you?
Here are two ways you can get started with Similarweb today!


