This New Similarweb Feature Will Change Your Morning Routine
What are some of the things that are part of your morning routine? Having a cup of coffee, checking e-mail, catching up on the news? With Similarweb’s newest feature, Custom Dashboards, you can now add checking your competitors to that list.
Custom Dashboards is a new feature we launched last month that will save you valuable time and offer easy access to the competitive intelligence data that is most important to you.
With this feature, you can:
- Create separate dashboards with unique metrics
- Customize and organize your dashboards with simple drag-and-drop capability
- Easily reach Similarweb PRO to further investigate the data
Personally, I was very excited about the release of Custom Dashboards and I have started using it to quickly track digital trends of both apps and websites.
On April 7th, Reddit launched their first-ever official app and using Custom Dashboards I have been comparing the early install rate of 3 countries: the US, UK, and Australia. I also set my dashboard to include 2 popular Reddit apps BaconReader for Reddit and reddit is fun, and I use the last 28 days function to see if the Reddit official app passes them on installs.
As of April 16th, Australians have been quickest to download the official Reddit app, and in both Australia and the UK, it has passed BaconReader in terms of Android installs. In the US, however, the Reddit app is having a slower rate of adoption and has yet to pass either BaconReader or Reddit is fun.

Aside from just comparing one app to another, Custom Dashboards also lets you easily look at website and app analytics side-by-side, allowing you to view website traffic next to app Usage Rank.
Recently, we discovered that Line is the most popular app in Japan and using Custom Dashboards I have been tracking the app’s growing popularity in the US, by looking at both website visits and app ranking.

In addition to tracking new trends, you can can set Custom Dashboards to reflect past data, and then can be compare it alongside newer data. A few months ago, I published an extensive post on Virtual Reality and used Similarweb data to discover which VR headsets were most popular and to find out who were VR’s early adopters. One of the most popular early VR platforms was the Google Cardboard, which works in tandem with the Cardboard app. Based on the trends at the time, I predicted that 1% of all US Android devices would have the Cardboard app by April 2016.
I have been using Dashboards to track this trend closely and compare the last 12 months to the last 28 days. With less than two weeks before the end of the month, the Cardboard app data suggests that my 1% prediction is lagging a bit..

In the retail industry, knowing where you stand next to your competitors is critical. If you notice a big spike or drop in traffic, you can examine its traffic sources to figure out what caused the change. Recently, we noticed that Gap and Forever 21 were in a traffic deadlock, with nearly identical spikes and drops over the last 6 months. Although their traffic is close to being at parity, since February 2016, Forever 21 actually started to pass Gap.
If you want to track your competitors quickly and efficiently, making a dashboard like this one is the way to go.

In another example of using Custom Dashboards to quickly track trends, I decided to track the four major US presidential nominees’ US traffic to their websites. Using this tool, I can quickly identify spikes in a candidate’s’ traffic and correspond them to current events like debates, controversies, and campaign announcements.
As of mid-April, Bernie Sanders was by far in the lead in terms of web traffic, while Donald Trump and Hillary Clinton are jostling for second place. Meanwhile, over the last month, Ted Cruz has ranked 4th on all days except for April 1st where he saw a large spike in traffic. Using popular pages in the Pro, we can even see why this spike occurred on April Fool’s – and determine that it was the result of an epic prank Cruz played on Trump.

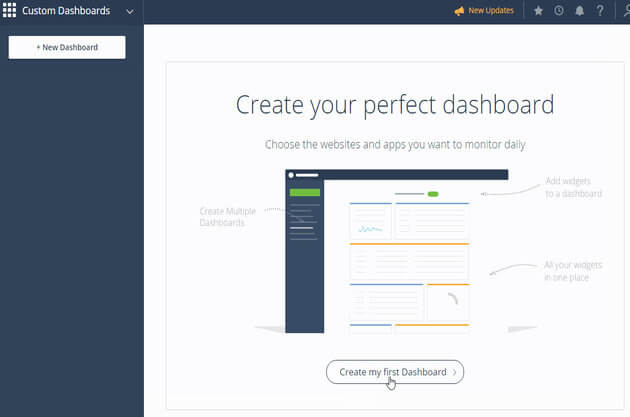
To get started and create your own dashboard, simply go to Similarweb Platform and click on “Custom Dashboards” on the left panel. Once there, click on “Create My First Dashboard,” and you’ll quickly discover how much easier it will make your morning routine. If you are not already a Pro subscriber, contact us here to learn more and try out a free demo.
Related Posts


Wondering what Similarweb can do for you?
Here are two ways you can get started with Similarweb today!