


Introducing Similarweb Google Looker Studio Connectors: Easy Access to Data at Scale

What do we want? Seamless data integration! When do we want it? Now! Look no further because Similarweb’s Data-as-a-Service (DaaS) is making it easier to blend, visualize, and analyze our data with two new connectors in Google Looker Studio:
Website Analysis: Access web traffic & engagement data for 100M+ domains across 190+ countries and 210 industries. Analyze any website’s total traffic, unique visits, bounce rate, and many more. You can also pull data by website segments to analyze a specific portion of a website and uncover the insights that are most relevant to you. This includes Marketing Channels data to better understand which traffic sources drive users to the segment.
Rank Tracker: Get real-time keyword ranking for all of your campaigns, including daily position data, historical data, visibility, share of voice, and ranking distribution.
Similarweb’s insights are an integral part of any digital analysis. When you blend our Digital Data with other important datasets, the bigger picture becomes clear and enables more informed business decisions and stronger strategies.
What is Google Looker Studio?
Having a Google account gives you free access to several tools. One is Google Looker Studio, a free, web-based tool that turns your data into informative and customizable dashboards and reports.
Being able to import and blend all of your data sources in one place allows you to build dashboards that help pinpoint trends, surface insights, and visualize the data with configurable charts and tables to help illustrate your company’s business goals, strategies, and wins.
Benefits of Similarweb Digital Data in the Google Looker Studio
If you already use Google Looker Studio, you can stop wasting time moving data around. Our connectors allow you to create instant insights at scale using your existing internal Looker Studio workflows and dashboards.
Adding Similarweb Digital Data gives you:
- Comprehensive data access: Leverage a wide range of Similarweb datasets
- Custom insights: Visualize data with customizable dashboards, charts, and graphs
- Real-time reporting: Keep your marketing reports up-to-date with automated data syncs
- No code required: Get data from multiple endpoints at once without a single line of code
Marketing reports will be unified and accurate, and the flexibility and customization will deliver custom data visualization and real-time updates that can be shared across teams and with clients. The Similarweb connectors are free for Similarweb customers with API access.
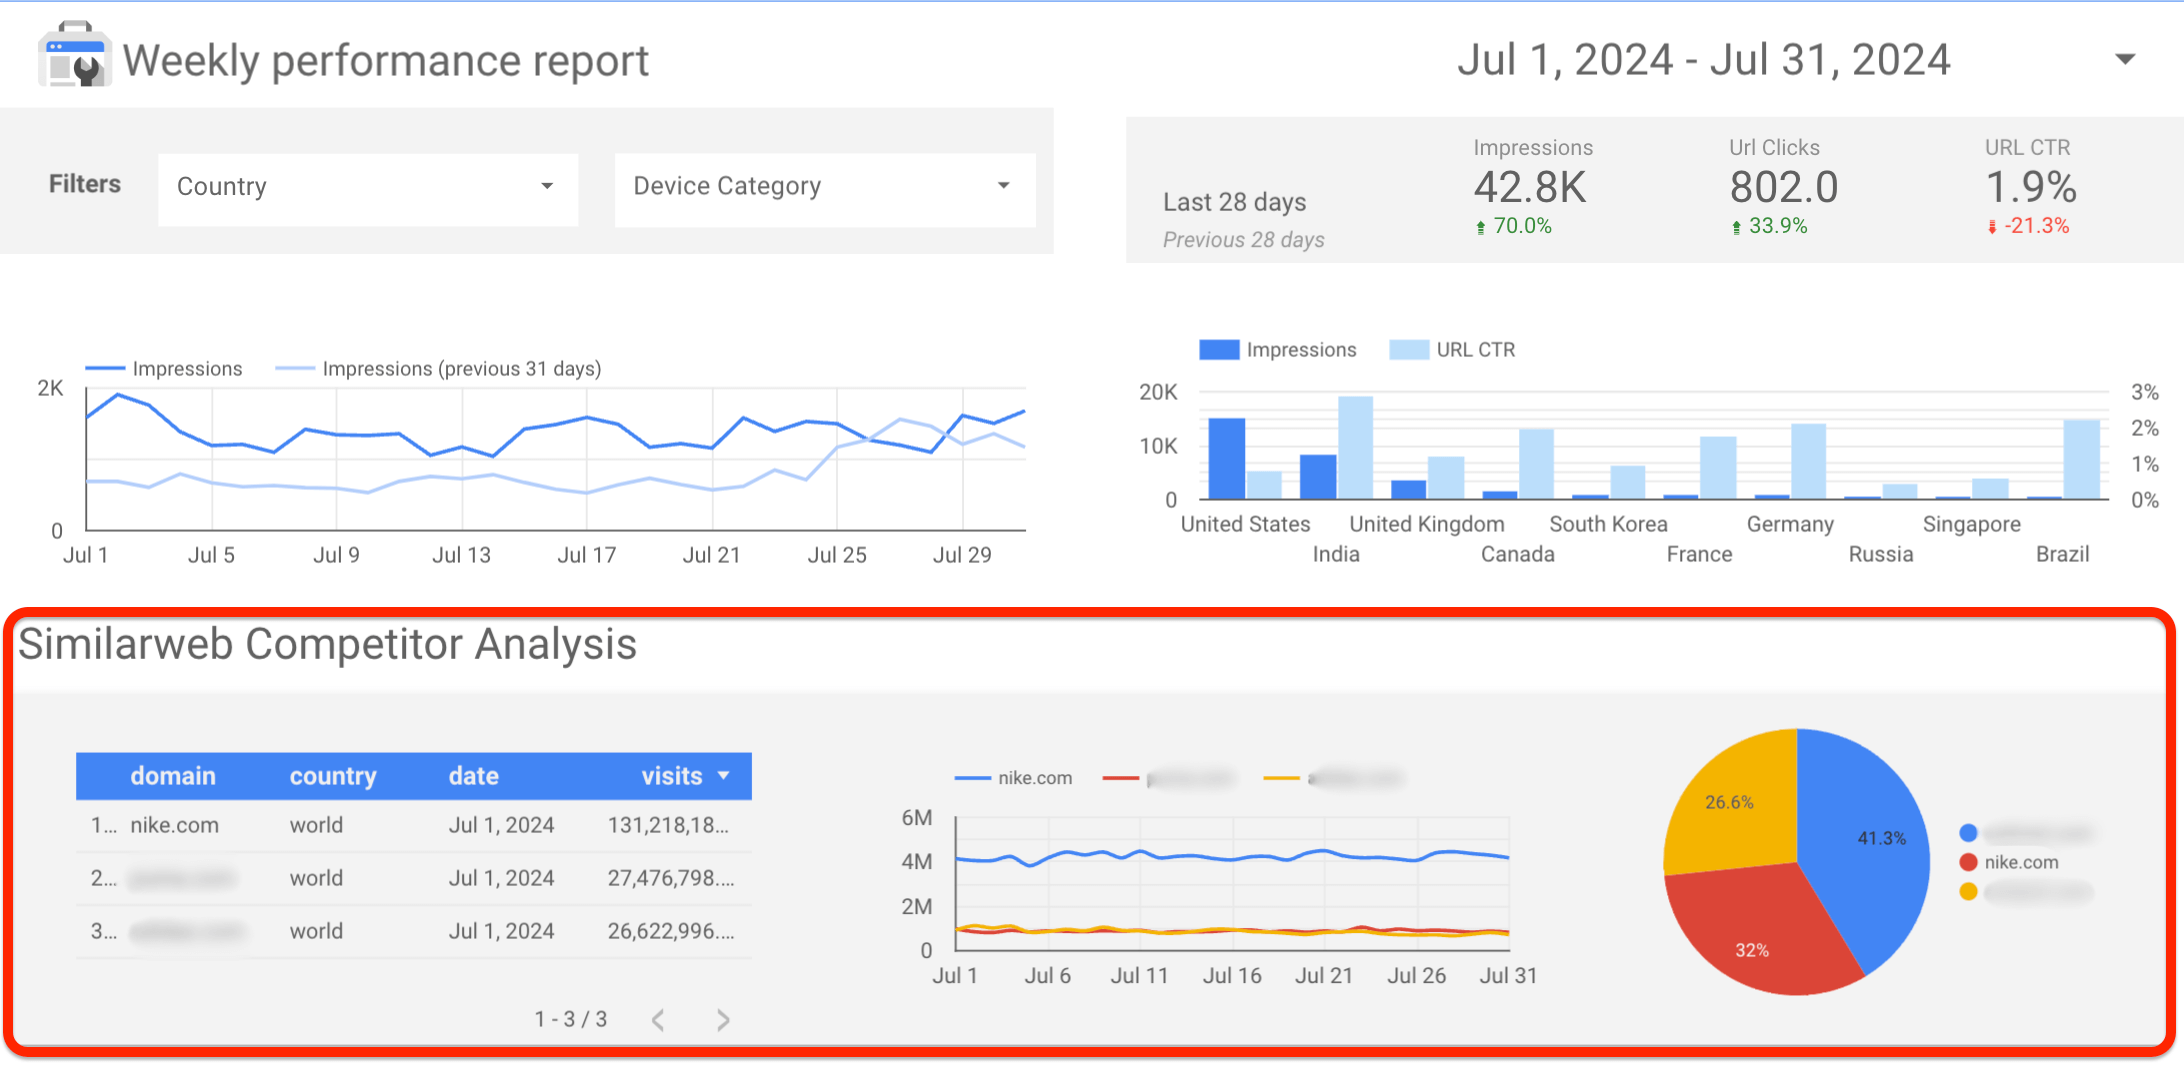
This flexibility allows you to create custom reports that combine traffic data, engagement metrics, and competitive analysis all in one place.
Let’s get started.
Adding Similarweb’s Google Looker Studio Connectors
If you have a Google account, you can access Looker Studio, making integration easy. It’s a simple process:
- Generate a REST API key from your account settings page on the Similarweb platform
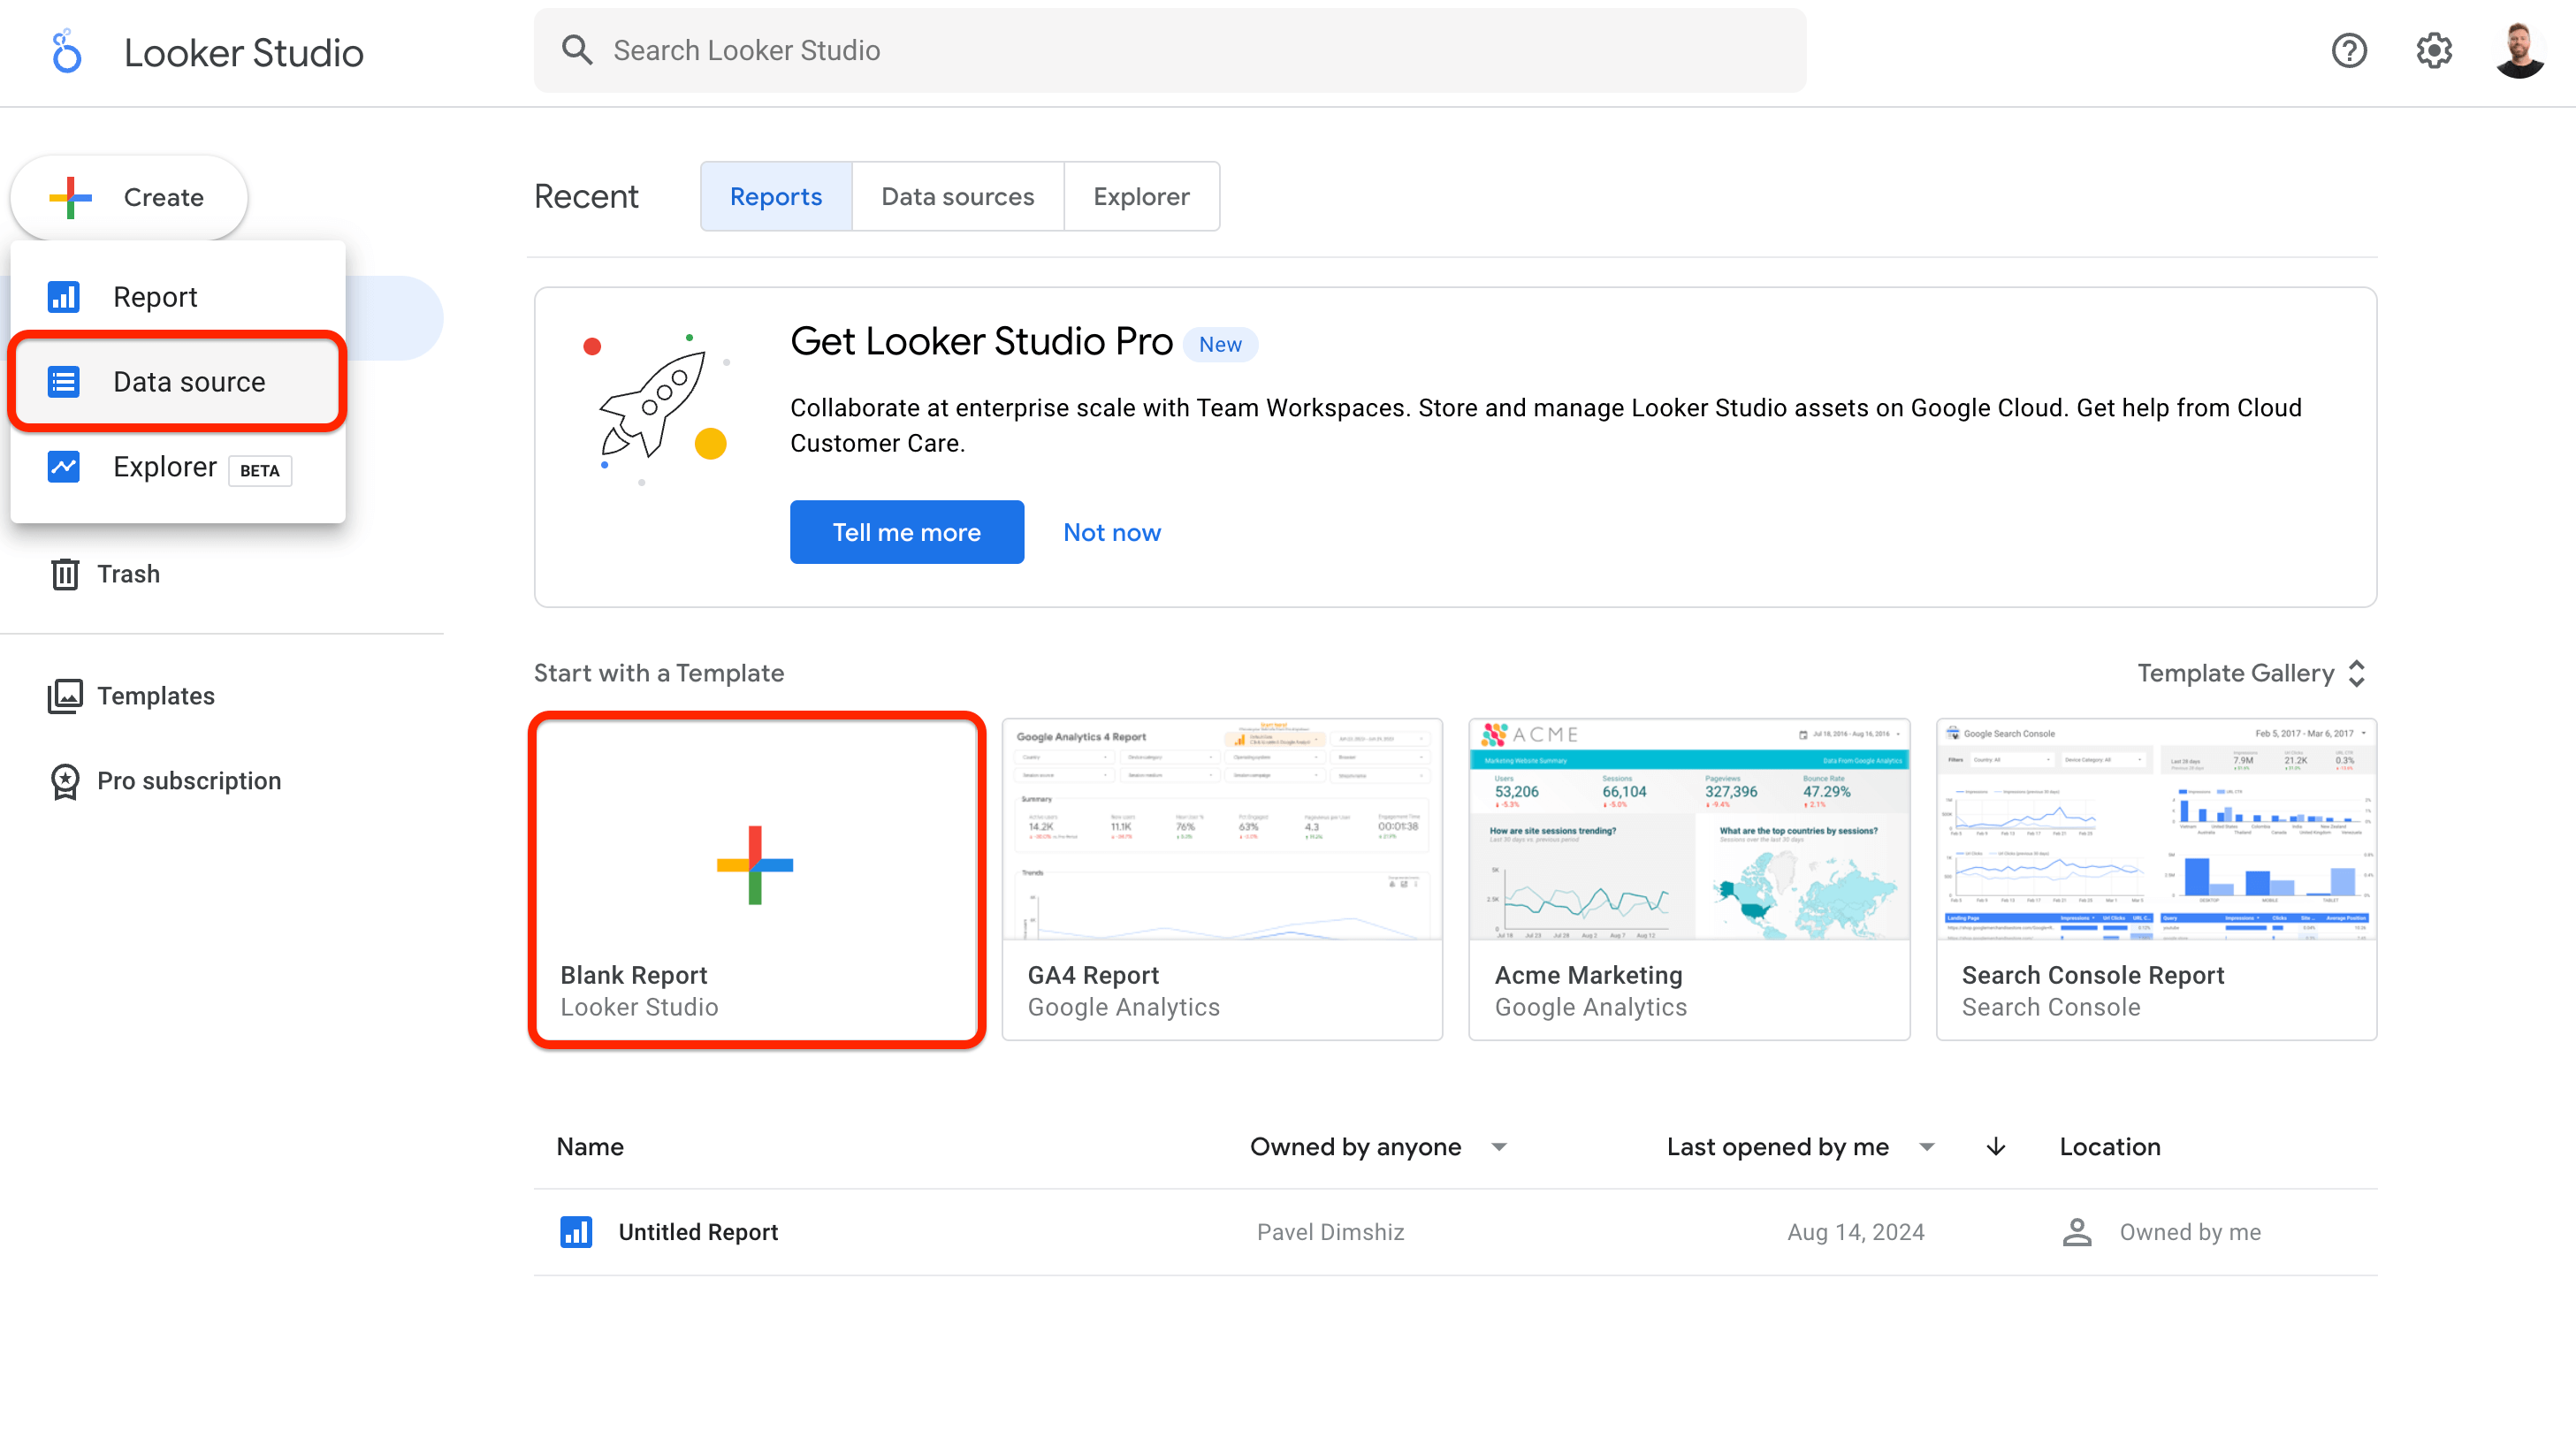
- Locate the Similarweb connectors in Google Looker Studio by either creating a new data source or starting a new report
- Select and paste your API key in the prompt to authorize access
- Select the data you are looking to share by configuring your report and choosing the relevant datasets
- Work with the data: The data is now imported and ready to use. The drag-and-drop editor will help design a dashboard and build a custom report.
How Similarweb’s data can work for you
Now that you have integrated Similarweb’s data into Google Looker, you can start transforming it into actionable insights. Here are the top five dashboards we see our clients using the connectors for, with recommended metrics for each of them:
1. Traffic & Engagement overview
- Purpose: See how visitors engage with your website, from traffic surges to engagement dips. It’s your window into what’s working and what’s not.
- The metrics:
- Total Visits (Desktop & Mobile): Know how many eyeballs are on you
- Pages Per Visit: Are users browsing or bouncing
- Average Visit Duration: See how long they’re sticking around
- Bounce Rate: Gauge how quickly they’re bouncing off
- Global and Country Rank: See where you stand in the world
- Why it’s essential: It’s like having a backstage pass to your competitors’ websites. Understand how visitors interact with their content compared to yours, and see how you stack up against industry trends so that you can make fast strategy adjustments to beat the competition.
2. Rank Tracking dashboard
- Purpose: You need to know where your keywords stand in the search rankings. This dashboard lets you track your target keyword performance.
- The metrics:
- Keyword Visibility Score: Your visibility percentage for tracked keywords
- Keyword Rankings by Position: Track the top 3, top 10, top 20, and even the top 100
- Competitor Keyword Rankings Comparison: See who’s creeping up on your turf
- Visibility Trends Over Time: Track your rise (or fall) in search rankings
- Why it’s essential: Imagine having a pulse on your keywords’ journey—know when you’re winning and where to fine-tune for that SEO gold. Plus, you’ll know exactly how you stack up against your rivals!
![]()
3. Marketing Channels performance dashboard
- Purpose: Discover the marketing channels that are your true MVPs so you know exactly where to double down.
- The metrics:
- Traffic by Channel: See the breakdown (Direct, Search, Social, Referral)
- Engagement by Channel: Know which channels are driving quality visits
- Channel-Specific Traffic Trends: Understand who’s gaining traction
- Why it’s essential: Picture this—knowing which marketing channels are pouring gold into your website! This dashboard helps you refine strategies to boost what’s working and cut out what’s not.
4. Competitor benchmarking dashboard
- Purpose: Gain a deep understanding of your biggest competitors by benchmarking yourself and identifying areas to outshine them.
- The metrics:
- Visits & Engagement: See how you measure up against your industry and your competitors
- Competitor Rankings & Visibility: Keep an eye on their search game
- Share of Total Traffic: Find out how much of the market pie you’re taking
- Why it’s essential: This dashboard is your secret sauce to outperform competitors and dominate your industry. Get insights on their weaknesses and capitalize on your strengths.
5. Geographic traffic distribution dashboard
- Purpose: Know your audience. See which countries are driving traffic to your site and how they’re engaging.
- The metrics:
- Visits by country: Understand your global reach
- Engagement metrics by country: See which regions love you the most
- Traffic share by region: Target your marketing where it counts
- Why it’s essential: This dashboard is like your marketing compass, pointing you to the regions where you should focus your energy. Discover untapped markets and adjust strategies based on actual user engagement.
Insights that power business decisions
Are you already using Google Looker Studio? Great. Are you already a Similarweb customer? Even better. Add the Similarweb connectors to pair your business’s traffic & engagement metrics with those of your competitors across relevant regions. Blend that with important first-party business data, such as revenue and advertising and marketing spends, to derive insights and ensure you have the most effective strategies in place.
FAQs
Do I have access to Google Looker Studio?
If you have a Google account/Gmail address, you can access Looker Studio.
What kind of Similarweb subscription do I need to access the connectors?
To enable the connector, you need REST API access. All of our packages support API. Access to the API is included in the Business package or higher. Clients with the Teams package can buy API access as an add-on. You can also purchase our Standalone API package.
What Similarweb datasets are available in the Google Looker Studio?
All Traffic & Engagement and Rank Tracker metrics are available with the two Similarweb Google Looker Studio Connectors.

Related Posts


Wondering what Similarweb can do for you?
Here are two ways you can get started with Similarweb today!