How to Run an Incredibly Effective Post-Mortem Analysis

“Those who cannot remember the past are condemned to repeat it.” – George Santayana.
The only thing worse than making mistakes, is making the same ones again and again.
We know. We’ve been there.
Integrating post-mortem analysis into the end of a project helps you learn from your failures and, most importantly, your successes.
In this post we’ll map out how you can use post-mortem analysis based on digital intelligence to learn from the past and get better results for your future projects.
Post-mortem analysis in business
In medicine, a post-mortem is conducted to determine the cause of death. In business, we don’t deal with such grave events. We want to identify the causes of whatever it was that happened and to understand why it happened so we’re better prepared for future projects.
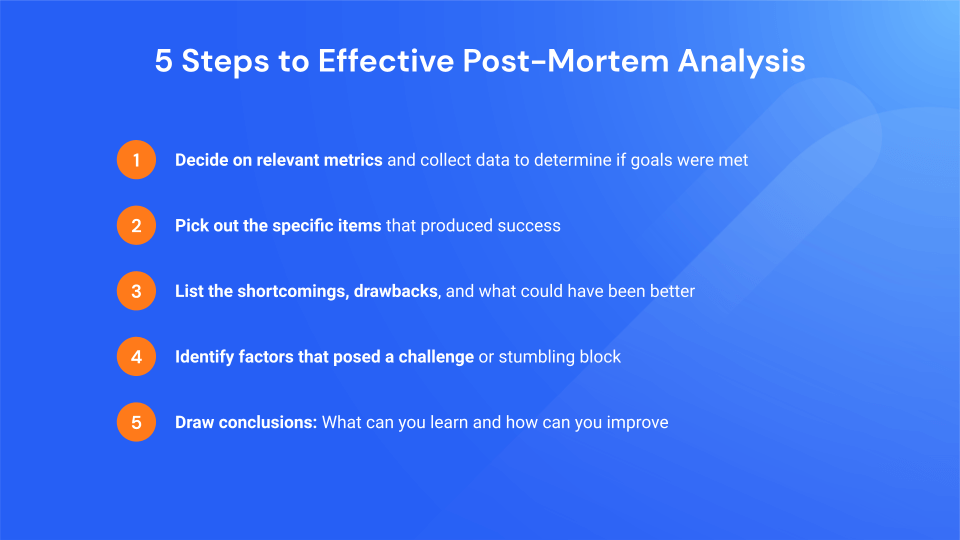
Successful post-mortem analysis in 5 steps
- Decide on relevant metrics and collect data at the end of a project to determine if goals were met. Based on your deliverables, you can answer post-mortem questions to pinpoint wins and losses.
- Pick out the specific items that produced success.
- List the shortcomings, drawbacks, and what could have been better.
- Identify factors that pose a challenge or stumbling blocks. You can use questionnaires to get feedback from different stakeholders and team members.
- Recap and draw conclusions: To wrap-up, compile your findings and draw key takeaways. For example, you might outline steps you took that streamlined the process, kept you agile, or improved your workflow. This way you can incorporate your wins into your next project.
The 5-whys-analysis
For the first four steps above, you should review data-based results. In order to do this, ask yourself why this outcome occurred. Your answer then becomes the starting point for your next question. We recommend doing this five times. The 5-whys-analysis can be critical to the post-mortem process in order to determine the root cause of any project failure.
For research, this means analyzing how your website or app performed before a specific event or project, how it functioned during, and any changes that may have occurred since, both for the good and the bad.
You can use this type of retrospective analysis following significant events, projects, and webinars in your area of reporting. It could be elections in politics, the Oscars ceremony in entertainment, international trade shows in economics, and any small or local event relevant to your audience. Your goal is always continuous improvement.
Timely post-mortem analysis example
Let’s look at a general example. You’re a project manager for a top publisher tracking the Olympics. You’ve created an interactive dashboard as part of your project plan showing how many medals each country earned. You discover that only 6.5% of your traffic to these pages comes from social media, which is significantly less than other news sites reporting on the sports results. You expected more so you start asking.

- Why do you have less traffic? Because you posted less frequently on your Twitter account than your competitors.
- Why? Your social media manager didn’t prepare tweets in advance and relied on real-time updates.
- Why? You didn’t consider Twitter as an effective marketing channel, and your priorities were placed elsewhere.
- Why? Your data analyst did not identify the market trend of increasing traffic from social media networks to news apps.
- Why? You’re not using advanced research intelligence software.
See how this can get you to the bottom of any issue? Do some research and find the best analytics software to support teamwork and your overall needs.
Conducting a post-mortem analysis as a publisher
One day after Simone Biles dropped out of the competition, every news and media site ran its own story or opinion piece. But it was clear the drama had only begun.
Events like this are a feast for publishers and media outlets, and a story’s success often depends on your audience.
How do you know if your audience is supportive or angry? Do they want to see footage of the athlete or read professional comments? Do they prefer to get the reactions of her teammates, her adversaries, or experts? You immediately do a post-mortem leveraging insights such as those from Similarweb’s digital suite for publishers.
Audience analysis meets post-mortem analysis
When you assess your website performance, analyzing demographics allows you to segment your audience and improve your targeting strategies. That’s a good start. But you’ll need to understand a lot more about your target audience.
You analyze the audience behavior to understand who accessed your coverage of the event and what other sites they engaged with the most.
Audience analysis helps you to target your audience more effectively. It’s to really understand your audience. For this example, the story isn’t only sensational, it’s also sensitive. Posting the wrong piece in the wrong place at the wrong time can hurt your brand in the eyes of readers.
Consider the 5-whys analysis. It can help you answer the questions more precisely, especially if you add engagement metric benchmarks into the mix. These will reveal how many visitors you had from social, which posts were most popular and drew the most traffic, how much time visitors spent on your website or app, and how many pages they viewed on average.
Pro-Tip: Compare your performance to other sites in your category to see if there are similar trends. Were your numbers high or low in comparison? Without these insights, the post-mortem in our example would have gotten stuck after the first question. Similarweb’s analytics to see your performance in context.
Engagement metrics to hit
Now that we’ve established what to look at, we can move on to the how.
The following metrics give valuable insights into the quality of your content and your traffic. Based on this data, you can find answers to why the outcome was good or bad and move on to the next why.

1. Bounce rate
Monitoring your website’s bounce rate helps detect how well your content met visitors’ expectations. Understand if the traffic-driving channels had a clear message matching the content of the page they lead to. Note that bounce rates in the news sector are generally high; the U.S.’s average is ~50%.
2. Average visit duration
Similarweb’s analytics software measures the time visitors spend on your site and compares it to the competition. Benchmark against the average visit duration in your category or against specific publishers. Choose a country or region to analyze and the period to calculate.
3. Session duration
Review session duration, then examine how many pages a visitor viewed during the session by checking the number of pages visited. Did they zap through headlines or read background articles thoroughly? If so, check the time spent on the page to find out which articles were more popular than others.
4. Daily active users (DAUs)
Readers consume news daily and are generally very loyal to their news source. During a significant event, you can expect daily unique visitors to increase over the average DAU. If not, you definitely need an in-depth post-mortem analysis and understand why.
5. Industry benchmarks
Our cross-industry benchmarking tools reveal how you are performing compared to others in your market. By mapping your market, you’ll get an idea of where you can improve, and in which areas you are leading.
6. Compare with similar events from the past
Keep the findings of your post-mortem on record. Compare outcome to other similar events. For example, if you’ve covered the Olympics in the past, you could use a new post-mortem to see where you improved this year. Similarweb can help you compare data from different periods – going back to anywhere from a month to two years.
The digital event post-mortem checklist
As a digital marketer, or publisher, consider these four factors when analyzing a story’s performance to make sure that your content strategy is performing as well as it can.

1. SEO
Set up your SEO strategy and goals beforehand. In your post-mortem analysis, you’ll first determine if you met your goals. Then analyze how well different content assets performed in terms of discoverability. Were you able to tap into maximum search intent? Perform competitive SEO analysis to compare your website to other sites in your industry and gauge your performance effectively.
2. Incoming/outgoing traffic
A large-scale event is a great opportunity to evaluate your affiliates’ performance and your affiliate traffic quality. Investigate which partners drove the most traffic, if there was a significant increase from specific affiliates, and so on. Having a clearly defined affiliate marketing strategy can be a powerful way to attract new visitors and generate more online revenue.
3. PPC
We don’t need to stress the importance of monitoring your PPC campaigns during the event and measuring your return on ad spend (RoAS).
In your post mortem analysis, you want to dig deeper. The idea is to understand what went well and what didn’t. Look at individual metrics and analyze what they tell you.
For example, if your click-through rate (CTR). was high, but the PPC conversion rate wasn’t, it means your ads were great, but the landing page was weak. You know where you need to improve.
4. Media buying
Again, you want to focus on your ROI. But you’re doing that anyway. In your post-mortem analysis, you will go into detail and ask why it was high or low.
You’ll want to identify weak spots and strong areas in your media buying plan. Find which type of media worked best and where your ads were most successful.
Effective ways to steal market share
Discovering the size of your market share is beneficial to any post-mortem analysis. Knowing how the market is divided among your competitors further clarifies the picture.
The advantage here is that you can hone in on the biggest fish in the pond and learn from them. Here are some digital intelligence tools that can help you get there:
Website Analysis – Top competitors must be doing something right. Analyze their websites to figure out what that is.
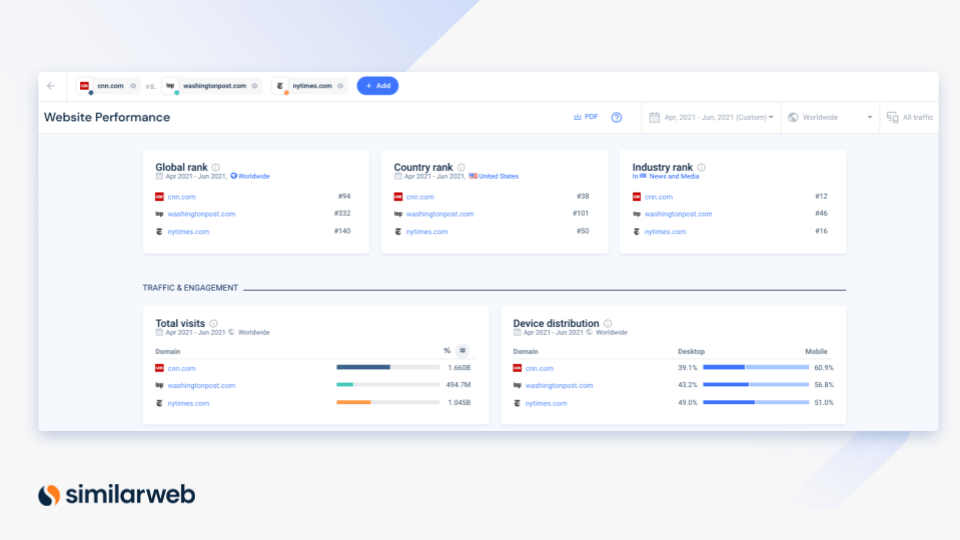
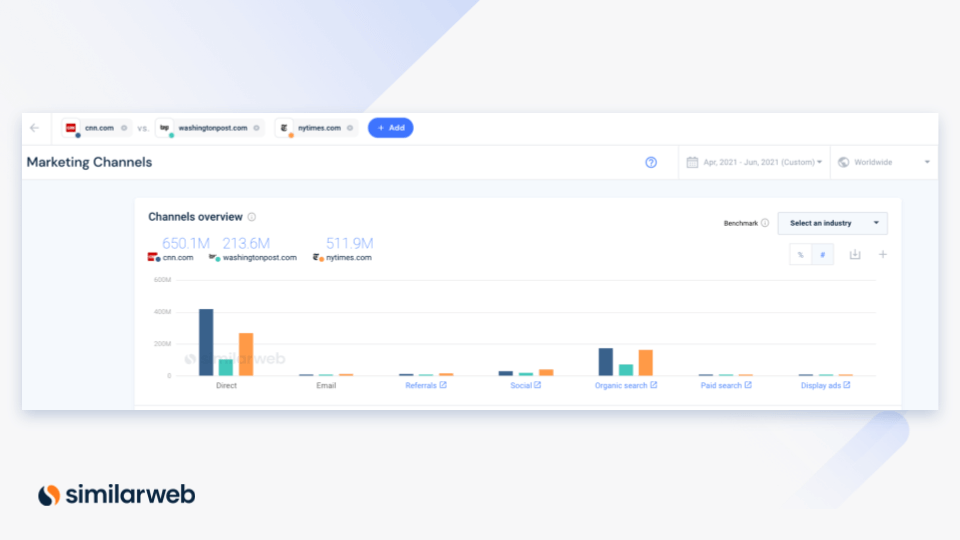
Traffic Sources – Identify the channels that are most effective in driving traffic to these sites. Compare your main marketing channels and determine if you are leveraging them sufficiently. For even more clarity, it’s crucial to get specific. You can look at the big picture and get an overall impression; however, it’s easy to overlook the details that could make a difference.
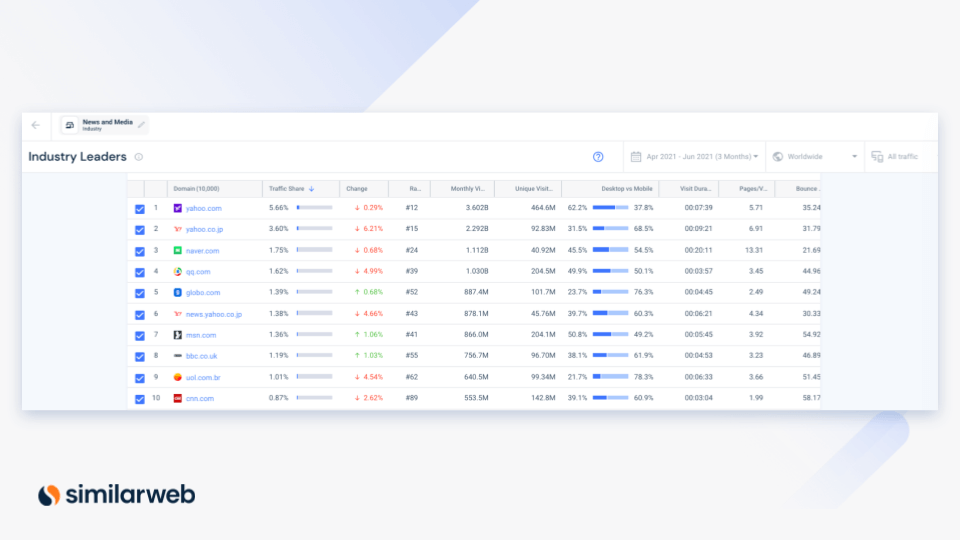
Web Industry Analysis – Compare apples-to-apples, not the entire fruit basket. Choose your industry and benchmark against the leaders or your closest opponents. Check out the device split between desktop and mobile web, average visit duration, monthly visits, and more.
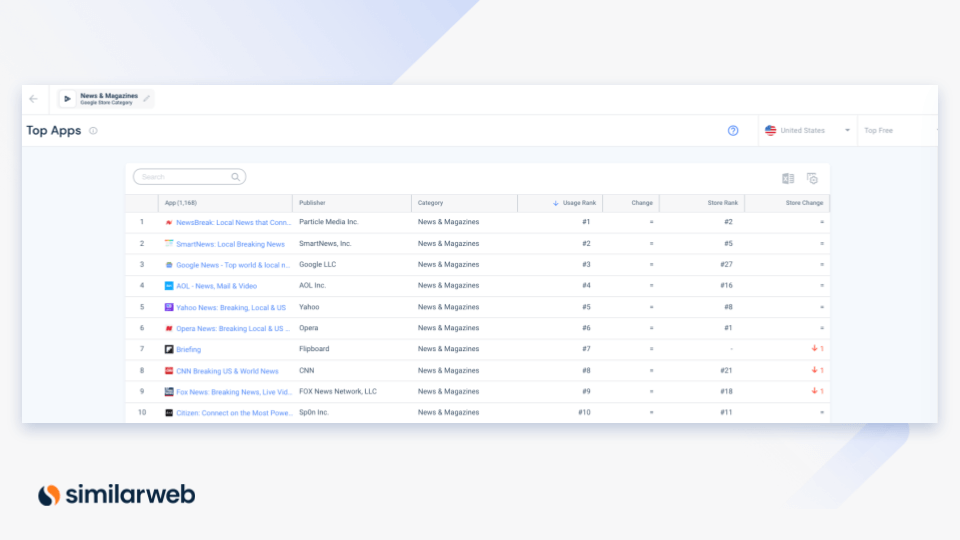
App Category Analysis – Make sure your app functions flawlessly and offers a great user experience. Learn about users’ preferences from how they interact with your app and those of other popular publishers.
Optimize your post-mortem analysis with Similarweb
Your analysis is only as accurate as the data it’s based on. In turn, without accurate analysis results, you can’t draw practical conclusions and set action items for improvement.
Try Similarweb for free and get the most accurate data for your post-mortem analysis of every event, incident, failure, or success. Don’t let them pass uninvestigated. These are the best opportunities to learn and refocus forward towards success – whether you’re riding a bike or running a business.
This blog was written in collaboration with Ruth M. Trucks.
FAQ
How do you conduct a post-mortem in marketing?
Determine relevant metrics, select successful items, note down shortcomings, identify challenges, and finally, review and make conclusions.
How can I grow by stealing market share?
Conduct website, web industry, and app category analysis and identify traffic sources of competitors.
What is a post-mortem analysis example?
If you discover that you’re receiving significantly less traffic from social media to your site than your competitors, ask yourself the five why’s to get to the bottom of the issue.
Track your digital metrics and grow market share
Contact us to set up a call with a market research specialist


