[Infographic] Online Gaming Ranked by Digital Market Share
![[Infographic] Online Gaming Ranked by Digital Market Share](https://www.similarweb.com/blog/wp-content/uploads/2021/11/Molly-SW-Blog-Cover-Image-Rebrand-1-4-768x455.png)
Think of the last time you played a game. In particular, one that you lost.
Now try to imagine what you could have done differently to win. Did you waste your power-ups too early on? Maybe you made a rash decision and gave your opponent an easy opening. Regardless of your answer, congratulations! You’ve just conducted a form of competitive analysis.
In the world of online gaming, knowing where you stand against your competitors is vital. For your business, it’s the difference between making strategic decisions and going for the hail-mary.
Who do you need to keep an eye on to earn that victory lap?
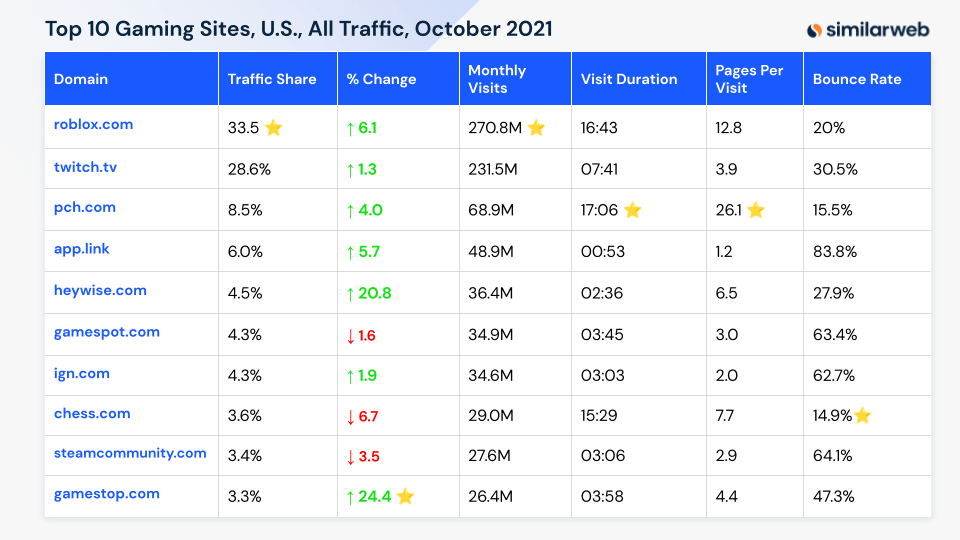
Using Similarweb Research Intelligence, we ranked the top 10 gaming websites by market share to give you all the stats you need to stay one step ahead of your competition. Check out our interactive infographic, including key performance indicators and metrics to track success specifically in the U.S. market.
For this analysis, we define market share as the percent of traffic being sent to a particular website via desktop and mobile web.
Online gaming market share and industry benchmarks
Highlights:
Online gaming for the win
- The online gaming industry is growing in the U.S. There were 4.2% more monthly visits to the top 10 websites in October 2021 compared to September 2021. That’s a total increase of 32.2 million visits.
- The top two gaming websites in this competitive set, roblox.com and twitch.tv, snag more than half (62.1%) of the total traffic share.
- Compared to the entire U.S. gaming industry, the market share for roblox.com is 8.1% and 6.9% for twitch.tv.
- Almost all of the top websites experienced an increase in market share in October 2021. This suggests that industry giants are stealing traffic away from smaller or more niche competitors.
Direct levels up
- Direct is the marketing channel to watch, earning 83.3% of the total traffic share for the top gaming websites, followed by organic (9.1%) and social (5.3%).
Your target market is…
- Device split is polarized for different websites. Some websites dominate the desktop arena (roblox.com, twitch.tv, chess.com), while others win by a landslide on mobile web ( app.link, heywise.com , ign.com ).
- Age distribution skews younger – gamers between the ages of 18-34 are responsible for 66% of visits to the top 10 gaming sites.
Digital gaming scorecard
Below, we’ve broken down key engagement stats and website metrics for the top 10 gaming websites. You can see that these sites have some of the highest engagement for any digital industry, with longer visit durations and more pages visited than average.
Bounce rates fluctuate based on the website. You either successfully grab a gamer’s attention, or you lose it fast.
Get in the game
This report focused on the top 10 gaming websites and communities in the U.S., but Similarweb Research intelligence can give you insight into any market you want to take your digital performance to the next level, no matter what.
See why the top companies worldwide use our data to discover industry trends, analyze website performance, and understand audience behavior. Get started with your free trial today.
Ready, set, go!
Read More: 7 Benchmarks to Win the Digital Gaming Industry, Get in the Game: How to Ace Audience Analysis
Track your digital metrics and grow market share
Contact us to set up a call with a market research specialist


