 Research Intelligence
How to Measure Mobile App Performance

Accurately measuring how mobile apps perform is crucial for any product team aiming for success. With a wealth of metrics and KPIs at their disposal, teams can pinpoint both an app’s strengths and areas for improvement, refining user experience (UX) and identifying opportunities for enhancement.
Key tracking parameters like user retention, app downloads, and load times are vital for spotting issues that may negatively impact user satisfaction and business goals.
App owners, developers and UX designers face constant pressure to innovate, making it even more critical to monitor these metrics. This helps keep users engaged and supports the long-term success of business objectives. Measuring mobile app performance extends beyond simple download counts, requiring a nuanced approach to understanding user interactions and system stability.
In this blog post, we dive into the key metrics every app owner should track for success.
The importance of mobile app performance
Mobile apps can’t thrive without a focus on performance. Prioritizing this can be a game changer for app developers.
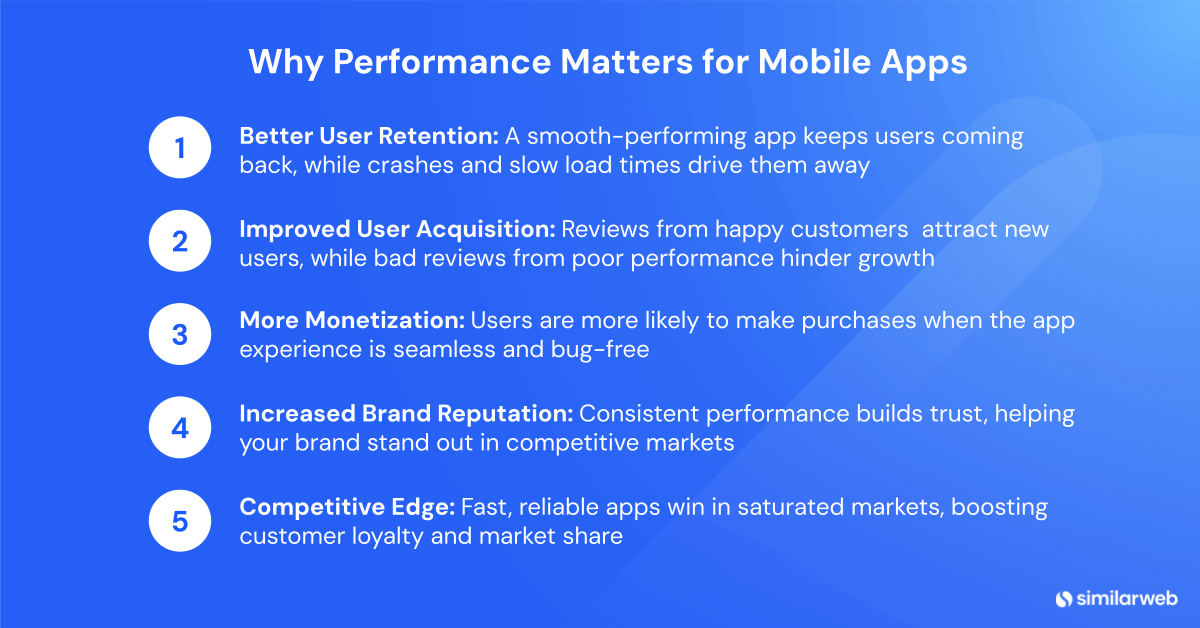
Here are the top 5 reasons why performance matters:
1. Better user retention
Frequent crashes, slow load times, and other performance issues can drive users away. Performance is a key factor in retention; the better your app performs, the more likely users are to stick around.
2. Improved user acquisition
Positive customer reviews and ratings in app stores attract new users. Conversely, poor performance results in bad reviews and fewer downloads. Consistent, high-level performance ensures new users keep coming.
3. More monetization
A smooth, reliable app experience leads to increased in-app purchases and subscriptions. Quality experiences make users more willing to spend, while crashes or bugs can deter potential buyers.
4. Increased brand reputation
Consistently good performance builds trust, while a poor experience can harm your brand. This is especially crucial in competitive markets, where every release can either reinforce or erode user trust.
5. Having a competitive edge
A fast, reliable app can be a key differentiator in a saturated market. That means faster, more reliable apps that offer better user experience. Developers who prioritize performance can gain a competitive edge, increasing customer loyalty and boosting market share.
Key metrics for measuring mobile app performance
To accurately gauge your app’s success, it’s essential to track a few key metrics. These indicators provide valuable insights into how well your app is functioning and how users are engaging with it. Here’s what you should focus on:
App downloads
The number of downloads indicates initial interest, while download velocity measures the pace of user adoption. High download rates suggest effective marketing and engaging app features.
Geographical data and performance by download channels help businesses assess market reach. Tracking download trends reveals how marketing campaigns or feature updates impact user acquisition speed.
For instance, a spike in downloads could signal that users appreciate a new feature or that a marketing campaign is resonating well.
App DAU & MAU
DAU (daily active users) and MAU (monthly active users) are metrics that are essential for effectively measuring user engagement.
DAU tracks daily interactions, offering a day-by-day snapshot of user activity, while MAU captures a broader view of user activity over a month. The DAU/MAU ratio, calculated by dividing daily active users by monthly active users, indicates user retention – higher ratios suggest stronger engagement.
For example, an app with 1,000 DAU and 3,000 MAU has a DAU/MAU ratio of 33%, meaning about a third of users engage daily. With this insight, designers can refine strategies to boost engagement.
User retention rate
User retention rate measures how many users return to an app after their first download and use. A higher retention rate suggests that users are satisfied with the app’s core features and are more likely to continue using it over time.
By analyzing retention patterns and identifying phases where users tend to drop off, app owners and developers can refine their strategies to boost retention.
For example, enhancing the onboarding process can reduce churn during the initial stages, while analyzing retention data can highlight key features that keep users engaged, guiding further improvements.
Churn rate
Churn rate measures the percentage of users who stop using an app within a specific period. Keeping churn rates low is essential for maintaining a stable user base. Understanding when users drop off is vital for crafting effective retention strategies, allowing for targeted re-engagement efforts.
For example, sending personalized reminders or offers to users who haven’t opened the app in a while can encourage them to return. Insights into why users churn can guide improvements to the app’s functionality and user experience.
Load time
There’s a direct link between an app’s load time and user satisfaction – slow loading often leads to quick abandonment. Users typically expect content to appear within two to three seconds; anything longer risks losing their interest.
Optimizing load times is key. This can be achieved by reducing image sizes, minimizing data requests, and improving server response rates. Faster load times result in higher user satisfaction and lower bounce rates, particularly for apps that load in under 2 seconds.
Errors and crash rate
Monitoring error and crash rates is crucial for ensuring app stability. Frequent crashes can lead to negative reviews and increased user abandonment. By tracking and swiftly resolving crash reports, an app can become increasingly reliable.
Users expect a seamless experience, and addressing issues promptly helps build trust and loyalty. For instance, quickly fixing crashes can significantly improve user retention and satisfaction.
Top tools for measuring app performance
Tracking app performance requires having the right set of tools. The following list shows five leading analytics tools that can help you analyze both the marketing and technical performance of your apps:
Similarweb
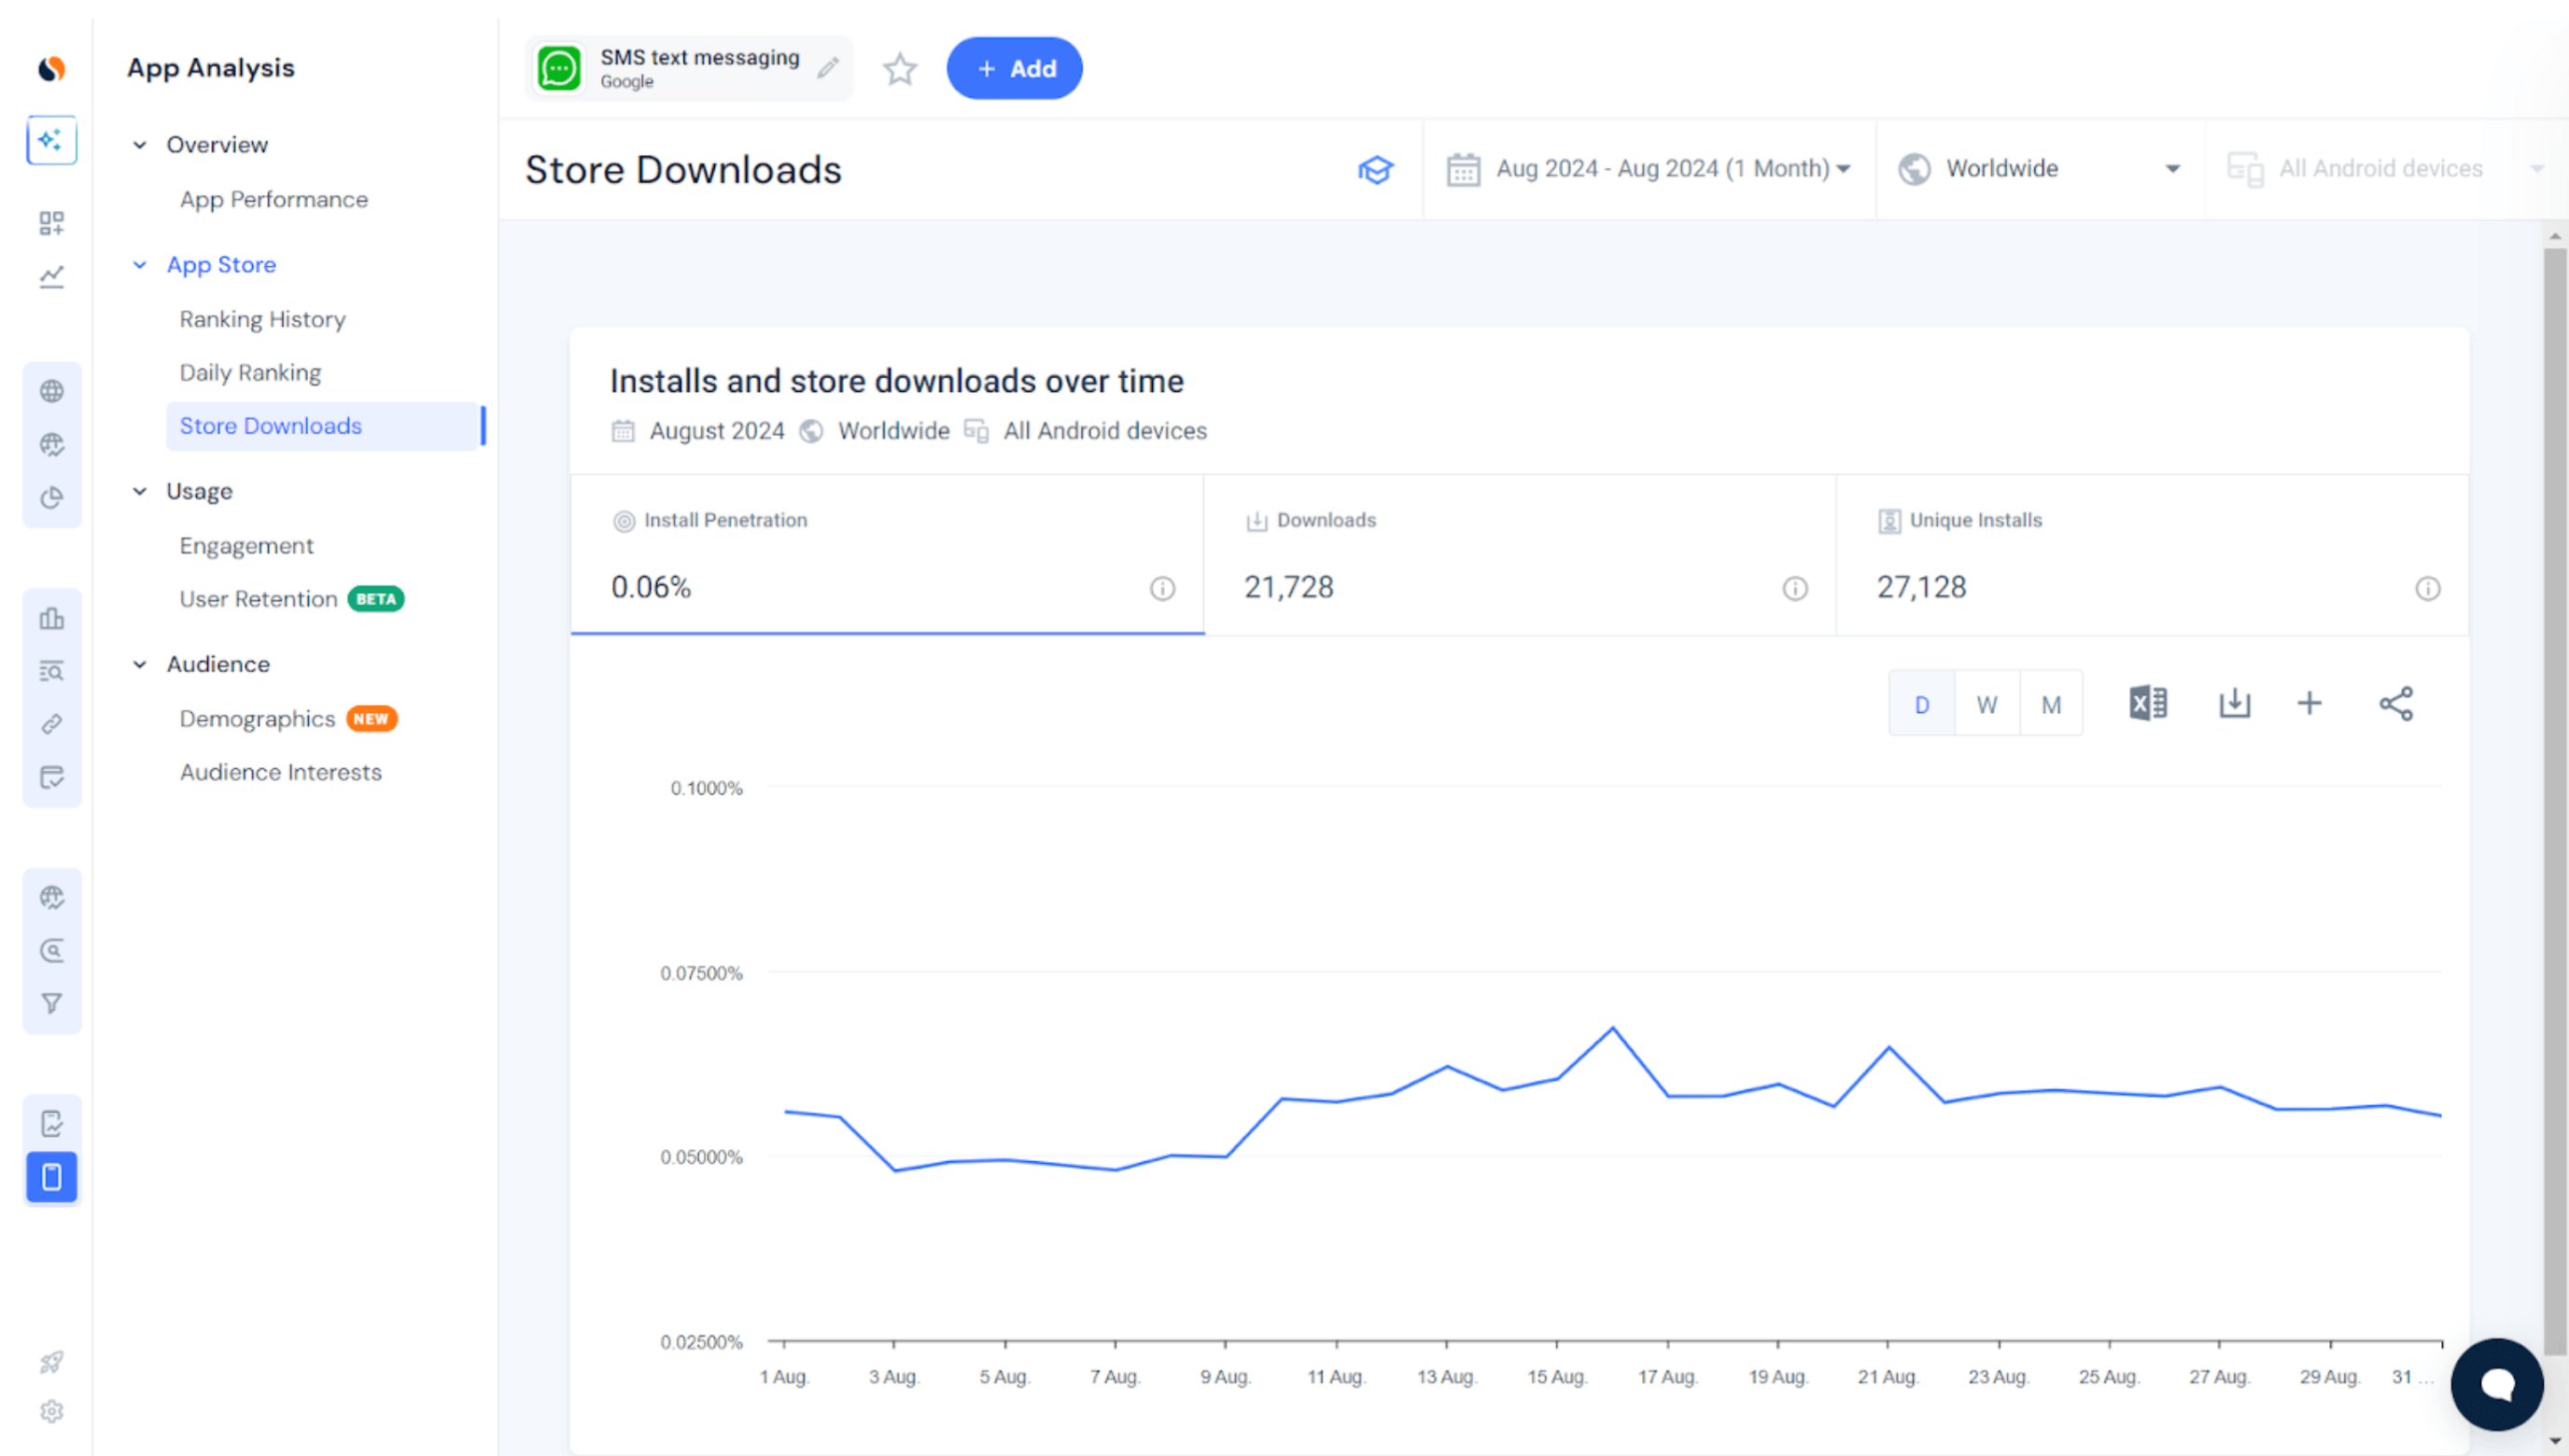
Similarweb App Intelligence provides in-depth mobile app traffic data, user engagement, and market competition. It helps track an app’s market position, understand user behavior, and assess the impact of marketing campaigns through engagement metrics. This tool is invaluable when measuring mobile app performance, especially for comparing traffic and usage with competitors.
Similarweb App Intelligence can be extremely helpful for your mobile app’s success when measuring app performance. For example, if you want to know how your app compares with the competition in terms of traffic and usage, Similarweb is the ideal tool to provide this data and more.
Google Analytics for Firebase
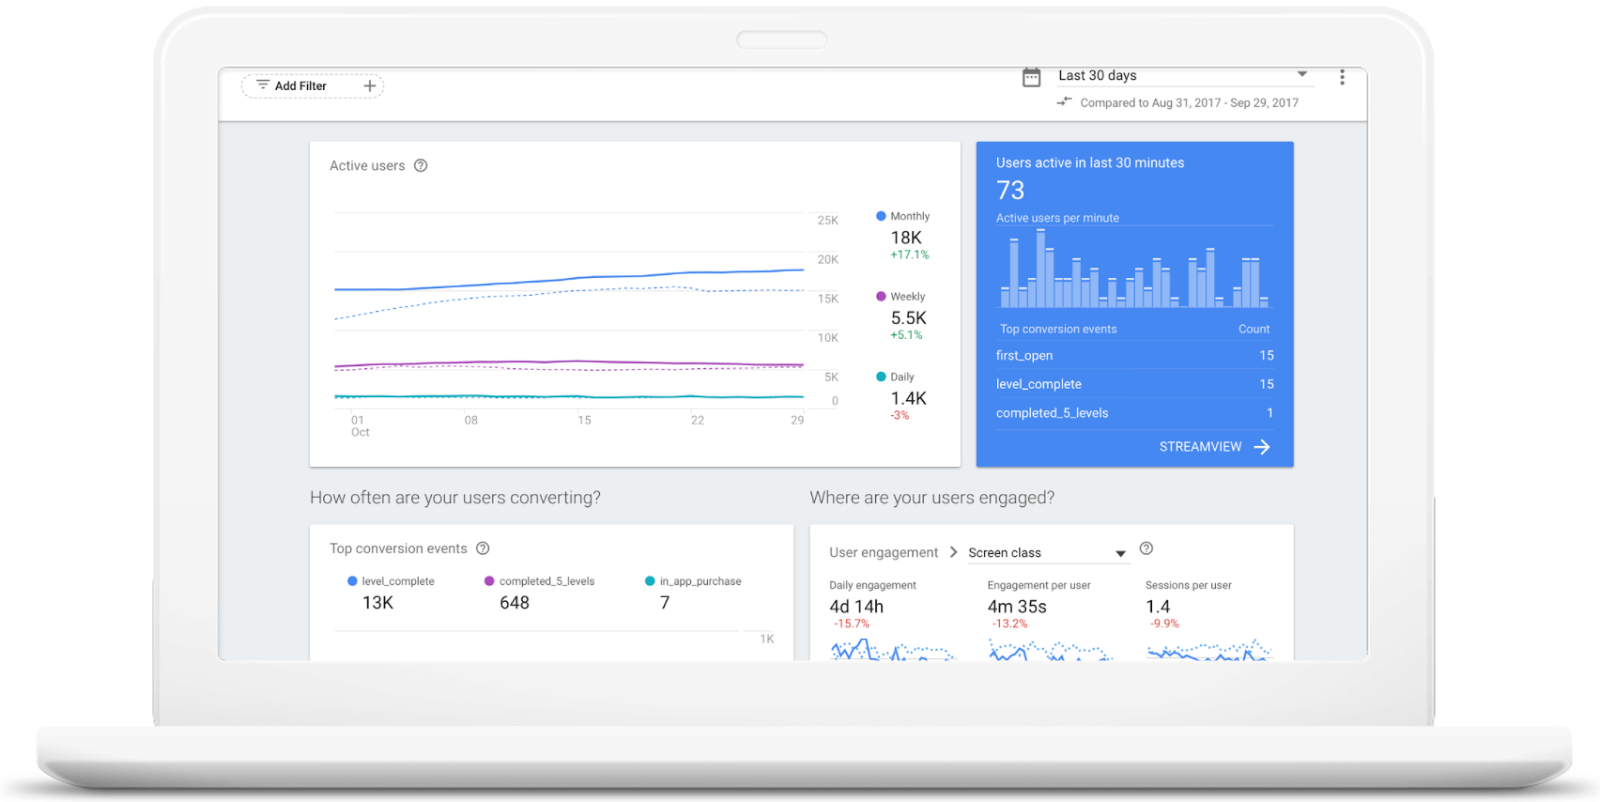
Google Analytics for Firebase provides detailed insights into user activities, app interactions, and technical performance. With crash reporting and performance monitoring, it helps developers optimize based on user behavior. The tool’s deep analysis capabilities allow for tailored strategies that improve user retention and satisfaction.
The tool also allows teams to sync data across Google services, offering a single hub where workloads and performance issues can be analyzed together. Teams can collect and analyze data more efficiently.
The Google Analytics for Firebase Dashboard (Source: Google)
App Annie
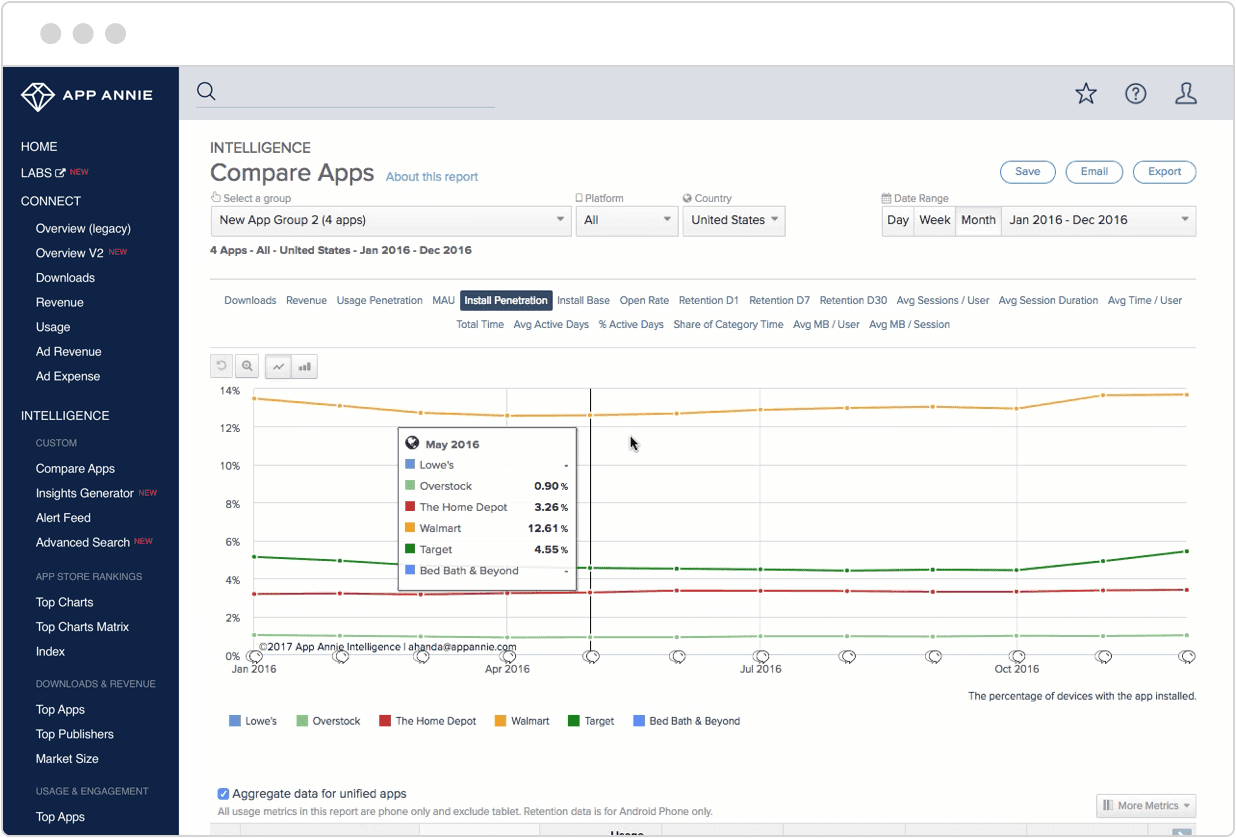
App Annie is a powerful app analytics tool that provides market data, app store optimization (ASO) insights, and in-depth analytics. It is valuable for analyzing metrics to measure app traffic and identify market trends. The data it offers enables businesses to compare their app’s performance against industry standards and competitors, aiding strategic decision-making.
This kind of competitive analysis allows companies to adjust their strategies to align with user behavior and industry benchmarks. App Annie’s extensive data set also helps identify emerging trends, keeping businesses ahead of the innovation curve.
The App Annie Dashboard (Source: Business of Apps)
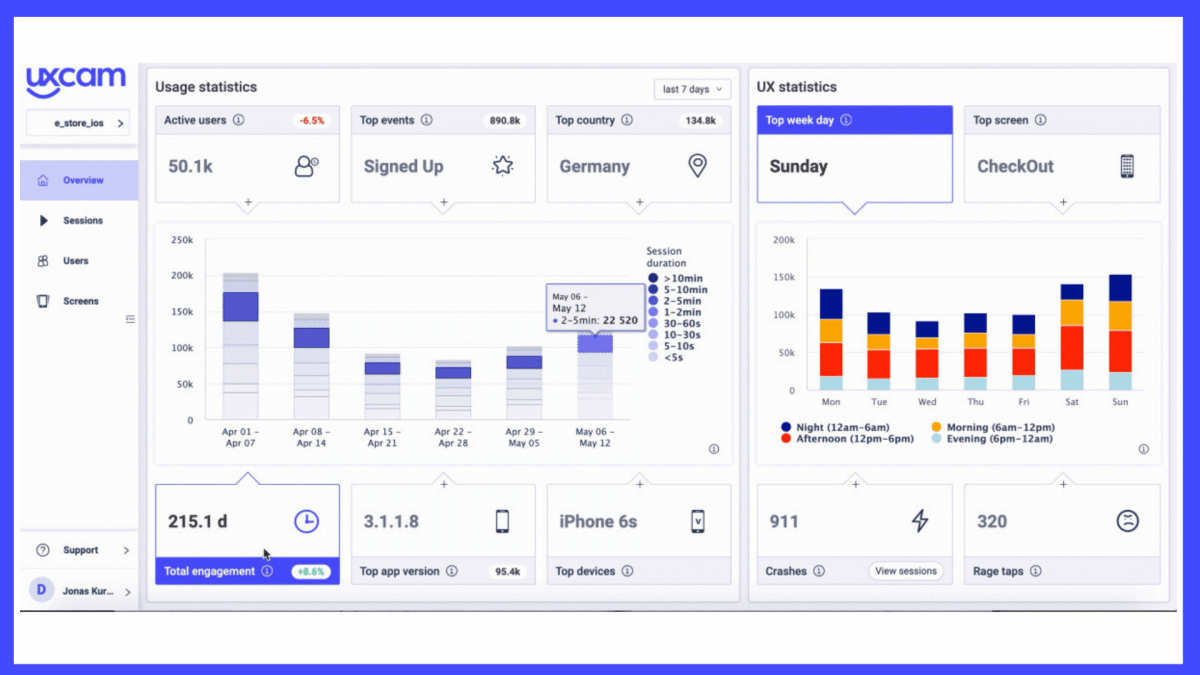
UXCam
UXCam is a user experience analytics service that offers heatmaps, session recordings, and user journey tracking. These features provide deep insights into retention analysis and pinpoint areas for user experience improvements.
Insights from this tool can guide design decisions, keeping the user interface simple and intuitive while enhancing app usability. User session recordings allow developers to see where users are coming from and gain detailed insights into their behavior and pain points. This makes it easier to implement meaningful changes that directly address user challenges.
The UXCam Dashboard (Source: UXCam)
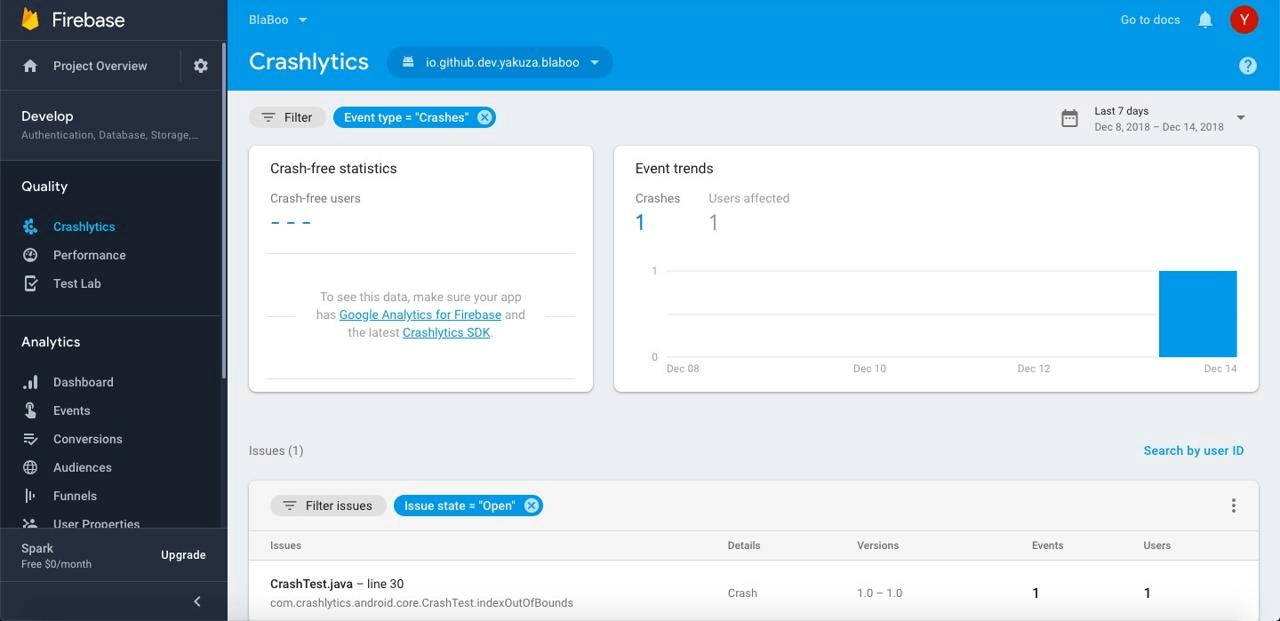
Crashlytics
Crashlytics, a popular crash reporting tool from Firebase, makes it easy to tackle issues fast by delivering real-time crash reports. Unresolved errors can cause app instability and lead to uninstalls, but with Crashlytics, you can catch these problems early and keep your app running smoothly – helping to prevent user drop-off due to technical glitches.
When integated with Firebase, Crashlytics gives developers a powerful toolkit for monitoring and optimizing performance, allowing them to quickly fix issues and keep users happy and engaged.
The Crashlytics Dashboard in Firebase (Source: Deku)
5 best practices for optimizing mobile app performance
Next on your app performance checklist, here are some best practices to ensure a positive user experience while achieving your business goals:
1. Optimize load times
Images and coding practices should be optimized so that pages can be loaded in less than two to three seconds. Fewer data requests to the server and faster server response times should be ensured. Where necessary, lighter frameworks should be preferred. Media files should be compressed.
A fast-loading app keeps users engaged from the start. For example, implementing lazy loading for images can reduce initial load times, enhancing the user experience.
2. Monitor user engagement
Measure DAU and MAU on a regular basis, so you know how users engage with particular features and can improve feature engagement rates. Keep your active users engaged and dormant users re-engaged with tailored notifications and offers.
Analyzing engagement patterns helps develop retention strategies. For instance, in-app personalized notifications can encourage users to explore new features, boosting engagement and retention. Tweet this3. Resolve crashes quickly
Leverage crash analytics tools to track issues in real-time and implement immediate fixes to minimize the crash rate and enhance app stability. Regular updates that address these issues are key to providing a smooth experience, improving credibility and brand perception.
User ratings and retention are closely tied to stability. A zero-crash policy with quick responses to issues can significantly improve user satisfaction.
4. Gather user feedback
Encourage users to provide feedback by distributing short surveys and in-app forms. Insights from feedback can help identify pain points, which can then shape future updates and optimization plans. You can make use of their answers to build a roadmap for feature enhancements and bug fixes.
It is also a strategy for continual improvement (again, thanks to feedback). For example, you could regularly update the product based on user suggestions, raising satisfaction and engagement by letting users know that their ideas, suggestions, and pain points are being heard.
5. Monitor continuously
Stay proactive by regularly reviewing performance metrics. Consistent monitoring helps identify potential issues early, preventing user dissatisfaction.
Tools like Similarweb App Intelligence offer valuable insights into mobile app traffic and performance.
Ongoing monitoring helps maintain high quality and user satisfaction. For example, automated monitoring tools enable quick responses to real-time issues, ensuring consistent performance and user satisfaction.
Turn your mobile app into a revenue generator
Effective mobile app performance analysis is crucial for delivering the best user experience, maintaining retention, and achieving business KPIs. With its comprehensive suite of tools, Similarweb provides the accurate data you need to elevate your app’s performance and climb the ranks in leading app stores.
With the right App Intelligence tools and performance data, your next big digital leap is just within reach!
FAQs
How can I measure my mobile app’s impact on brand health?
To assess a mobile app’s impact on brand health, track key metrics like reviews, ratings, and Net Promoter Score (NPS) to gauge brand sentiment and loyalty. Analyzing user sentiment, engagement, and loyalty can reveal whether your app strengthens or weakens brand perception. Additional measures like social media mentions, app store rankings, and brand-specific surveys can also help evaluate brand health.
How can I reduce app load time?
App load time can be improved by reducing image sizes to decrease data transfer and optimizing code to eliminate unnecessary computations. These steps work together to enhance the overall app experience.
How does user feedback improve app performance?
User feedback provides valuable insights into common pain points, technical challenges, and usability issues. Developers can use this information to make data-driven adjustments, improving the user experience and boosting retention.
How often should performance metrics be monitored?
Performance metrics should be monitored weekly, but real-time tracking allows for instant identification and resolution of usage and performance issues. This approach ensures users consistently have the best experience and helps prevent app failures.
Why is retention rate a key metric for mobile app performance?
Retention rate indicates how well your app retains users over time. A high retention rate suggests user satisfaction and app stability, while a low rate may point to issues like bugs or usability challenges. Tracking retention helps identify areas for improvement and maintain user loyalty.
Track your digital metrics and grow market share
Contact us to set up a call with a market research specialist
