Industry SWOT Analysis: The Right Metrics to Fuel Your Growth

No man is an island. That classic saying also applies to analysis. Just as humans struggle on their own, data analysis and company growth are virtually impossible to achieve with your data alone.
When you’re analyzing your internal strengths, weaknesses, opportunities, and threats in a SWOT analysis, having access to the industry data keeps you connected to the bigger picture and provides key information about external opportunities to optimize your business plan.
In an industry SWOT analysis, you focus on your larger industry with company and market research. The metrics important to your industry are going to be different from others. In this article, we’ll break down SWOT analysis using a few key industries as examples – marketing, media and publishers, retail, and gaming. We’ll show how you can use industry traffic and web metrics effectively to accelerate your strategy.
We’ll also provide hands-on examples based on accurate benchmarks to inform your strategic planning process.
Questions to ask in a digital marketing industry SWOT analysis
Gaining a competitive advantage over your rivals and industry starts with asking the right questions and metrics.
This lets you manage your growth with more confidence and less guesswork. With the right metrics and data, you can be more proactive and less reactive. Instead of simply following market trends, you can create and influence them in accordance with your company’s needs.
Here are some of the questions to kickstart a digital marketing industry SWOT analysis:
- How is my company performing relative to my competitors?
- What can I learn from my competitor’s strategy?
- What is the industry standard, and am I above, below, or average?
- How can I use data to identify new growth opportunities or product lines?
- Which trends can I use to my team members’ advantage?
In the following paragraphs, we’ll present you with some industry examples, including actual benchmark data, so you’ll see how the industry SWOT analysis works.
A SWOT analysis template can help you keep track of your company’s strengths and external environment over time. Download our free, easy-to-use template now.
Metrics for the media and publishers industry SWOT analysis
Online media sites thrive on traffic volume. Publishers want visitors to spend enough time-consuming content on multiple pages. The metrics you’ll monitor for this industry are therefore different from others, which might focus more on conversion.
For effective strategic management, you’ll want to know where your traffic is coming from and which devices people use to access your site. Characterizing your audience according to website demographics and behavior is equally useful.
To get an idea of where these numbers position you in the market, let’s look at some significant industry benchmarks.
- Most get their news on mobile devices – A little more than 60% access news sites on mobile devices and less than 40% on desktop. When comparing year-over-year, we see this is an ongoing trend, and the gap keeps widening.
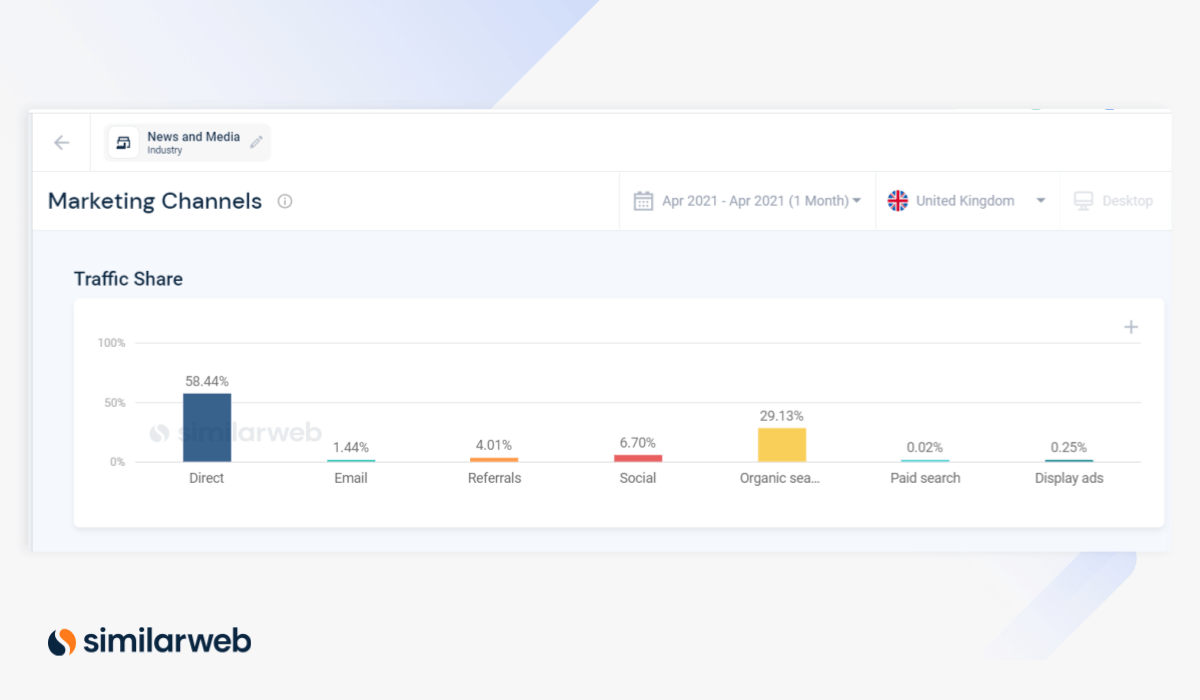
- Direct traffic dominates. Direct traffic makes up 65% of all news traffic. Next in line is organic traffic with 23%. The direct traffic market share is growing at the expense of organic traffic and paid search remains relatively insignificant. Social media also became a strong traffic driver in 2020.
- News websites traffic is highly related to specific languages and regions. You need to access relevant numbers for your country from a platform like Similarweb where you can see data breakdown by audience geography. For example, in the U.S., people spend on average 5:33 minutes per visit on a news site and view four pages on average. In Russia, on the other hand, the average visit duration is half of that. To run an effective SWOT analysis, you need to hone in on the right metrics.
To see how this translates into a typical business model in the practice of strategic decision-making, let’s look at an example. We’ll imagine you run a major metropolitan news site in California, such as the Los Angeles Times, and publish both local and international news.
- Strengths – Your numbers show that your traffic share in California is high, and you are ranking third among the top sites for the state.
- Weaknesses – An analysis of demographics with Similarweb’s unique visitors tool reveals that the share of millennials among your audience is low compared to your direct competitors.
- Opportunities – You identify that keywords related to the film industry bring a lot of visitors to your section on Hollywood.
- Threats – Leading sites grab more and more traffic with sophisticated apps. The device split reveals that people spend less time on your mobile app than average for the industry.
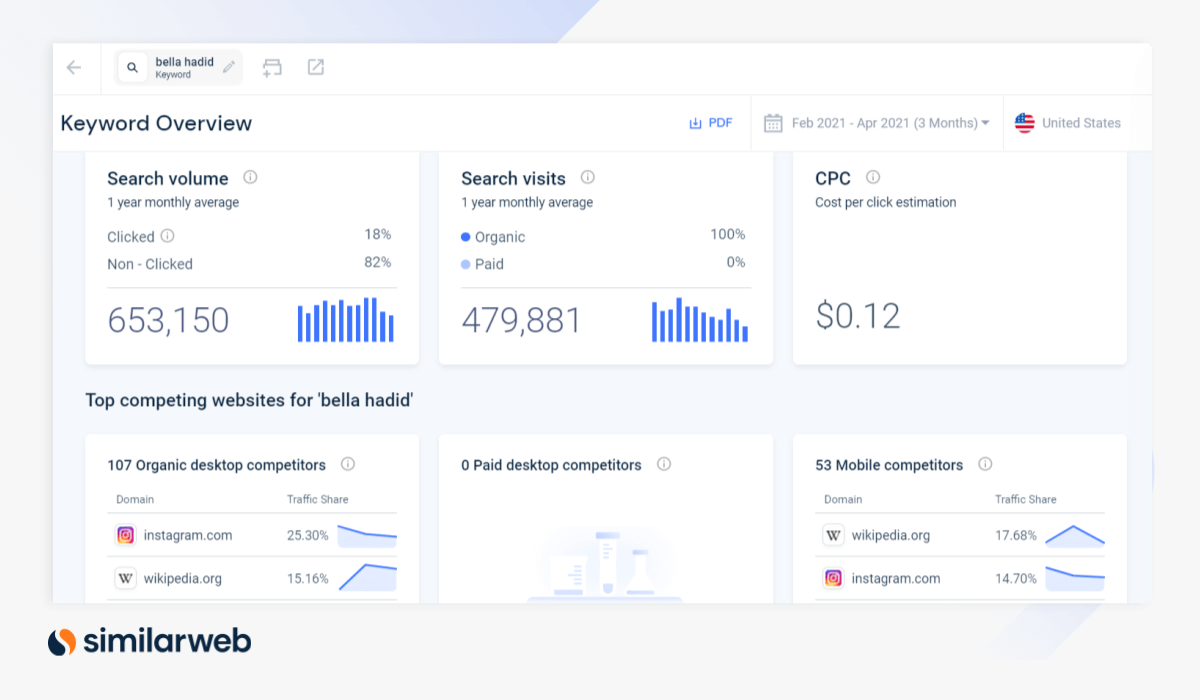
The key takeaways: Targeting keywords of Hollywood-related news about stars that are popular with millennials can help you capitalize on your opportunity with the millennial audience. Using Similarweb’s keyword research tools, you can find the specific keywords and trending topics that drive traffic to competitors’ sites and find the ones you should optimize.
You can also think about expanding social media platforms to attract younger readers. This industry SWOT analysis can be integrated into your strategic plan regularly.
Retail industry SWOT analysis plus benchmarks
eCommerce conversion rate is the number one metric to monitor if you’re a CPG or retail business.
After all, the better your conversion rate (CVR), the more revenue. To understand why you are or are not reaching your business planning goals, you need to deep-dive into the conversion funnel. Pinpoint the relevant metrics that represent your funnel stages and discover where you get prospects to engage and where you lose them.
Then benchmark to see what is considered normal in this category.
Here’s what your industry benchmarks tell you:
- Conversion rates grew 42% for your industry in the past year. You are in a rapidly growing industry. Visits to online shopping sites increased almost 10% in the past month. This presents a strong opportunity but also a considerable challenge to keep growing with the market.
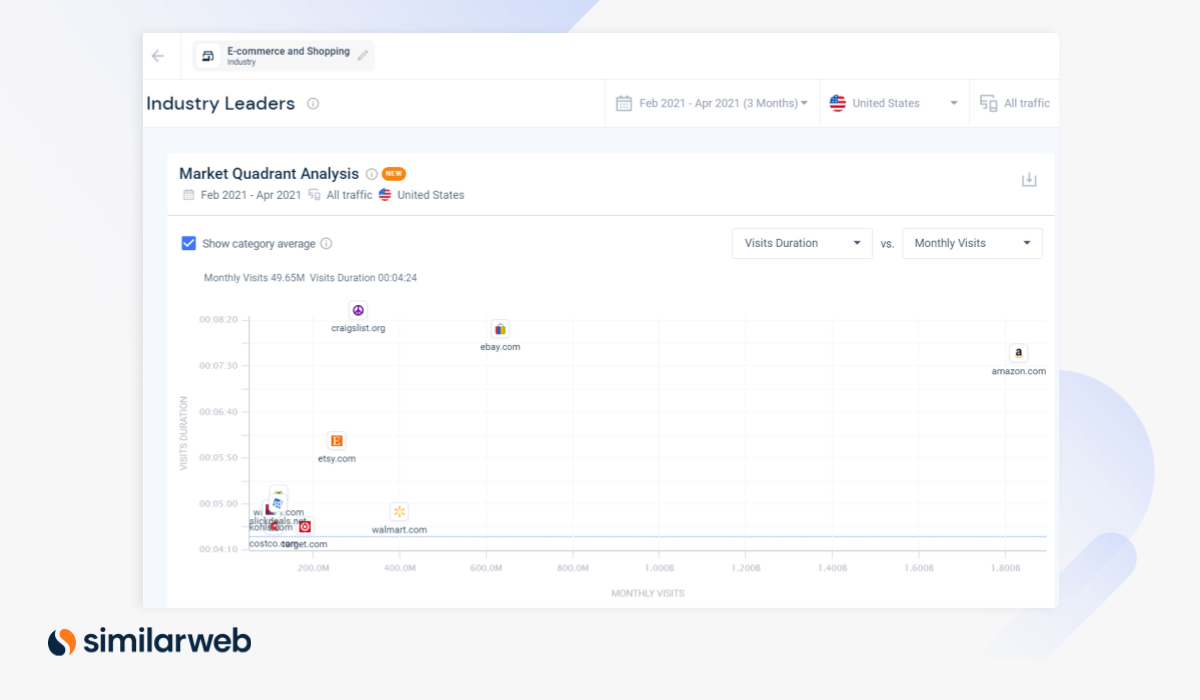
- Amazon is the industry leader. The retail giant receives almost a third of the U.S. traffic, but only 9% when looked at globally.
- Organic traffic share is +30%, higher than in other categories. Direct traffic is the strongest channel though. Paid search yields relatively high traffic volume in the U.S., and the number is increasing. Also, email marketing seems to play a more significant role in eCommerce in the U.S. than elsewhere.
- Conversion rates also vary considerably across countries. Germany and the U.K. have the highest CVR with over 10%. The global average is 6.6%, but only the top 10 countries make it over 4%.
- CVR also varies per product category. Essentials reach the highest numbers, with groceries leading by far, followed by health and household items, pet supplies, and beauty care.
- Mobile use keeps steadily increasing, compared to desktop, and is at 60% in March 2021.
How can you use competitive benchmarks in your SWOT analysis? You’d define your type of company and compare your data to similar companies in size, location, and shopping category.
Let’s say you’re a retail startup for pet foods and supplies and have only recently launched your eCommerce site in the U.S. (for now). You compare your data to sites like chewy.com, petco.com, and petsmart.com.
- Strengths – Your overall growth in traffic and conversion rate exceeds the industry. Try to find out what it is that works well in your marketing and business environment.
- Weaknesses – You identify the number of return visits is low compared to the competition, and you need to start working on customer loyalty. Having learned from the industry benchmarks that email marketing is an effective tool in eCommerce in the U.S., you decide to create campaigns for retention marketing.
- Opportunities – Analytics show you receive traffic from non-English-speaking countries. Might this be a sign that you can already venture into new markets?
- Threats – You see new sites popping up and quickly growing their share over the past months. You need to keep an eye on your competition. Someone could suddenly barge in and capture your audience.
Gaming industry SWOT analysis
A good gaming site is one that people stick to and find various video games they enjoy spending time on.
At the same time, you need to keep drawing in new users. To evaluate your success, you’ll explore stickiness and engagement metrics alongside the performance of your new products’ marketing channels.
One of the unique challenges for gaming sites is graphics on mobile devices, so device use is another internal factor to follow to keep your business strategy on track.
Here’s what the industry benchmarks tell you:
- Total visits to gaming sites grew 23% in the past year. We can attribute this trend partially to COVID-19, and there’s no sign of it dying down.
- The stickiness index for the top sites worldwide is 21%. Stickiness divides unique visitors by total visits to determine how often a user accesses your site on average during a month.
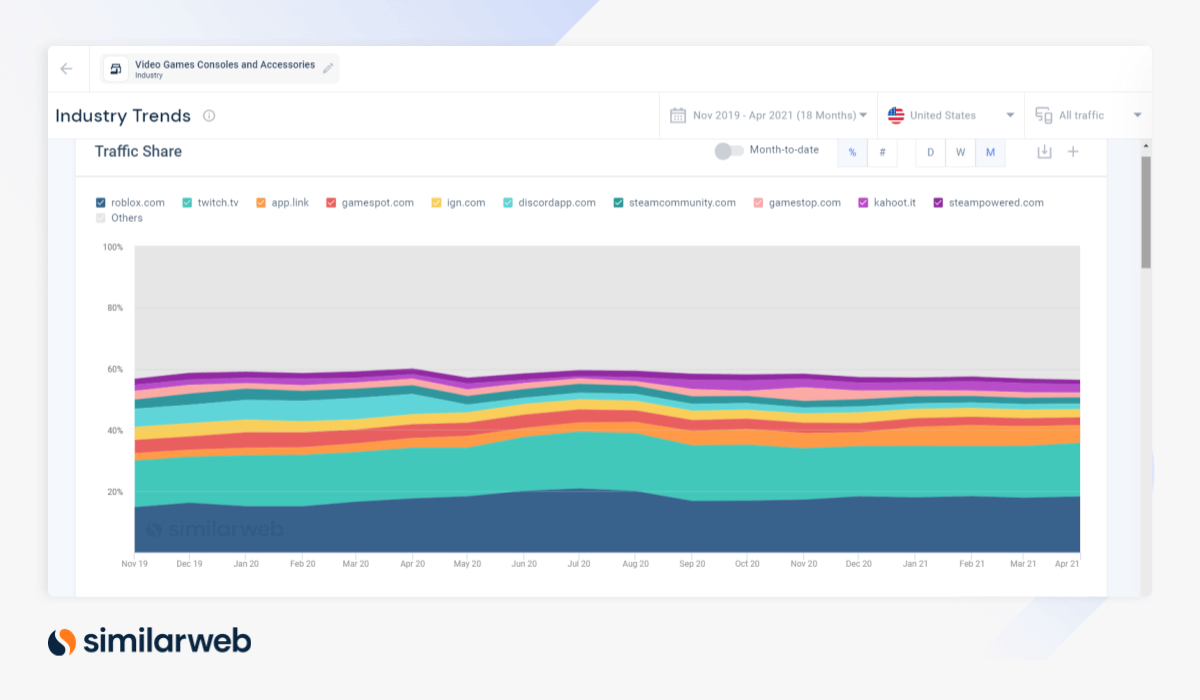
- The average visit duration is slightly above eight minutes, and people access on average seven pages per visit. Interesting to notice that twitch.tv, the site with the highest traffic share in the set, falls short in visit duration and pages per visit.
- Gamers prefer desktops. The device split in 2020 was 65%–35% in favor of desktop for the top 100 sites, compared to 68%–32% the previous year.
- Direct traffic dominates. It makes up 70% of the total traffic to gaming sites. The figure has grown at the expense of other traditional channels in a year-over-year analysis. Only the social media traffic remained unchanged.
For a SWOT analysis example, let’s imagine you are running one of the leading free gaming sites.
- Strengths – Figures show that people spend more time on yours than on other gaming sites. Your games are highly engaging and last longer than average. Your product is also quite sticky.
- Weaknesses – Most of your users are returning users, and your organization’s strengths rely on stickiness (i.e., organic and direct traffic). However, you are not attracting enough new users.
- Opportunities – To figure out why you’re not bringing in new gamers, you review your web traffic sources and discover that similar sites – of both large and small businesses –get more traffic from paid search. You can now learn from your competition and utilize this channel stronger.
- Threats – The majority of users play on desktops. Although this is common in the industry, you need to keep an eye on the trend. Competition is rapidly developing new games and could come up with new genres that might reverse the trend.
Where to find data for your industry SWOT analysis
Similarweb’s research analytics tool provides the most comprehensive data set to compare your performance metrics to industry leaders, your industry average, or a selection of competitors. You can drill down into the specific metrics that matter for your industry and automatically get the percentage of your traffic share (with no math required).
Similarweb makes benchmarking using real-time accurate data seamless.
Try Similarweb’s Research Intelligence now and upgrade your industry SWOT analysis for better strategizing.
This blog post was written by Ruth M. Trucks.
FAQ
What are the SWOT for industry?
The SWOT analysis of an industry uncovers internal and external factors that influence a company’s performance. Threats and opportunities are considered external factors, while strengths and weaknesses are often internally related.
What are the threats in business?
Some examples of threats in business include financial issues, economic uncertainty, and attracting and retaining talent.
Track your digital metrics and grow market share
Contact us to set up a call with a market research specialist


