Fresh Desktop and Mobile Web Data for Any Website
As people spend more time on their desktop and mobile devices, analyzing website traffic is essential to improve your site’s overall digital performance.
Using Similarweb’s Web Intelligence, you can enhance your analysis and broaden your reach in the multi-platform digital world.
Keep reading to find out how.

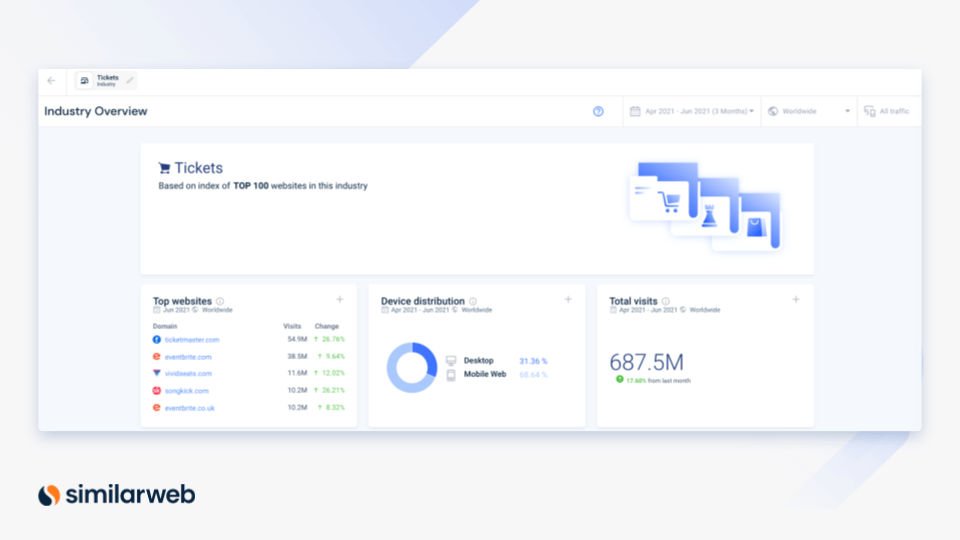
Top websites for total traffic
Are you a top website for total traffic? How do you compare to your industry?
Similarweb’s Industry Leaders feature lists top-performing websites in all categories.
That’s right. You can filter between all traffic, desktop, and mobile web data to see if there are different leaders on different platforms.
You can locate up-and-coming competitors by measuring traffic share.

How to use our Industry Leaders tool:
- Within Industry Research > Web Industry Analysis, you can compare metrics for industry leaders.
- Using the filters in the upper right, select the period of time for your data, the country, and the type of traffic you would like to analyze (Desktop, Mobile Web, or All Traffic).
Take it a step further: View the last three months compared to the last month to see how industry leaders change position over time.
If we stick to the competitive set above (the tourism and travel industry) we can see that currently booking.com, tripadvisor.com, and uber.com have the highest market share worldwide for total website traffic.
However, if we look just at desktop traffic to airbnb.com snags the third spot and uber.com drops from the list, which makes sense given that it’s a mobile app popular among consumers.
Engagement metrics that count
Since a more highly engaged user is more likely to return and convert, benchmarking engagement metrics on your site is critical to improving them.
With our benchmarking tools, you can see the most up-to-date website data and compare directly against your competitors and the industry at large. Engagement metrics paint different stories for desktop versus mobile web traffic.
They can tell you important details about how and when your customers are browsing your content, what they enjoy the most, and why they may be exiting your page quicker than you’d like.
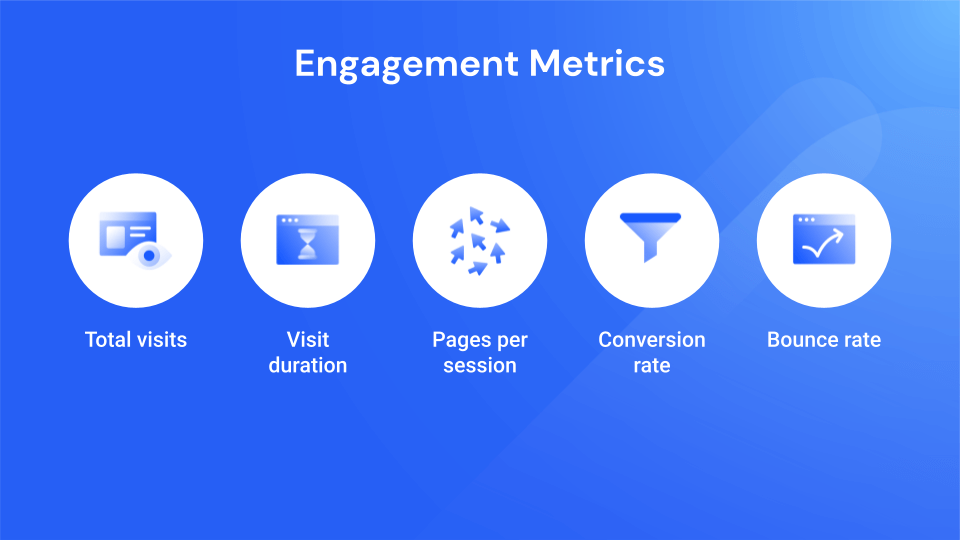
Need a refresher on the engagement metrics to look for measuring internet traffic? We’ve got you covered:
- Total visits – the sum of all visits to the domain for the selected time period. Use Total Visits to understand the overall number of interactions with a website via either desktop or mobile
- Average visit duration – measures the average time visitors spend on your website before leaving. The average session duration begins the moment a visitor arrives at your website and ends when they exit (or remain inactive for a predetermined time span).
- Average pages per session – the average number of web pages a user views in a session. This indicates how active users are while visiting during a specific timeframe.
- Conversion rate – shows the percentage of visitors to your website or landing page that complete the desired action, or went down the funnel. In most cases, this will be a sign-up or a purchase, but it could be any activity you define as conversion.
- Bounce rate – this is sometimes called the ‘exit rate’ and is the percentage of visitors to your site who left without interacting. Bounce rate counts all visitors who leave your website from the same page they entered without taking action, like clicking a CTA or watching a video.
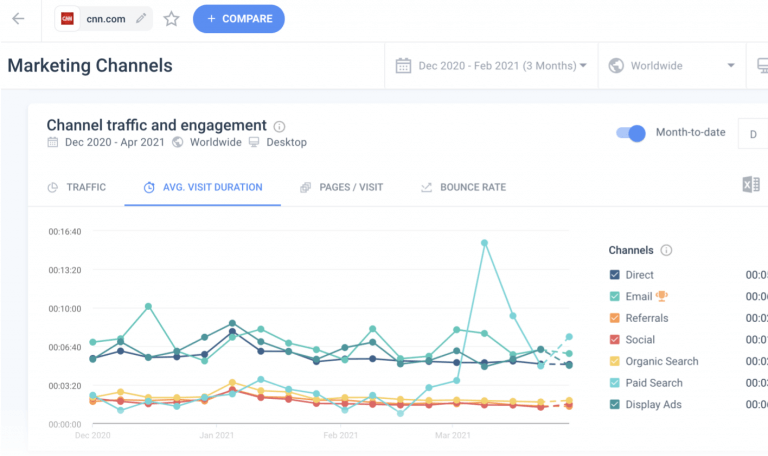
How to use Similarweb’s traffic and engagement tools:
- Within Company Research > Traffic and Engagement, you can analyze traffic gaps, and compare traffic and engagement metrics for up to five sites.
- Click + Compare to add up to four more sites.
- Using the filters in the upper right, select the period of time for your data, the country, and the type of traffic you would like to analyze (Desktop, Mobile Web, or All Traffic).
Take it a step further: Compare each site’s traffic per device with Device Distribution to optimize for user acquisition. For the world’s top publishers and media websites, mobile users have eclipsed desktop devices, as users choose to consume their news on the go via their Android device or iPhone.
Your audience demographics
Understanding your target audience is critical for market research, and who you are talking to can differ depending on if you’re speaking to them from a desktop computer or a mobile phone.
Audience demographics let you pinpoint who is viewing your site through each digital medium. You can analyze your strengths, monitor performance across different marketing segments, improve functionality, and optimize user acquisition.
It can also play an important role in driving brand awareness as you need the right messaging to target the most relevant audience.
How to use Similarweb’s audience demographics tool:
- Within Industry Research > Web Industry Analysis, you can compare demographic metrics for an industry.
- Using the filters in the upper right, select the period of time for your data, the country, and the type of traffic you would like to analyze (Desktop, Mobile Web, or All Traffic).
- You’ll be able to benchmark gender distribution (Breakdown by male and female visits in percentages) and age distribution (breakdown by age – six groups, starting at age 18).
Take it a step further: Add cross-country analysis into your research strategy to get an idea of the geos you outperform in, and others where you need to strengthen your presence.
When looking at audience demographics for the online ticketing industry, we can see a telling split for gender distribution across desktop and mobile web traffic. While desktop access is almost evenly split, females are more likely to visit ticketing websites via their mobile devices compared to men. We can also see that age distribution skews younger for mobile usage across both genders.
Get your data on-demand
Understanding how your website performs across different mediums provides you with important insights into consumer behavior, market trends, and optimization opportunities.
If you’re looking for a competitive advantage, improving your visibility into desktop and mobile web traffic will help you sharpen your strategy and become a fierce competitor. Try Similarweb now for free and start analyzing your device split all the way to the top of your industry.


Related Posts


Benchmarking Website Traffic: Complete Guide + 2025 Industry Data

12 Ways To Fine-Tune Your Ecommerce Landing Pages For Maximum Conversions

Track your digital metrics and grow market share
Contact us to set up a call with a market research specialist