


Research 101: The Ultimate Dictionary of Terms Every Digital Researcher Needs to Know

We all get emails or attend meetings that are jammed with digital jargon. It’s easy to get lost in the sea social media marketing strategies of terms that often sound familiar but don’t always mean exactly what we think. This dictionary is a collection of terms all digital researchers should know. You’ll find their definition in context, along with some useful resources and examples.
You can bookmark this page and look up words as needed.
Digital Research Glossary A – Z
Research Terms A-C
A
Acquisition Rate
You’re jumping right into the heart of digital marketing. Acquisition rate refers to the percentage of acquisitions out of your total audience reached. The metric helps you evaluate your social media advertising and display advertising performance, mainly when you use CPA as a payment model.
Ad Monetization
Generating revenue from your website, blog, or app by publishing ads. You can find a much more detailed explanation in our Digital Marketing Intelligence Glossary.
Analysis
We’ll try to keep it short and straightforward: A systematic, detailed examination of something complex. When you need to understand which components are incorporated in this something and how they function together, it’s time for analysis. In the digital world, an analysis examines digital data.
App Demographics
The App Demographics metric provides basic information about your app users, including age and gender breakdowns. Monitoring app demographics helps you better target potential users.
App Engagement
It should accurately be called user engagement with your app. In analytics software, such as Similarweb, the section contains usage habits, user lifespan, and overall engagement. You can track install penetration, downloads, daily active users, and monthly active users.
App Install Penetration
It sounds kind of heavy, but it is pretty simple. App install penetration is the percentage of mobile devices in a defined market that have your app installed. If there are 20M active devices in California, and your app is installed on half of them, app install penetration in California would be 50%.
As a formula, it looks like this:
- Install penetration = number of devices with the app installed x 100 / total number of devices.
Audience
The dictionary defines it as the readership of a newspaper or magazine or a group of listeners or spectators at an event.
In the digital world, an audience is the people paying attention to your content. The term doesn’t only include active followers, but any part of the public that shows interest, support, or even enthusiasm.
Anyone who regularly consumes your content belongs to your audience. They are a group of people you address in your marketing message and campaigns.
https://x.com/MemoZing/status/1176127115705503746?s=20
“It’s not about selling; it’s about creating value for your audience” – Jerry Allocca, Speaker | Author | Award-winning Digital Marketer, founder and CEO of Connected Culture Inc.
Audience Analysis
Refers to the study of the group of people that consumes your content or uses your app. The goal is to characterize them. The audience analysis in digital intelligence researches location, demographics, language, preferences, and behavior. It is a critical step in building a marketing strategy and lays the foundation for your buyer personas.
Audience Demographics
Shows the different demographic parameters of your audience, such as gender and age. Why are they a big deal? Read our insightful blog post on how to use website demographics in your audience analysis.
Audience Geography
The geographical location and distribution of your audience. If you think this is relatively trivial, this blog post tells you how understanding audience geography can help you boost your marketing strategy.
Audience Intelligence
The process of obtaining insights and data related to your audience. Innovative technology such as artificial intelligence, big data, and machine learning enables you to collect data about your audience’s behavior and preferences.
- Pro Tip: Develop a systematic method for researching your audience’s demographics, characteristics, and preferences and keep monitoring. This knowledge forms a cornerstone in your marketing strategy. Similarweb uses unique top-tier technology to collect and analyze digital data to provide the most comprehensive and accurate audience intelligence.
Audience Loyalty
Yup, there’s more on ‘audience’. Audience loyalty refers to the level of consistency with which your audience consumes your content or uses your app. A large number of frequently returning visitors signal a loyal audience and can be an indicator of customer satisfaction.
https://x.com/TheNotoriousMMA/status/434738340936835072?s=20
“Look out for those who look out for you. Loyalty is everything” – Conor McGregor, a professional boxer, and former Ultimate Fighting Championship featherweight, and lightweight champion.
Average Page Views
The metric measures single-page views and calculates the average per visit or session. Google counts each page load or reload as a page view. Therefore average page views show you how many times a visitor opened pages during the time they spent on your site.
That’s cutting it short. Tracking the metric can be useful for your engagement analysis. Find out how you can see competitor’s pageviews and benchmark against them using the Similarweb Platform.
Average Pages per Visit
This metric shows you the average number of pages visitors view on your site within a session. Wait a minute, how’s that different from average page views? Glad you asked. Pages/visit counts unique pages, not page views. It doesn’t matter if a visitor viewed the page once, three times, or twenty times. The goal is to show you how many different pages visitors view on average during a session.
Here’s how to calculate it:
- Pages/Visit = total number of pages/ total number of visits.
Example:
Let’s look at how the metrics in Google and Similarweb differ and what they tell you about your visitor.
Visitor A and visitor B both spent 10 minutes zapping through your website.
Visitor A arrived at your homepage, visited five product pages and two review pages, and then left.
Visitor B arrived at your homepage, opened two product pages, and then went back and forth between the two pages five times.
Page views on Google counts eight page views for visitor A and eight page views for visitor B.
Pages/visit on Similarweb counts eight pages/visit for visitor A and three pages/visit for visitor B.
You can learn from Google that both visitors were similarly active. By adding the pages/visit metric, you realize that visitor B was focused on specific pages. You can then check which pages and get a better understanding of the visitor’s intention.
B
Behavioral Marketing
A marketing strategy in which lead behavior determines segmentation to allow for more specific targeting. When a lead takes a particular action or a sequence of actions, the lead is automatically added to a segment.
Segments can be defined according to search history, a fixed number of visits to your website, a download, participation at a webinar, or any type of trackable action. This allows you to customize your marketing campaigns accordingly.
For example, a person who attended a webinar will receive a different follow-up mail than a person who signed up for the webinar but didn’t participate.
Benchmarking
The practice of comparing your business performance and results to the industry average or the industry best.
Companies typically benchmark cost, sales, and quality to find strengths and weaknesses and evaluate their opportunities. For digital companies, it is critical to benchmark traffic and engagement-related parameters.
Competitive benchmarking is a means for evaluating your options before entering a new market or launching a new product. It helps to realistically understand your market position and conduct competitive analysis as described in our blog. Accurate, comprehensive data can pave the way to the success of your marketing activities.
Bounce Rate
Google explains the bounce rate as ‘single-page sessions divided by all sessions, or the percentage of all sessions on your site in which users viewed only a single page and triggered only a single request to the Analytics server’.
Practically, the bounce rate is the percentage of visitors to your site who left without interacting. It counts all visitors who leave your website from the same page they entered without taking action, such as clicking a CTA or watching a video.
Such visits are referred to as bounces. Divide the total amount of visits by the number of bounces, and you receive the bounce rate.
Branded Keywords
If you’re involved in keyword research, you’re aware of its importance in winning the online traffic competition. A branded keyword is a keyword that includes a brand or product name or a variation of it. Find more details on branded keywords in our Digital Marketing Intelligence Glossary.
Buyer Persona
Here’s where analysis meets creativity. A buyer persona is an imaginary person whose profile fits your ideal customer. The persona represents the demographics, characteristics, and behavior of an individual who would benefit from your product or service the most.
Digital marketers create buyer personas based on research data to help them understand and target their audience accurately. You can design any number of personas to represent various audiences.
C
Call to Action (CTA)
A Call to Action is usually a clickable button that links to a landing page, a sign-up form, or initiates a download. It includes a command telling the user what to do, i.e., “Subscribe Now”. You can find out more from our Digital Marketing Intelligence Glossary.
Click-Through Rate (CTR)
The ratio between impressions and clicks on your ad or CTA. The Click-through rate shows what percentage of people who viewed an ad also clicked on it. In our Digital Marketing Intelligence Glossary, you can find a formula for the calculation of your CTR.
Check out our article – What’s a Good Click-Through Rate? Drill Down into 2021 CTR Benchmarks
Company Research
It feels like back to basics, doesn’t it? Company research refers to gathering relevant information and data about a specific company, usually to serve a distinct purpose.
Competitive Intelligence
The process of collecting and analyzing information about your competitive landscape, such as industry stats, business data, competitors’ performance, and details about competitive products and services.
Digital competitive intelligence includes data about your competitors’ website traffic, conversion rates, and online engagement metrics. The research aims at understanding the competitive elements in your market. It provides the necessary insights for executives to reach strategic decisions.
- Pro Tip: Competitive benchmarking lets you optimize your business strategy in many ways. Similarweb’s Complete Competitor Benchmarking Playbook includes industry benchmarks and useful tools, such as templates, worksheets, and checklists, to augment your analysis.
Consumer/Customer
You know who they are. They are the people your business goes after. But there are many words to describe them, so let’s define them for more clarity to help you differentiate between audience, consumer, customer, visitor, etc.
Consumers are the people who use a product or service. When they pay for what they consume, they are customers.
Also, it is common to use the term consumer for the general public. When speaking about their own business, people typically use the words ‘customer’ or ‘client.’
Consumer Behavior
Refers to the study of how individuals or groups consume. The goal is to understand how people choose and buy products, what causes desire and impacts judgment, how they reach decisions and spend money.
In the online sphere, digital consumer behavior includes tracking how often people check their phones or use an app, how much time they spend on a site and how they prefer to engage. You can see, this is where engagement metrics come into play.
Consumer Characteristics
Characterizing consumers is the attempt to find what groups of consumers have in common. Consumer characteristics include website demographics, consumer preferences, and also consumer behavior.
Consumer Intelligence
No, we’re not talking about checking the IQ of consumers. In the context of research, consumer intelligence is the gathering and analysis of data about existing and potential customers. This type of research aims at understanding consumer characteristics and behavior in your target market.
Consumer Intelligence is a valuable tool for marketers to set up and optimize audience targeting based on data about demographics, location, and behavior.
https://x.com/Brand/status/1284545469998407682?s=20
“Good marketing makes the company look smart. Great marketing makes the customer feel smart” – Joe Chernov, CMO pendo.io, speaker, Content Marketer of the year 2012
Consumer Journey Tracking
On their journey towards becoming a customer, prospects pass a number of touchpoints with your company or website. Consumer journey tracking measures and monitors the data associated with these touchpoints. The consumer journey or customer journey can be described as a series of incidents or actions on the way down the funnel.
To track, you first map the customer journey, then divide it into steps and define representative data that lets you measure progress. This is an essential element in your conversion funnel optimization.
Conversion Analysis
For many marketers, the conversion rate is the single most important metric to measure and improve. Conversion analysis is the process of identifying and quantifying the factors that impact conversion.
Understand what drives conversion, what hinders it, and where your traffic comes from. Gather and monitor the relevant data and measure the overall quality of incoming traffic. Discover how efficiently domains convert traffic. Use channel conversion to identify low-quality traffic sources to focus on adjusting and see how onsite search can pinpoint threats and opportunities down to a product level.
- Pro Tip: Similarweb’s industry-leading Conversion Analysis tools provide unique features, allowing website conversion analysis of your competitors’ digital strategies, marketing mix, and conversion performance. You get a fresh perspective on your industry statistics. Check out our unique tools.
Conversion Form
You probably refer to it as a sign-up form. which you request visitors to fill out on your website or landing page. It’s also called a conversion form when submitting the form counts as a conversion.
Conversion Funnel Optimization
A conversion funnel is the visualization of the steps a visitor takes toward conversion. Your goal is to provide your visitors with the means to reach conversion quickly and easily. When you take the necessary action to make their customer journey as smooth as possible, it is referred to as conversion funnel optimization.
Conversion Intelligence
The process of gathering data related to conversion. This includes measuring the quantity and quality of incoming traffic, identifying the highest contributing marketing channels, and more. Conversion Intelligence helps you maximize your conversion rate.
Conversion Rate
The percentage of visitors to your website or landing page that complete a desired action. In most cases, this will be a sign-up or a purchase, but it could also be any other activity you define as conversion.
Conversion rate is often a key metric in calculating your ROI. It is, therefore, essential that the defined action is related to your business goals.
You can calculate your conversion rate as follows:
- Conversion rate = (conversions / total visitors) * 100%
Cost Per Acquisition (CPA)
CPA is a pricing model used in online advertising. You pay the publisher for each acquisition of a new customer. The “acquisition” is a specifically defined action or a set of actions the user takes. Want to get a better understanding? Go to our Digital Marketing Intelligence Glossary for more details including a calculation formula.
Cost Per Click (CPC)
The actual amount you pay for a click on your PPC ad. Again, this is a specific digital marketing term, so you’ll find additional explanations in our Digital Marketing Intelligence Glossary.
Customer Cohort Analysis
A variation of consumer behavior analysis based on dividing them into sections. Rather than viewing the entire scope of customers, users, or visitors as a whole, you split them into subgroups with similar characteristics or behavior patterns. These are called cohorts.
Analyzing cohorts allows you to drill deeper into the nuances of their online behavior and identify less-obvious discrepancies between them which can help you optimize your marketing activities.
Customer Journey
The path someone takes from being a prospect to a paying customer. The customer journey describes the steps, and touchpoints visitors typically go through till they convert.
In eCommerce, the entire journey happens on your website. In other business areas, the customer journey typically includes additional touchpoints with your company, such as downloading content, participating in a webinar, or signing up for a demo.
Research Terms D-H
D
Daily Active Users
The number of users who engage with your app or website daily. The metric shows the average number of daily active users (DAU) in a given timeframe. Executives and investors seem to have a thing for this metric. Why?
DAU reflects your growth potential and indicates the stickiness of your product or service. A fast-growing number of DAUs is an almost certain promise for revenue if the definition of ‘active’ is based on revenue-generating activity.
The catch is, if you look at DAUs isolated from other engagement metrics, it can be misleading. For a conducive analysis, it’s crucial to research DAUs in the appropriate context.
Data Analysis
The process of systematically applying logical and/or statistical techniques to collected data to discover useful information.
It can also refer to the inspection and evaluation of data.
Data Collection
The gathering and measuring of information on targeted variables with a specific goal or intention.
Data Quality
Depending on the context in which you use the term, it can mean different things. In the digital world, data quality most commonly refers to the accuracy and usefulness of data. High-quality is when your data correctly represents the reality it measures.
- Pro Tip: Unlike other analytics tools, Similarweb derives market data from a complex blend of non-intrusive digital signals, including crawling, first-party direct measurement, external partners, and anonymous behavioral data and public data sources. Our accurate and complete data set for website traffic analysis lets you create an accurate map of your market position and monitor ongoing changes as they happen.
Deduplicated Audience
The deduplicated audience metric in Similarweb’s analytics software reveals how many users are driving traffic to your website across devices. This allows for accurate audience analysis and can deliver a clear understanding of where to spend your media budget (mobile/desktop/both). Deduplicated audiences can be considered a proxy for a website’s actual user base.
Demand
Refers to the level of willingness and ability of the population to consume a given product or service.
Demographics/Web Demographics
You hear this term a lot. Don’t be fooled; not everybody who uses it knows its definition or significance. Demographics is the study and statistical recording of the population in a given area. On the most basic level, it includes data collection regarding age and gender but can expand into many directions such as family status, socio-economic status, occupation, or anything that may be relevant for a specific research goal.
In web analytics, the population is your visitors, and the area is usually your website or app. The metric measures gender, age, device, search preferences, and other engagement parameters.
Understanding your visitors’ demographics helps you create your buyer personas, set-up targeted marketing messages, and use the best-suited marketing channels according to demographics. Read in our blog how to analyze your website demographics effectively.
Device Distribution
Shows the percentage of visitors using mobile vs. desktop devices. Device distribution helps you identify trends in device usage for your app or web content.
Digital Intelligence
When talking about digital intelligence in research, it refers to obtaining and analyzing digital data to get background information on what’s happening on the web and use it to build strategies, protect your system, and more.
Not to confuse with the official definition of the DQ Institute: “The sum of the social, emotional and cognitive skills that enable people to meet the challenges and demands of digital life.” Without a doubt, you need one to do the other.
Display Traffic
The traffic that reaches your site via an ad on a display network. If you use display advertising to promote your product or service, the traffic that arrives resulting from someone clicking on your ad is your display traffic.
E
Email Marketing
A highly effective marketing strategy in which you use emails to promote your brand or products. It seems pretty obvious, however, there’s more to it than meets the eye. Find additional information about email marketing in our Digital Marketing Intelligence Glossary.
Engagement KPIs
KPI stands for key performance indicators. Engagement KPIs are parameters that let you gauge your audience’s level of engagement and measure progress towards your goals. Increasing engagement is a common goal in digital marketing. Set specific, measurable indicators and then allocate the relevant engagement metrics to quantify.
Engagement Metrics
Any metric that informs about any form of engagement with your website or app is an engagement metric. They reveal how active your visitors or users are. Engagement metrics include average visit duration, pages per visit, bounce rate, and more for websites; For apps, downloads, install penetration, and daily active users are considered important engagement metrics.
Combining several such metrics and dividing them by your total visitors establish your engagement rate.
Engagement Rate
The metric measures the level of engagement of visitors or users with your website, your app, social media pages, or brand.
There are different ways of defining engagement rates. For social media, you count likes, shares, and comments and divide the total by your total number of followers. For websites and apps, you first need to define engagement and then determine the representative engagement metrics.
See which metrics are included in the engagement rate metric on Similarweb.
- Pro Tip: When someone signs up for your app, they don’t engage for the sake of engagement as they would on social media; they expect to get something in return. Engagement rate indicates how well your app meets user expectations after they sign up. Retention depends on the value your customers find in your service. Monitoring engagement rate helps you determine the level of customer satisfaction and identify potential churns.
F
Featured Snippet
You see them all the time but may not know their snappy name. Featured snippets are the short excerpt of text that shows at the top of Google’s search ranking page (SERP) and present a quick answer to your search query. The snippet is featured in a text box below the ads and above the organic search results. It includes the URL of the web page from which the text is pulled.
Funnel
The visualization of the steps someone goes through on the journey to becoming a customer. The funnel concept includes the notion that many start the journey and few finish it – hence the wide-open top and small opening at the bottom.
There are many funnel variations. Essentially they derive from the same theory and include the same basic steps.
A conversion funnel is a term primarily used in eCommerce, where the journey occurs on your website.
Other industries also speak about sales funnel, marketing funnel, or purchase funnel. These include all marketing channels and media that play a role in acquiring and retaining customers.
An optimized funnel is essential for maximum conversion rate.
To discover how you can easily analyze your competitors’ conversion funnels, check out our Conversion Analysis tool.
H
Historical Research
The investigation of past events in an attempt to understand and explain the cause of events and their effect on the present.
Research Terms I-N
I
Impressions
One of those terms that seem hard to grasp but are really very straightforward. Every time a user allegedly sees your ad, it counts as an impression. In other words, when your ad shows on the user’s computer screen or when the URL of your webpage appears on a search engine ranking page (SERP), that’s an impression.
As a metric, impressions indicate the level of exposure your ad or page receives. Some payment models, such as CPM in third-party display advertising, are based on the number of impressions.
Inbound Marketing
This marketing methodology uses educational content, branding, SEO, and other tools to draw prospects in. Inbound marketing is a modern approach that moves away from the traditional methods of pitching a product. To get an understanding of how it works, go to our Digital Marketing Intelligence Glossary.
Incoming Traffic
The traffic that arrives at your website or landing page from anywhere outside of your domain. Analyzing your incoming traffic is helpful for planning the use of marketing channels. You can effectively measure and analyze incoming traffic from referral sites with Similarweb.
Visitors leaving your domain are referred to as outgoing traffic.
Industry Trends
A general, identifiable direction or course within an industry sector. A trend can refer to prices, costs, sales, marketing methods, popularity, and consumer habits.
Identifying industry trends is vital to your strategic planning and lets you quickly adapt to changes.
Similarweb’s analytics software provides insights on traffic trends for your industry.
Influencer Marketing
This might be the most fashionable item in our entire research dictionary! Influencer marketing is a popular form of referral marketing, in which a person perceived as an authority in their field promotes your product or service. Influencers are people who have gained a reputation of being knowledgeable and reliable in a specific field, based on their experience, expertise, or status in the industry. More on Influencer Marketing in our Digital Marketing Intelligence Glossary.
K
Key Performance Indicators
Measurable parameters with which you evaluate progress towards a specific business goal. Depending on the goal, you define representative indicators that have the capacity to show progress.
Key performance indicators (KPIs) are widely used in finance. A KPI could be growth in revenue, net profit margin, etc. In sales, you might set a lead-to-sale ratio or average order value as a KPI. Digital marketers may set goals for cost per acquisition or ROI on ad spend.
Examples:
For a KPI to fulfill its purpose, it needs to be a) realistic, b) measurable, and c) time-specific.
If the sales team has a tough time keeping its budget, your goal may be to lower costs. KPIs could look like this:
- Reduce the cost of acquisition to $x by the end of Q4, 2020
- Increase customer lifetime value by x % till Jan 31st, 2021
If you launch a new app, you want to make sure it’s successful. Some representative KPIs could be:
- Increase incoming traffic by x% during the first month and x% every following month
- Reach app install penetration of x % by Q2, 2021
Keyword Research
The process of researching which terms people type into search engines. The goal is to find the keywords to use for SEO and in paid search. In the Digital Marketing Intelligence Glossary, you can see additional information.
M
Market Research
A structured initiative to gather and analyze information about a market that you are part of or are planning to enter.
Market research includes interpreting data about consumers and competitors. It aims to gain insight into your potential customers’ demographics and purchase behavior.
It is equally important to explore who your competitors are, what they offer, at which price, and how. Understand how successful they are and what their market share is. The goal is to portray the competitive landscape and recognize market dynamics so that you can create an effective strategy.
- Pro Tip: Similarweb provides all the tools you need to research your market online through competitive analysis and benchmarking. Analyze competitors’ traffic share and find out what their most effective marketing channels are. Understand their customers’ characteristics and behavior with reliable traffic data.
Market Segmentation
For a more detailed assessment, you can divide the market into segments. Define specific parameters shared by customers, such as age, device usage, preferences, etc., and split the market accordingly. You can also segment according to product categories or supplier types, such as brands and retailers or accordion to size.
The idea is to create smaller, more homogeneous groups for more accurate segment analysis. This helps you pinpoint growth opportunities and develop your strategy with a focus on various audiences.
Read more – What Is Market Segmentation: Tips, Types, and Benefits Explained
Read more – 7 Steps in Market Segmentation: How to Get it Right Every Time
Market Share
The dictionary defines it like this: “the portion of a market controlled by a particular company or product.” This raises the question, what does “controlled” mean in this context? It refers to the portion of the demand for a product covered by that company.
Market share is generally measured as a percentage of all products in the category sold in a specific area over a specific time.
For example, let’s assume the general demand for robotic vacuum cleaners in a defined market is 2000 per month. One company supplies 200 a month to consumers. That means the company’s market share is 10%.
Learn more on how to calculate market share in our article – Expand Your Reach: 4 Market Share Formulas to Get You There
Mobile Attribution
If you are in advertising or business development, you need to get familiar with this term. Mobile Attribution refers to the method that determines which campaign, partner, or channel gets credited for an app install or another app-related conversion.
In web attribution, pixels, and cookies do this job. These aren’t relevant for apps, and even though the models may be the same, the process of mobile attribution is more intricate. Also, customer acquisition for mobile apps is usually more complex to track because of the many possible touchpoints.
Monthly Active Users
Essentially, this is a key performance indicator (KPI) for user engagement. Monthly active users (MAU) refers to the number of unique users or visitors who interact with your software in a month. It’s most useful for mobile apps, SaaS platforms, online gaming, social media, and any other online business that relies on returning customers.
The critical part is to define what an “active” user is. Is a user who signed in considered “active,” or do they need to interact in some other way? It depends on your app- or website type. For a blog, visitors who read an article are active enough, but for a music app, you’d want them to listen to at least one song.
You can turn MAU into a highly valuable metric for your business if you use it in conjunction with additional engagement metrics. For example, calculating how many monthly active users get involved daily lets you assess your product’s stickiness.
Multichannel Marketing
Using a variety of marketing channels to promote your product or brand is called multichannel marketing. Marketing channels could be email marketing, social media, display advertising, etc. Get additional insights in our Digital Marketing Intelligence Glossary.
N
Non-Branded Keywords
Any keyword that does not include a specific brand or product name. More on that in the Digital Marketing Intelligence Glossary.
Research Terms O-S
O
Open Rate
Good-ol’ email marketing is still a marketing channel no company can succeed without. Open rate refers to the percentage of email recipients that opened an email. The metric serves as one indicator of the success of email campaigns and correspondence.
Monitor open rates to evaluate your email subject lines. Optimizing this crucial element will increase the open rate and get more recipients in front of your content.
In the long run, the metric can also show how valuable your email content is for the recipients. When people get used to finding something beneficial in your emails, they are likely to open it even if the subject line is bland.
To calculate the open rate, use this formula:
Organic Keywords
A keyword that yields organic traffic. More on the subject in our Digital Marketing Intelligence Glossary.
Organic Traffic
The traffic that arrives at your site as a result of organic search as opposed to paid search. Organic traffic is the traffic you do not need to pay for. Successful SEO results in increased organic traffic.
- Pro Tip: Use Similarweb’s analytics software to monitor your organic traffic and compare it to your competitors. You’ll get a solid grip on where you stand with your SEO strategies in relation to everyone else in the market. Moreover, you’ll identify trends and opportunities and use the data for further optimization.
Outbound Marketing
A marketing method that puts ads and offers in front of consumers, regardless of whether they asked for it or not. All traditional forms of marketing fall in the category of outbound marketing. Our Digital Marketing Intelligence Glossary has more details.
Outgoing Traffic
Describes the traffic that is being sent out from your server or website. Most marketers are interested in incoming traffic, which is the traffic that arrives at your website, app, or machine from an external source. But there are exceptions.
As an affiliate, for example, it’s essential also to understand your outgoing traffic. Similarweb’s Outgoing Traffic section contains an analysis of traffic sent from the analyzed website to other domains via referral links. You can analyze your own website as well as others.
Monitoring outgoing traffic is also critical for security reasons.
P
Page Hit
The term was born in Google Analytics and is not very common anymore. If someone uses it, they usually refer to a “page view,” although they are not exactly identical.
A hit is any single request to the web server. This could be any action the visitor carries out, a download, a click on a link, etc. The request to open a specific page would therefore be a page hit. However, opening a page can include multiple requests to the server and technically include numerous hits.
Page Views
Here’s how Google defines a pageview: “an instance of a page being loaded (or reloaded) in a browser. Pageviews is a metric defined as the total number of pages viewed.”
In other words, the metric counts the number of times any page was loaded on your browser. If one visitor viewed 20 different pages on the website, the metric shows the same number as when the visitor reloads the same page 20 times.
Pages Per Visit
This metric tells you how many pages visitors view on average within a visit or session. Similarweb calculates Pages/Visit by dividing the total number of page views by the total number of visits. Use the metric with other engagement metrics to understand your visitors’ on-site activities and stickiness.
Paid Keywords
A keyword that yields traffic from paid search. Read more in our Digital Marketing Intelligence Glossary.
Pay Per Click (PPC)
An online advertising method that uses keywords to drive results. You pay only when a user clicks on your ad. Go to our Digital Marketing Intelligence glossary for more information.
Publishers
Publishers in the digital marketing world are people or companies who use their resources and space on the web to display someone else’s ad. The term is relevant mainly in affiliate marketing. The affiliate is the publisher, who collects a commission when achieving a preset goal.
Researching website traffic is useful for evaluating publishers’ performances and determining the best-suited payment model.
R
Reachability
How big is the audience that you can reach with your social media posts or other marketing types? What’s the size of the audience an influencer is able to reach? Reachability refers to your potentially reachable audience.
Typically, the reachable audience includes all existing and potential customers with whom you have a communication channel. They could be following you on social media or receiving your email newsletters. To increase your reachability, explore additional marketing channels, and target additional audiences.
The term is also used in influencer marketing. To determine how influential a social influencer really is. Checking the number of followers may not be sufficient. People who follow more than 1,500 accounts are not considered part of the reachable audience because they aren’t likely to see the influencer’s post.
Referral Traffic
The traffic that reaches your site as a result of someone clicking on a hyperlink. Referral traffic can come from an affiliate, a blog, a forum, a directory, a social media network, or an email (if adequately tagged). Read more in our Digital Marketing Intelligence glossary.
How to Open a Successful Affiliate Program
Return on Investment (ROI)
In brief, ROI measures the profitability of an investment and shows it as a percentage.
A high ROI means you made a lot of profit (had a high return) on what you invested. In marketing, the metric serves as a performance indicator for marketing initiatives.
You take the aggregated amount of your marketing campaign’s cost and deduct it from the amount spent by customers you acquired from the campaign.
For example, if your marketing spend is 20K and your marketing-generated new sales is 40K, then your ROI is 20K (or 50%).
Calculating ROI in marketing can be tricky because the actual investment is difficult to gauge for non-paid advertising. Likewise, the return on initiatives such as SEO is not precisely measurable.
Returning Visitors
You have to love them, the visitors that keep coming back for more. Anyone who browsed your site within the past two years counts as a return visitor.
Tracking the number of returning visitors compared to new visitors can tell you a lot about your product’s stickiness and the loyalty of your audience.
Check out our article – How to Analyze Website Retention Using New vs. Returning Users
S
Search Engine Optimization (SEO)
The measures you take to increase the quantity and quality of organic traffic. Find more details on our Digital Marketing research glossary.
Discover the latest trends in SEO in our dedicated blog category
SERP (Search Engine Ranking Page)
The page on which the results of a search query are displayed according to rank. More on the Search Engine Results Page (SERP) in our Digital Marketing Intelligence Glossary.
Search Keyword Analysis
Keyword analysis is one of Similarweb’s advanced features. It allows you to measure traffic generated by a particular keyword to a particular site from any search engine. Moreover, you can find information on website position, landing pages related to the SERP, and keyword CPC and Volume.
Can you see how this lets you deep-dive into the usage of any keyword on the web? You will unveil the competitive landscape for all your search terms. Search keyword analysis is the foundation for a powerful keyword strategy for your PPC campaigns, SEO, and content marketing.
Segment Analysis
Refers to segments on a website. Rather than analyzing websites as a whole, this feature in Similarweb’s research software lets you examine a specific section of any website. Hone in on a critical area and benchmark more effectively against competitors. You can focus on a particular business line, a category, a topic, or a brand on any website.
Segment Share
This time we’re talking about market segments. The concept of segment share is essentially the same as market share, only on the segment level.
For example, insurance is a massive market with many segments. If you specialize in health insurance, your share of the entire insurance market might not be huge. You may, however, dominate the health insurance segment. Your segment share would be significant.
You see how segmentation can change your view of the entire landscape. Assessing the segment share of the different players helps you accurately determine your position and potential growths.
Segmentation
We’ve mentioned segments a lot, but what are they all about? Segmentation is an effective method in research to gain a more detailed understanding of a large entity. Divide the whole into sections and analyze each individually.
You can divide the market into segments based on location, size, turnover, product category, or more. You can segment your audience according to demographics or your website traffic according to device.
The main idea is to create smaller groups with matching criteria in a particular area for a more specific analysis.
Session
A session or online session in web analytics includes all interactions of a user with your website or app from the time they arrive at your website until they close your website on their browser.
In short, a session starts when someone opens your site and ends when they leave. All the activities and interactions within that period are part of the session. Analytics measure session duration, pages viewed per session, and other data to help you get an understanding of how users interact with your site or app and how engaged they are.
Share of Voice
Does this remind you of music? We didn’t think so. Originally, share of voice referred to the size of your share of advertising compared to your competition in your market.
This definition doesn’t cut it for today’s digital marketing world, where advertising involves consumer engagement. In digital marketing, share of voice refers to online visibility in general, including organic search, PPC, and social media.
The definition gets stretched even further in social media. Your share of voice means your percentage of the overall amount of online discussion about a topic or product. Share of voice reveals your advertising’s power to impact the market. It’s also an indicator of how popular you are on social media.
Similarweb Rank
Similarweb developed a method to rank websites based on traffic. We calculate the number of monthly unique visitors, together with the number of page views across desktop and mobile traffic. You can view industry leaders in traffic according to category or location.
For apps ranking there’s the Similarweb algorithm that factors current installs and daily active users. The usage rank weighs more towards engagement (DAU) than to reach (current installs), making it the best metric to measure “Active Reach.”
Social Media Analytics
This refers to the statistical data on your social media platforms.
Social Data
The stuff that gossip is made off? Sort of, but not exclusively. Social data is information people voluntarily share on social media, giving away who they are and how they socialize. It includes demographics, biographical information, interests, political views, and so on. Social data also comprises the social contacts and interactions of a person or organization.
Analyzing social data is helpful in understanding your audience and developing your buyer personas. You can build your marketing strategies and campaigns based on what social data reveals about your target audience.
Social Media Influencers
Simply put, these are individuals with the capability to influence large audiences through social media marketing. A social media influencer is perceived as an authority in certain subjects or industries and has an excessive number of followers. Companies pay influencers to promote their products or brands. Get more info in our Digital Marketing Intelligence Glossary.
Social Media Listening
“Listening” to what people say on social media refers to actively monitoring specific social media activity and analyzing it. Marketers use tools such as Sprout Social, BuzzSumo, or Brandwatch to monitor for keywords, topics, competitors, or industries. Social media listening also includes analyzing the data and using the insights to reach decisions about social media marketing strategies.
Social Media Monitoring
Most people would tell you it’s the same as social listening. That’s not entirely wrong. However, technically the term social monitoring refers only to the actual tracking of social media conversations without the second part, analyzing for action.
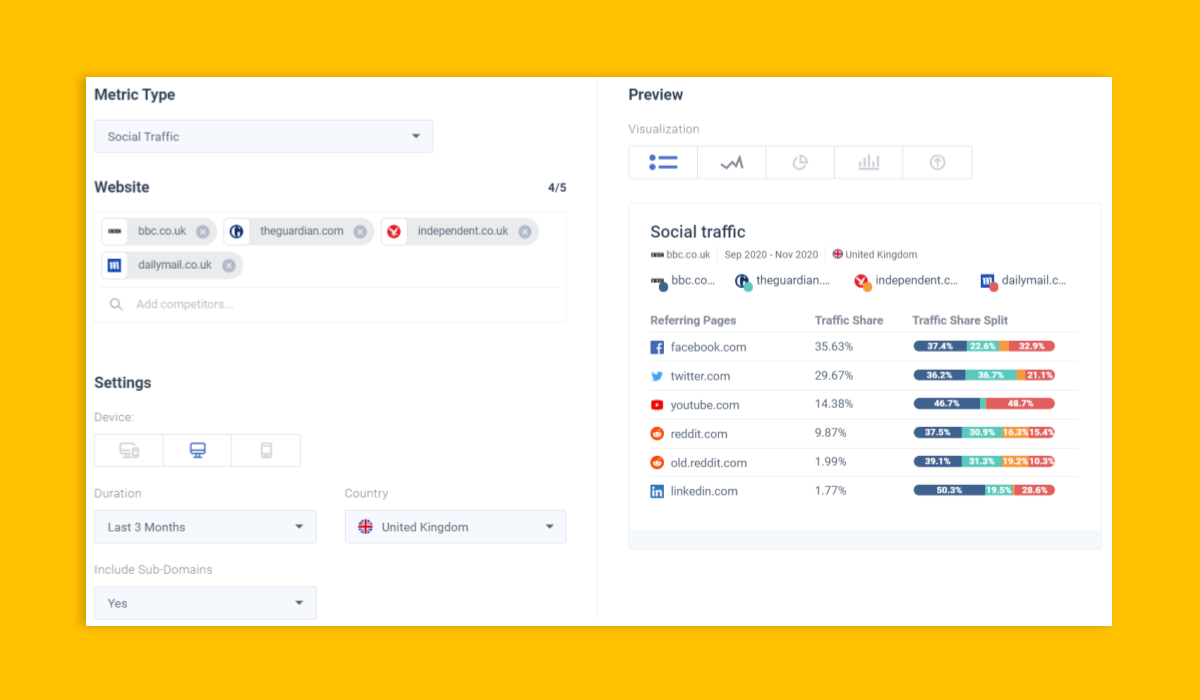
Social Traffic
The traffic that reaches your site through social media is called social traffic. When someone clicks on a link in an ad on social media, they also appear under social referrals as a section in referral traffic.
Analyzing social traffic’s quantity and quality is becoming increasingly significant, with social media platforms offering ever-advancing advertising possibilities. You should expect a growth in traffic share from these sources, whether from paid ads or your shared content.
The days when it was just Facebook are long gone. Today, each age group seems to have their preferred social network. Researching social traffic can help you understand how audiences vary. This is valuable input for business development.
Stickiness
This metric gauges how “sticky” your brand is. You learn whether customers stick to your brand or wander off to find alternatives.
Let’s try and make this sound more professional: a sticky brand is one that customers frequently visit and purchase. The higher the frequency of purchases by return users, the more “sticky” your brand.
Take Amazon as an example: They significantly increased stickiness by introducing the customer loyalty program Prime.
- Pro Tip: Similarweb provides a measure for stickiness. It shows the average number of days in which users were active in a month. In other words, the number of daily active users (DAU) is divided by the number of monthly active users (MAU). For many business sectors, the DAU/MAU ratio is a crucial engagement metric. Stickiness is relevant for SaaS apps and eCommerce sites or anyone trying to increase customer loyalty.
Research Terms T-W
T
Target Audience
If you understand ‘audience’, you also get what ‘target audience’ means. The audience is defined by “the people giving attention to your content”, and the target audience are the people you want to reach with your content.
Your aim is for them to be identical. To get a grip on how well your content is adapted to the target audience’s needs and demands, research your actual audience and see how well they match the target audience you aim for. Your target audience could be gen Z-ers, but if your actual audience consists mainly of millennials, your content attracts the wrong age group.
Check out our article – What Is a Target Audience and How You Can Analyze Yours
Time on Page
In Google Analytics, time on page is defined as the “average amount of time users spent viewing a specific page or screen, or set of pages or screens.” That’s pretty straight forward, and we couldn’t describe it any better.
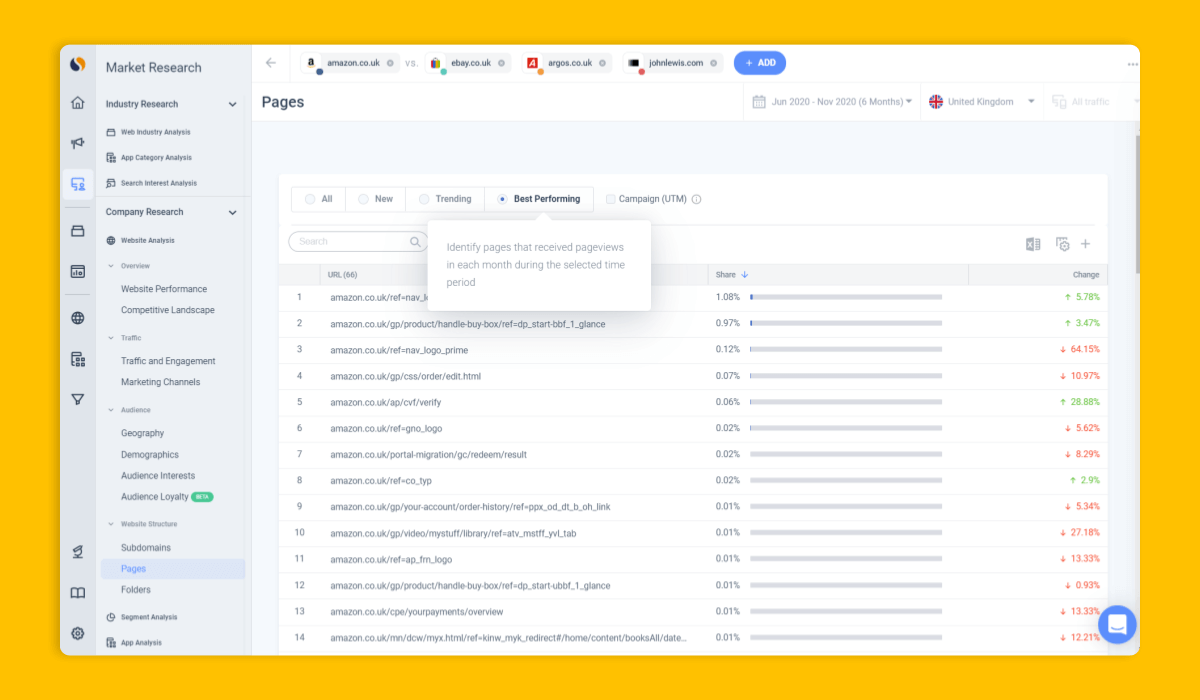
Top Viewed Pages
This is another unique metric in Similarweb’s web intelligence tool. Discover which pages your visitors view most. Not only that, but the top-viewed pages section also shows trends. Find out which pages receive increasing or declining traffic.
If you run an eCommerce site this statistic suggests which products are most popular, and which gain or lose popularity. On SaaS platforms, you can quickly identify which features are used most often and which are less useful for your customers.

Traffic Analysis
The process of understanding everything about the traffic that reaches your site. Measuring, monitoring, and interpreting data about quantity and quality from different traffic sources via various devices.
Analyzing how people reach your site and what drives them provides insight into which marketing activities are more successful than others. Also, analyze what characterizes the people who arrive at your website. Discern demographic differences in traffic from various channels and so on.
Traffic Analysis is vital in determining the performance of your website or your app. It allows you to uncover trends and opportunities and prevent setbacks by recognizing the early signs of changes. Read more on How to check & analyze website traffic
- Pro Tip: Similarweb Pro provides the most in-depth and accurate traffic analysis in all aspects. Use the knowledge you gain from the data-based research to drive more quality traffic to your site. Read in our blog post 18 ways to increase traffic to your website.
Traffic Sources
Where does your traffic come from? You can receive traffic through search engines, social media platforms, display networks, other websites, emails, and so on. All of these are sources of traffic. On Similarweb, ‘traffic sources’ displays the distribution of traffic across the different traffic sources.
Identifying which sources send you the most valuable traffic is essential for your marketing strategy. Discover which are most effective. Also, investigate what your competitors’ most potent traffic sources are and leverage them for your business.
U
User Acquisition Networks
A network or company that provides a platform or tools for user acquisition. This could be a display network or any ad bidding platform for websites or apps. User acquisition networks are specifically important for apps, and they are different from those for the web. Find out more in our Digital Marketing Intelligence Glossary.
User-Generated Content (UGC)
Content that is created by a user and placed on your website or social media page. We are not talking merely about comments or reviews – although this is the most common form of UGC – but about users sharing images or stories as part of an interactive campaign. Adding user-generated content can improve SEO ranking.
V
Viewership Metrics
Typically refers to a television audience. It is also applied for video and some web analytics include a viewership metric.
Viral Marketing
You are correct in associating ‘viral’ with social media. When something goes viral, it means it’s spreading rapidly.
In viral marketing, your audience spreads an ad or a promotion throughout social media channels. All you need is to create an irresistibly catchy video or post and count on your followers to share it massively and fast. Easy said. Learn more in our Digital Marketing Intelligence Glossary.
Visit Duration
Similarweb’s equivalent of Google’s session duration. We at Similarweb chose another name because we calculate the metric slightly differently and put it in context. You get to choose your business category and compare it with your competitors or similar companies. Also, you can select a specific region or compare it globally.
Visit duration is relevant for websites. For app usage, Similarweb offers a dedicated metric that measures ‘time per user”.
Find out why this is important and how to use it to research and strategize in our blog post: ‘Session Duration – How to Measure It and What it Reveals’.
Visits / Unique Visitors
The metric shows the average number of visits per unique visitor in the given time frame. Get an estimation of how often people return to your site. This is calculated by dividing the number of total visits by the number of unique visitors.
Visits by Country
Another Similarweb feature for advanced traffic analytics. You can view the number of visits worldwide or filter data according to 58 countries, including 10 U.S. states.
In addition, the platform provides a snapshot of the five countries that most traffic is coming from to each website. An extended view shows the top 100 countries. Click here to take Similarweb platform for a test drive today.
W
Web Analytics
The study of web usage. Yes, it’s a broad term. To be more specific, let’s apply Gartner’s definition: “Web analytics refers to a market of specialized analytic applications used to understand and improve online channel user experience, visitor acquisition, and actions, and to optimize digital marketing and advertising campaigns.”
It’s still a mouthful, but this definition is relevant for online businesses. Web Analytics includes collecting, measuring, monitoring, reporting, segmenting, and storing web-usage-related data. In Similarweb, data comparison and benchmarking are also part of the analytics set.
Analytics tools integrate with other data sources, reporting, and management applications. They are most useful for the website operation team and marketing-related professionals. These are the people who are actively applying web analytics.
But it doesn’t stop there. Business development and strategic business decisions rely heavily on web analytics. Make sure you use the tools that provide you with the most reliable and accurate data relevant to your business.
Website Analysis
The process of examining a specific website regarding speed, design, content, SEO, traffic, and performance. A website analysis can include all of these and more but doesn’t have to. It depends on the purpose of your analysis. Keep in mind that all are closely related by cause and effect. To comprehend one aspect, you usually need to analyze the others as well.
Website Engagement
Here’s another stretchable term for you. Engagement encompasses any interaction of visitors with your website. But, what is considered engagement for one business type may not be for another.
On a news site, reading and absorbing content are considered an engagement. For other sites watching a video, downloading a file, or participating in a discussion counts as engagement. On social media, engagements are likes, comments, and shares.
Evaluating website engagement is critical in understanding visitors’ behavior.
Website
A group of publicly accessible, interlinked pages under the same domain name on the Web.
Final tip for today: Bookmark this page so that you can come back to it quickly at any time. Also, share it on social media and with your colleagues so you’re all on the same page when it comes to defining research terms.
Looking for more key terms to add to your research dictionary? Take a look at all our other glossaries:
- Sales Terms – The Ultimate Sales Dictionary
- Stock Market Terminology: The Ultimate Glossary of Investor Terms
- 52 eCommerce Terms You Need to Know
- Digital Marketing Terms: The Ultimate Dictionary
- A Guide to Market Research Terminology For Beginners
- AI Glossary Terms Every Fast-Paced Marketer Needs to Know
- +250 SEO terms to know
This blog post was written by Ruth M. Trucks.

Related Posts


How to Conduct a Social Media Competitor Analysis: 5 Quick Steps


Get ahead of game-changing consumer trends
Contact us to set up a call with a market research specialist