Post-COVID Consumer Trends – What to Expect Next

The world keeps changing. We don’t have to tell you that. COVID-19 took almost everything we knew and flipped it upside down. From March 2020, work-from-home companies saw demand surge, while travel came to a virtual standstill.
But now, as we’re coming out from the other side and consumer trends are shifting once again. What’s next for the market? How did COVID-19 affect consumer behavior? What trends should you keep tabs on as the world begins the next new normal?
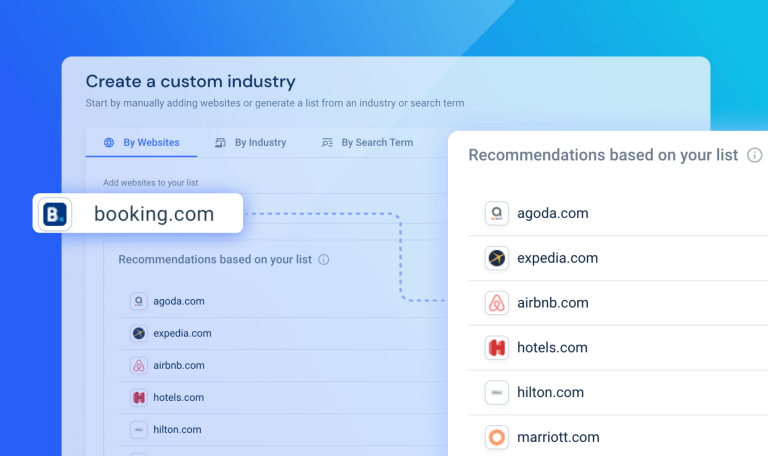
Using Similarweb’s industry-leading market research tool, we looked at emerging digital trends to investigate what we might be able to expect ahead.
Post-COVID consumer trends to watch
Mobile vs. desktop
In 2020, we saw worldwide lockdowns and a two percentage point (ppt) shift in traffic share from mobile web browsing to desktop. With the vaccine rollout in 2021, the mobile vs. desktop picture is changing once again. So far in 2021, we’re seeing a two ppt increase in mobile web browsing in the U.S. based on Similarweb’s index ranking the overall top 100 websites in the U.S.
This is significant because the change in traffic share represents a 21.4% increase in the volume of mobile web visits (111.8 billion to 135.8 billion), compared to a 16.4% increase for the category as a whole and a 12.4% increase for desktop visits.
Job classifieds and career sites surprise
COVID transformed the job market. Unemployment skyrocketed over 10% in the U.S. in August 2020. People began working from home in industries where that seemed unimaginable, including banking, insurance, and even government services. Today the employment landscape is changing again and in some surprising ways.
We analyzed five top job listing websites to investigate how the trends from January to May 2020 compare to the same period in 2021. Looking at indeed.com, glassdoor.com, ziprecruiter.com, careerbuilder.com, and usajobs.gov, the data shows that monthly traffic is climbing with average monthly visits to the job classifieds category up by 20.2% year-over-year (YoY), after experiencing a decrease of -17.5% from 2019 to 2020.
If we use both Indeed’s and Zip Recruiter’s separate URLs for employers and employees as a proxy for job supply vs. demand, we see that weekly desktop traffic is finally beginning to uptrend, YoY. However, it is clear that employers are returning to job sites at a faster rate than employees.
We’ve observed that while job employer traffic has had positive YoY growth since the first week in January, it hit its most recent peak the second week of April at +299.1%. As of the first week in April, job employer traffic finally netted a positive percentage growth YoY and has positively been since (with the hope that it will remain this way).
If we look at linkedin.com, we can see that it has operated more so as an outlier, likely because it does not solely function as a career listing site but also as a social network. Therefore it’s hard to equate job search strategy specifically to LinkedIn. We do know that the pandemic has increased monthly traffic overall to LinkedIn as businesses moved online.
Traffic has held relatively steady throughout the pandemic, but we can also observe annual growth. January–May YoY comparisons show that traffic to linkedin.com was up 29.1%.
Across the Atlantic, in the U.K., on a category level, the top five job listing sites analyzed, according to May monthly traffic, were indeed.com, totaljobs.com, reed.co.uk, cv-library.co.uk, and glassdoor.co.uk.
If we use January–May as a comparative baseline for 2020 and 2021, average monthly visits to the category increased by an even more significant percentage than was seen in the U.S. at +97.5% YoY.

Mobile-first eCommerce continues to accelerate
One of the biggest consumer behavior shifts resulting from COVID-19 was the move to online shopping. If we use January–May timeframe as a comparative baseline for 2020 and 2021, average monthly visits to the top 100 eCommerce sites in the U.S. increased by 12% YoY.
Looking at a category breakdown, the one that saw the most significant growth was home & garden, increasing in volume by 21.4% YoY. This is further exemplified as the number one fastest-growing ecommerce site out of the top 100 was americanfreight.com at +634.3% YoY. With COVID-19 lockdowns forcing people to stay indoors, do-it-yourself home improvement, decor, and gardening projects became top priorities. The continued growth into 2021, reveals that this focus is sticking even as people around the world begin to return to a new normal.
Time to travel again? Metasearch engine trends
The travel industry was hit exceptionally hard during the pandemic. However, since then, the industry has made a recovery.
On a category level, the top five online travel agency (OTA) and metasearch sites based on May 2021 monthly traffic were tripadvisor.com, expedia.com, booking.com, priceline.com, and kayak.com. These sites saw a 24.3% rise in average monthly traffic YoY (using January–May as a comparative baseline).
Not surprisingly, the most significant dip in traffic occurred at the start of the pandemic dropping by a significant 117.7% between March and April 2020, from 161.7 million to 74.3 million. May 2021 traffic is now sitting at 302.5 million, which is higher than pre-pandemic levels (January 2020 sat at 268.6 million and February 2020 at 248 million). After a year at home, people are eager to get out and travel, and the sites are showing it.
Looking at the data, we can see that the week beginning March 10, 2021, was the first time that weekly traffic saw positive YoY growth, which was maintained through April. Specifically, YoY weekly traffic peaked the week of Easter, surging +251%.
Not only are people browsing OTA sites, but they are also converting into customers, with U.S. bookings hitting 17.01 million this past May, higher than pre-pandemic levels of 16.591 million in January 2020 and 16.506 million in February 2020.
The majority of people this past month are still booking domestic travel, with the U.S. accounting for 93.7% of U.S. bookings, followed by Mexico at 0.8%, Canada at 0.5%, Puerto Rico at 0.3%, the United Kingdom at 0.3%, and Italy at 0.3%.
Another interesting consumer behavior change post-COVID trend is that we see more searches for specific cities (e.g., “Los Angeles,” “Philadelphia,” and “Seattle“) than in previous months, which is a clear sign for urban reinvigoration. Although consumers shied away from crowded areas during most of the pandemic, the tide has changed because of vaccinations and loosened mask restrictions. Today cities are attractive travel destinations for many.
Overseas travel is also starting to bounce back. In the U.K., bookings hit 2.782 million this past May, and while not higher than pre-pandemic levels, it is higher than any month YTD and 670.6% higher than May 2020.
The ticketing industry shows signs of a strong comeback
Cultural events are another category that took a major hit as the pandemic struck but are slowly starting to turn around now. According to May monthly traffic, the top five e-ticketing sites analyzed on a category level were eventbrite.com, ticketmaster.com, vividseats.com, stubhub.com, and livenation.com.
While web traffic to these sites is falling -29.4% YoY, looking month-over-month (MoM), we are starting to see signs of recovery. Beginning in January 2021, traffic is growing each month, peaking in May 2021 at +44.9% MoM. Looking at each site, livenation.com led for traffic growth, surging +143.6% MoM from April to May 2021.
Check out our latest blog on ticketing websites and their comeback provides some interesting insights into post-COVID consumer trends in the industry.
In terms of keywords, the top trending keywords on livenation.com in May were location-specific. They included jiffy lube live, pnc banks art center, blossom music center, ascend amphitheater, and Hollywood casino amphitheater.
We’ve all missed going to the movies, so it’s no surprise that traffic to movie theatre ticketing sites has also been growing MoM since the start of the year. In fact, three of the top sites have hit their highest volumes since pre-pandemic levels this past April:
- amctheatres.com sat 11.0 million
- fandango.com sat at 9.7 million
- cinemark.com sat at 8.1 million
Collectively, all three sites were 40% higher in April than March, which was 80.4% higher than in February. As of May, traffic has been slightly down-trending but is still higher than any month before April. It looks like movie theatres are on their way to a comeback.
New year, new resolution: Traffic soars to in-person fitness sites
With gyms reopening, people are returning to in-person classes. Looking at the numbers, we can see that classpass.com, a popular site used for booking in-person fitness classes, recently hit its highest level of traffic since before the pandemic at 784.7 thousand in May. This is 113.4% higher than where traffic sat in May 2020 at 367.6 thousand.
People are also increasingly searching for information on when gyms are opening and what options are located in their area. Keywords “gym openings” and “gyms near me” as well as related keywords and phrases hit their highest volume over the past 12 months in May at 1.854 million searches, up 31.5% from April.
Even as websites catering to in-person fitness see traffic climb, websites for at-home workouts continue to rise. See the top ten fitness brands.
Restaurant reservation sites make a comeback
Restaurants and dining out are another luxury we had to say goodbye to during the peak of the pandemic. While deliveries reached new heights, booking reservations suddenly became a thing of the past. We’re seeing this field come back to life now as people are starting to get out.
Both resy.com and opentable.com, go-to sites used for booking dining reservations, have recently hit their highest traffic levels since before the pandemic at 2.6 million and 9.5 million in May, respectively. For resy.com, this was a whopping 2,015% higher than where traffic sat in May 2020 at 123.4 thousand. For opentable.com, this was 568% higher than where traffic sat in May 2020 at 1.4 million.
Track digital data and follow post-COVID consumer trends
Bouncing back from a pandemic isn’t exactly an everyday event. It can be complicated navigating the new waters of a world in recovery. Knowing what to expect from a truly post-COVID is not always clear. With Similarweb’s digital intelligence, you can track digital trends as they unfold in near real-time. By monitoring what your customers are doing online today on your website and in your space, you can stay ahead of the curve and adjust your strategy to meet their needs.

Related Posts


How to Conduct a Social Media Competitor Analysis: 5 Quick Steps


Get ahead of game-changing consumer trends
Contact us to set up a call with a market research specialist