


Digital Scorecards: Understand Your Data in Context

There’s no such thing as too much data for businesses online today.
From online shopping and digital news consumption to our daily workouts, Zoom meetings, and grocery deliveries – we live on the internet.
And with all that time spent online comes invaluable website data and analytics. Information that can help you understand potential risks and opportunities, improve customer retention, and stay a step ahead of the competition.
But if you don’t know how to use that data effectively, it’ll be system overload.
In this article, we’ll share a simple, yet productive method to get more out of your market research and web traffic data: digital scorecards. You also get 9 different digital scorecard templates for different research needs to create your own stack of comparison charts.
What is a digital scorecard?
Digital scorecards provide structure for your data analysis. Usually set up as templates or graphs to compare performance over time or vs. competitors, these scorecards help you make sense of all your data. This allows you to easily track your industry in real-time and stay in the know about who’s winning your market.
When you want to evaluate a specific aspect of your business, you select the representative metrics and record your values. You then pick competitors to benchmark against and add their values for the same metrics. For example, overall conversion rate, organic vs. paid traffic, bounce rate, etc.
Selecting the relevant metrics is a one-time activity. From there on, all you need is to fill in the scores.
Placing relevant data in a digital scorecard gives you a clear picture of where each competitor stands and allows you to spot strong and weak points on the fly. No need to jump around between excel sheets, filtering, and pivoting data.

Data analysis simplified
Let’s look at some different scenarios during which a scorecard would be your ticket to success.
You want to increase traffic to your site after noticing you’re falling behind some of your main competitors. You’d first assess the current situation, paying special attention to where you are less successful than others and where the competition is toughest. With a digital scorecard, you can divide and conquer across different website metrics. After separating marketing channel performance down to a granular level, you notice that two of your competitors have started partnering with a new affiliate, and with incredible results.
Or let’s say you notice a specific behavioral pattern during a routine audience analysis. For example, the average visit duration in the winter months is higher than in the summer and there’s also a variance in device use. Is this normal? Do other sites in this industry experience the same fluctuations? Tracking the industry average on a scorecard is an easy way to find out. Come up with different hypotheses, start collecting the data, and see for yourself if you were right.
Take a look at how the eCommerce industry has changed over time throughout the pandemic:
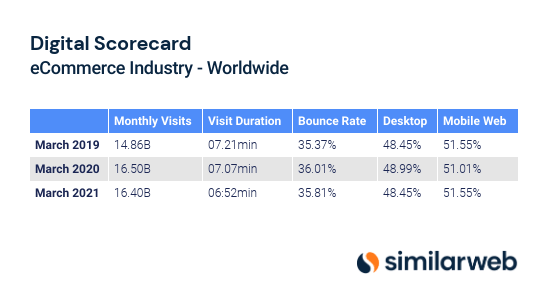
From this scorecard, we can draw three conclusions about the eCommerce industry:
- Industry increased by 10% based on pre-pandemic levels (2021 vs. 2019 data)
- Desktop vs. mobile split is back to pre-pandemic levels, although there was only a slight variation of consumer behavior in 2020
- Visit duration has decreased by almost 30 seconds as people spend less time online as the world starts to recover from lockdowns
The bonus benefit: Keeping a scorecard of metrics your management team or executives consider critical, means you don’t need to dig around for historical data when you need to pitch a new idea. You simply pull out your scorecard and present them with a complete picture of how the company is doing relative to the market.
9 digital scorecard templates to get started
In general, you can set up your digital scorecards any way you like. Which metrics you chose depends on what you intend to achieve. With the Similarweb scorecard templates, you’ll find some common combinations that provide context for your website performance, engagement rate, and general competitiveness over time. Download our template bundle to follow along.
Traffic and engagement scorecard
It’s not enough to just measure the amount of traffic you receive. That would be strictly quantitative, and although there are benefits to this type of analysis, it won’t help you figure out what you’re doing better than others. A digital scorecard can help add some quality measurements into the mix.
The first metrics to add are unique visitors, bounce rate, session duration, and page views to see if visitors are enjoying time spent on your site. On Similarweb’s platform, we automate digital scorecards. Digital scorecards are essentially built into each view and key information is aggregated to save you even more time. You can see below a breakdown of engagement and traffic metrics for three competitors. The winners for each metric are labeled with trophies.
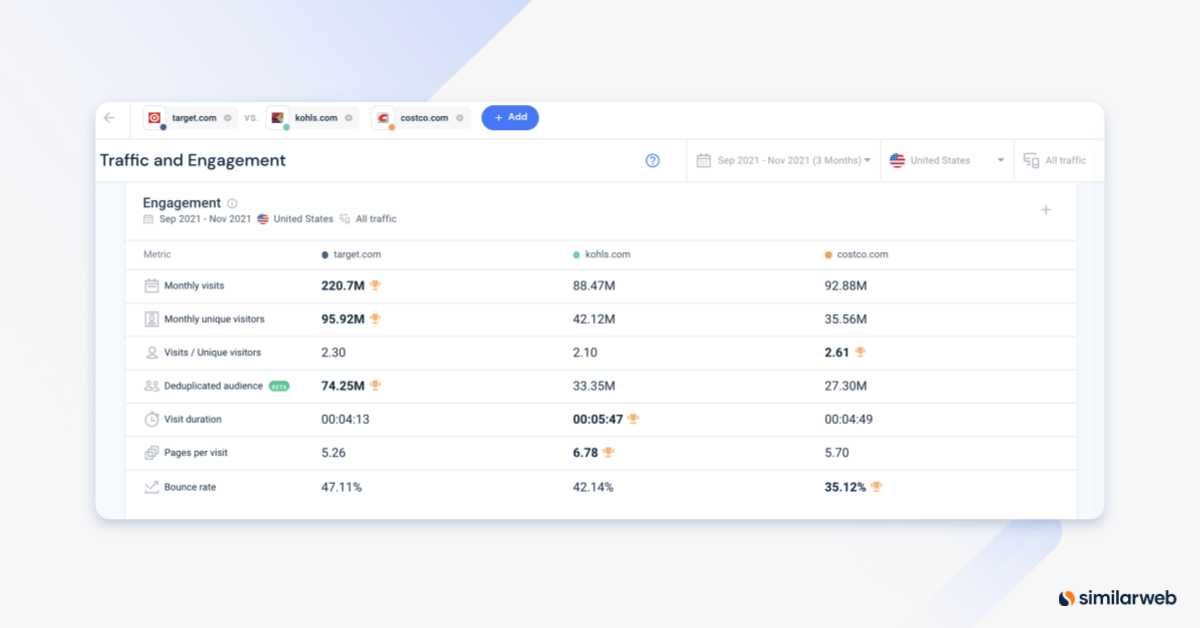
Similarweb Website Analytics shows traffic and engagement metrics comparatively over time for four top retail sites.
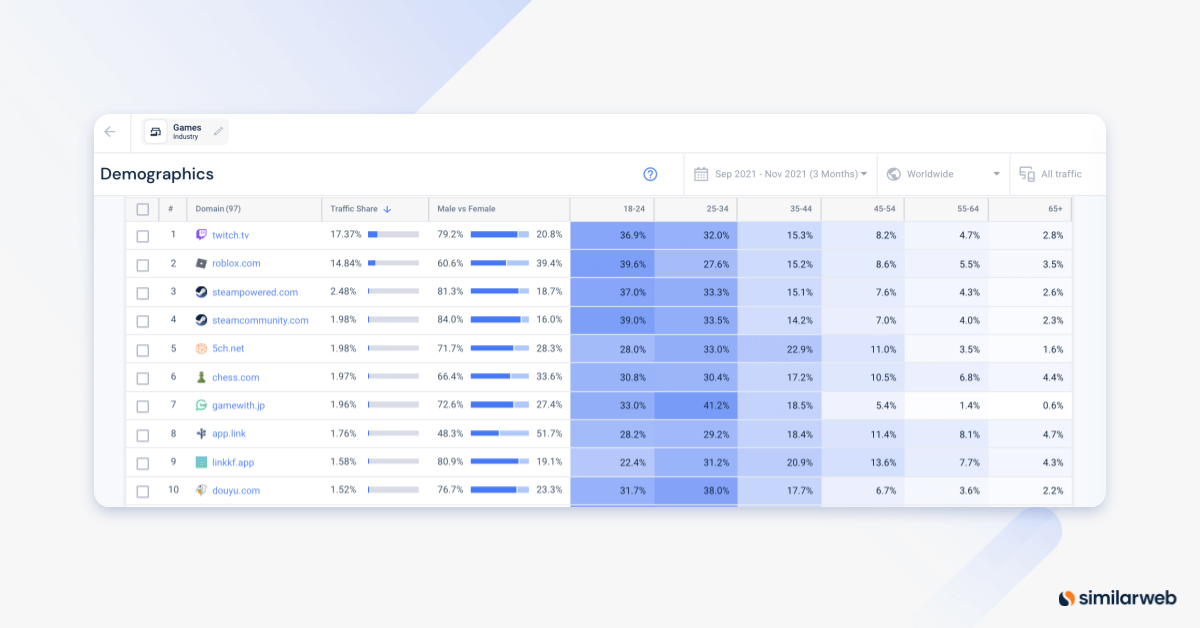
Audience scorecard
Naturally, every company aims to attract the audience that is most likely to purchase their goods or services. A digital scorecard can help you assess how well your current customers match the ideal, and track your progress while attempting to attract new audiences online.
Besides demographic data, you might want to investigate how that audience behaves and weigh in a few engagement metrics. You may discover that you are attracting the right audience, but they spend significantly less time on your site than others in the industry.
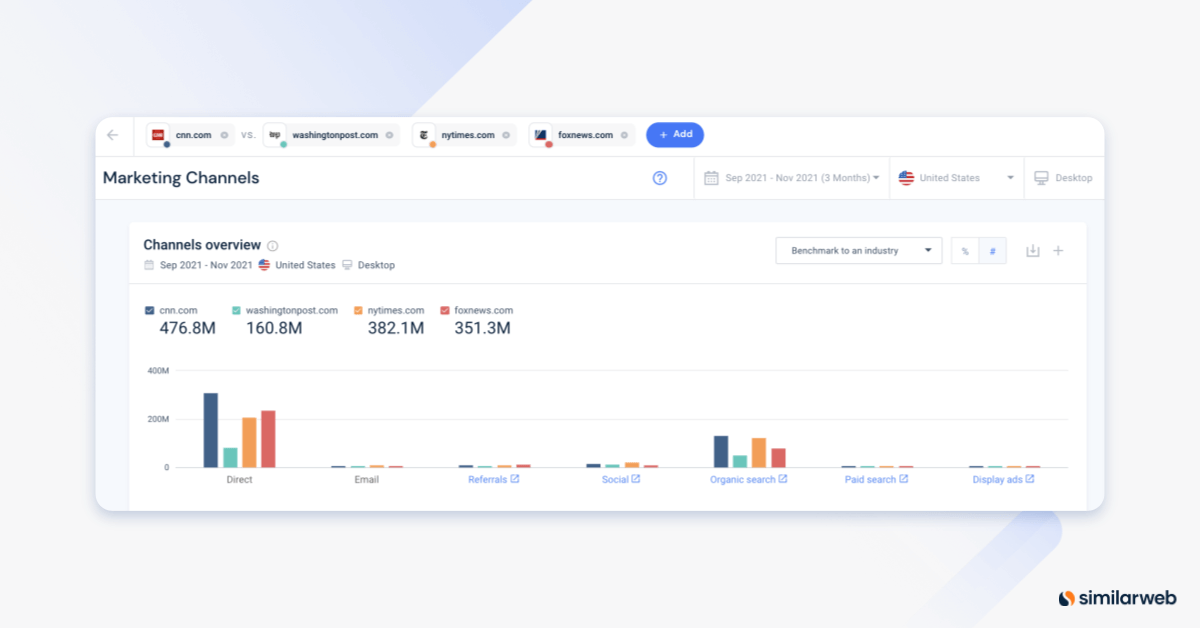
Marketing channels scorecard
If you find with the traffic scorecard your numbers are lower than the average the marketing channel scorecard is your next step. Set all your marketing channels against each other and jot down the related data. Even if you don’t currently employ every type of channel, add it to the list. You’ll want to see if this affects your performance at all.
Next, enter competitors’ data and receive an accurate overview of marketing channel performances in your target market.
You can immediately discern who’s strong where, if businesses are neglecting certain channels, or if the entire industry relies predominantly on one. You can then adjust your ad spent accordingly.
Track trends over time
Staying in the know about how you measure up is critical in the long run.
That’s why the scorecards built into the Similarweb platform include month-over-month (MoM) and year-over-year (YoY) growth to ensure that changes over time and seasonal performance are included in your analysis. If you are using a template you can also track changes over time with your own website.
Your turn! Get efficient with your data
With the right digital scorecard, you can reshape your data monitoring, stay focused on what’s relevant, and provide much needed context about your performance online.
Looking for data to crunch? Similarweb has everything you need and more. Get industry averages, compare similar businesses and see global rankings. Try it for yourself for free.

Related Posts


How to Conduct a Social Media Competitor Analysis: 5 Quick Steps


Get ahead of game-changing consumer trends
Contact us to set up a call with a market research specialist