Website Metrics that Matter: Benchmarking Your Performance

Benchmarking is as old as a commercial business. Website metrics and data analysis on the other hand are relatively new. Whether you are benchmarking the performance of small businesses or industry giants, you can use website metrics to evaluate your chances of success, by understanding the market.
Combining your competitors’ website metrics with your competitive benchmarking takes you into a new dimension. You’ll be able to gauge your marketing channels’ performance or your campaign results per traffic source against your competitors.
In this article, we’ll show you how using website metrics to benchmark your performance against competitors can benefit your business. Learn which website traffic and engagement metrics to benchmark and why each metric matters.
Why do website metrics matter?
Benchmarking website metrics opens a back door to your competitors’ hidden gardens: effective digital marketing strategies and online successes. Look at the numbers that matter, rather than relying on figures that competing companies publish. Think about the intel your web page metrics provide and how you use it. Now imagine how much more valuable the information becomes when you compare your data to the industry average or the best-in-class.
You get the idea. Now the big question is: Which of the dozens of website metrics should you track? That’s exactly what we’re here to tell you.
For one, it depends on what you’re selling and who you’re targeting, and secondly, it depends on your category. In the lists of benchmarks below, you’ll find averages for key industries online, namely Shopping & eCommerce, Media & Publishers, B2B websites, and Financial Services.
We provide you with an overview of the metrics that matter most and explain how to use them. For detailed guidelines, check out our guide on The Why and How of Competitive Benchmarking.

Basic website metrics and what they tell you
To analyze your website’s performance, you should regularly monitor tons of metrics. For your benchmarking strategy, you need to choose metrics that provide you with information that helps you understand where your competition is successful and how they reach these achievements.
Below are a list of key questions to ask and the metrics that provide answers.
1. How much traffic do sites generate?
Website metrics to benchmark:
- Number of visitors
- Pageviews
- Monthly visits
- New visitors
- Returning visitor
Reviewing the number of visitors gives you a rough indication of how much traffic sites attract. To get more applicable insights, add data such as pageviews and the average monthly number of people visiting your site and see how they relate. Read this article about Pageviews and learn how to best leverage these metrics.
Check the industry averages to assess how your stats fit in. The variations per industry and business type are enormous. For example, tracking sites receive a huge amount of one-time visitors, which is not bad for them. Most other business types hope for their visitors to return for more. You should therefore compare the numbers of new vs. returning visitors with those of your industry peers.
For example, an affiliate blogger should not strive to reach the same number of visitors as an eCommerce site or a music streaming app. This underlines the importance of viewing your stats in the right context.
If you are a start-up company or an emerging site, you should also benchmark growth using these metrics. Monitor the numbers over time and compare them incrementally.

2. How do visitors access sites?
Website metrics to benchmark:
- Desktop visitors
- Mobile Web visitors
- Mobile App visitors
It’s a popular topic. Mobile-first design remains one of the hottest issues for web designers, builders, and SEOs. Everybody agrees that non-mobile-friendly sites lose visitors. However, few people know the actual numbers.
The breakdown of desktop vs. mobile users can have implications on the features and functions you offer. Benchmarking the numbers can point you in the right direction when optimizing your site. If you consider developing an app, benchmarking mobile app visitors can help you reach a decision based on the prevalence of apps in your business area and the percentage of visitors they receive.
After you review the industry average, dig deeper into your niche. Analyze companies that are similar in size and operational scope to make sure you get a good indicator.
3. Where do visitors come from?
There are scores of traffic sources that send visitors. Identify top traffic channels in your line of business to adapt your marketing strategy. We mention the main channels here. For your sector, you may want to take a closer look and dive deeper into finding the most effective marketing channels for your business.
Website metrics to benchmark:
- Direct visitors
- Social media visitors
- Organic search visitors
- Paid search visitors
- Referral visitors (affiliate marketing program)
Benchmarking the amount of traffic per source helps you identify the optimal media to reach your customers. See which marketing efforts typically work for your industry.
Pay special attention to the marketing channels that cost money – paid search and referrals (partially). Get an idea if and where it’s common to invest. How big a role does paid advertising (PPC) play in your business sector, and which type?
Again, make sure to compare to companies that are similar to yours. Start with the industry average, then filter out companies with a similar reach and revenue in your sector. Read here how to increase traffic to your site using industry benchmarks and other guaranteed tactics.
Whichever channel generates the lion’s share of traffic for comparable businesses in your industry sector, that’s where you should continue investigating and comparing. Do visitors come from social networks? Find out which social media marketing efforts are key for your success. Do organic searches generate the highest amount of traffic? Focus on SEO content optimization and research which keywords competitors use to rank on top search engines.
4. How do visitors behave?
Engagement metrics can tell you something about the quality of traffic and its value for a website. Benchmark web metrics that reveal data about navigation on-site and time spent on pages.
Website metrics to benchmark:
- Average session duration
- Pages per session
- Time on page
- Page load time
Look at the average session duration to find out how much time visitors spend on similar sites by checking the average session duration. Session duration holds valuable information if you correlate it with additional engagement metrics. For your initial benchmarking, it’s enough to get an estimate of the average session duration or visit duration. For a deeper understanding of the web metric, read our article on how to measure Average session duration and what it reveals.
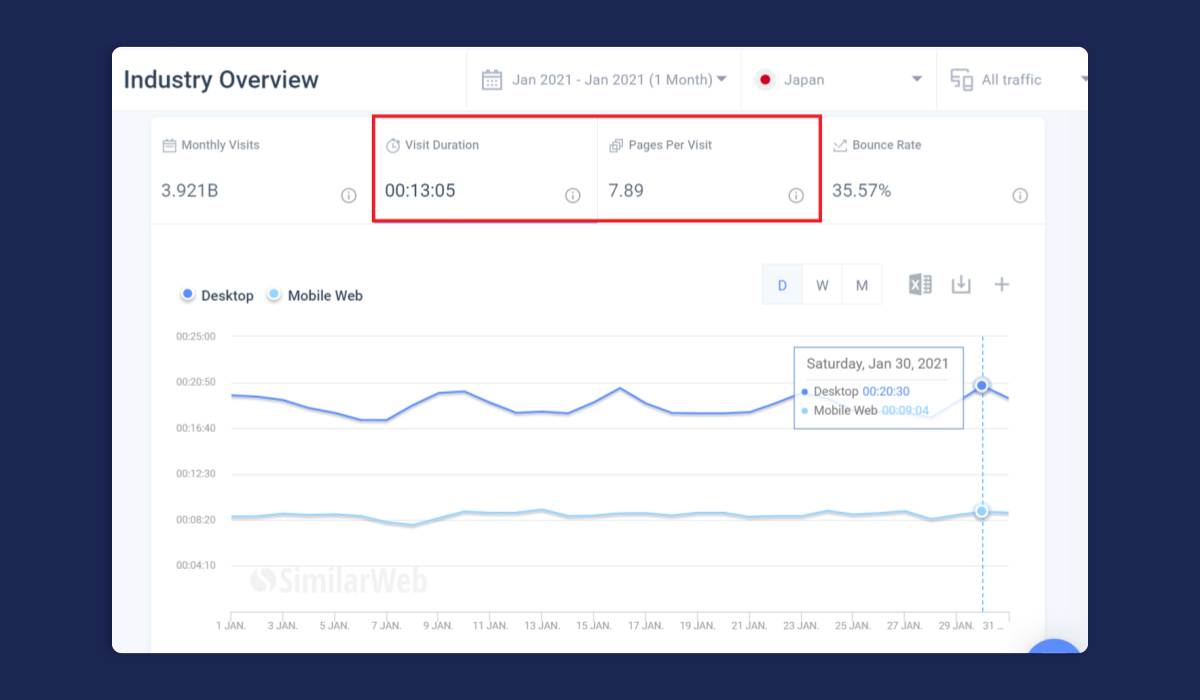
Examine the numbers of pages people access per session and how much time they spend on each page. View the average levels for your industry sector and choose similar sites in terms of size and offer. Get a feeling for the amount of content companies provide and visitors consume.
Once you know what to expect from your visitors, you’ll be able to pinpoint your site’s weaknesses and strengths. Dig deeper into your site analytics – using analysis tools such as Google Analytics, Adobe Analytics, or Similarweb – and pinpoint where you can improve. You can find more on how to get the most out of engagement rate here.
Page load time is a critical factor for streaming sites, gaming sites, and other online service providers, where pages include large graphic or voice files. Be sure you know how fast customers expect your content to load; it can be a decisive issue. For other industries, this web metric is less relevant; pages need to load instantly; otherwise, visitors run off.
5. Does the site meet expectations?
Website metric to benchmark:
- Bounce rate
Bounce rate shows the portion of visitors to your site that did not take any action and exited the site from the same landing pages they entered (also referred to as exit pages). Either the site wasn’t what they expected or they found what they came for, but there was nothing to spur their interest further.
This is probably the best example of how stats can vary depending on how and what exactly you measure. Bounce rates range from low bounce rate (10%-20%) to high bounce rate (70%-80%). Here are some average bounce rates divided by industries. The numbers demonstrate why benchmarking website metrics per industry is so significant.
Obviously, everybody aims to lower bounce rate, but before you drive yourself crazy trying to reduce it, find out what exactly “low” means for your industry.
It gets even more interesting when you look at this metric per marketing channel. In general, bounce rates from display ads are the highest, while emails produce the lowest bounce rates. As seen below, there’s also a difference between the average bounce rate for desktop vs. mobile web.
View bounce rates in relation to other metrics to learn more about how well sites meet the visitors’ expectations. Get more benchmarks and learn how to use bounce rate benchmarking as a growth tool in this article.
Conversion-related metrics and how to gain maximum insights
Business strategists and analysts love conversion rate because it’s vital for calculating ROI and customer lifetime value. For many marketers and researchers, the conversion rate is the most important metric to monitor because it shows how successful their activities are. For the same reason, you want to benchmark eCommerce metrics like conversion rates and monitor your competitors’ conversion metrics.
Comparing conversion rates also helps you identify which competitor’s funnel you want to investigate more closely to understand how high conversions are generated and if you have low conversion rates. When you look at conversion metrics in correlation with other website engagement metrics, you can gain insights about funnels. A complete conversion analysis includes benchmarking and can provide critical data for your growth strategy.
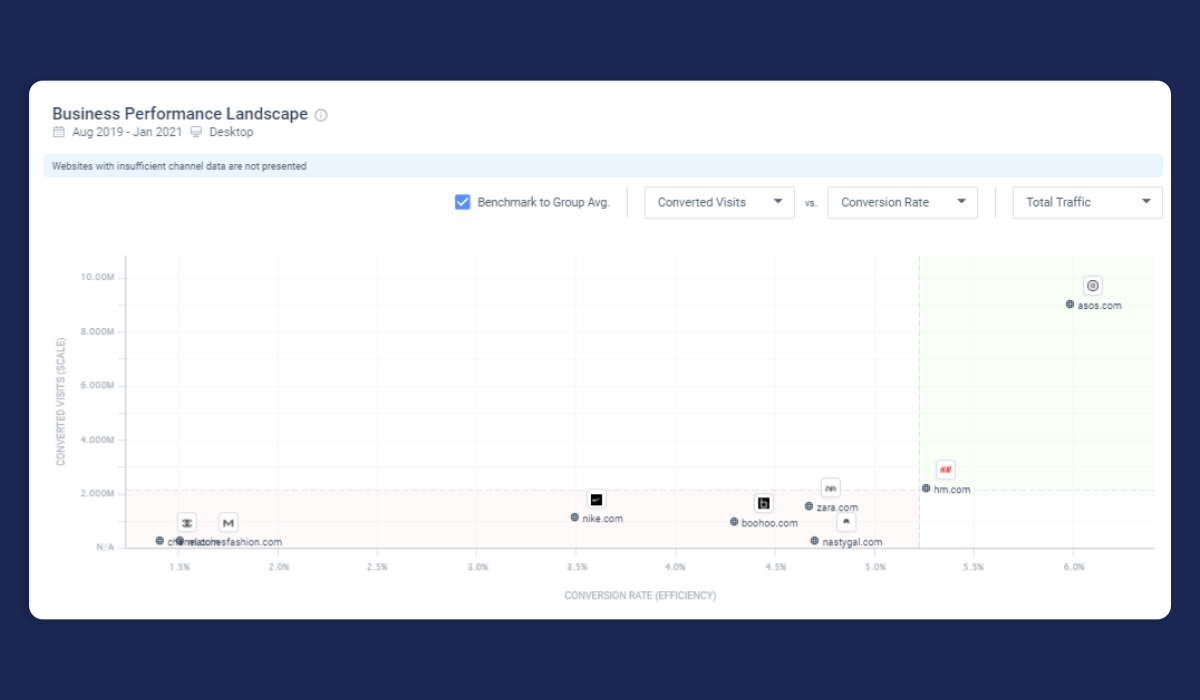
Conversion metric to benchmark:
- Converted visits
What does this metric show you? It presents the total number of visits that included completing a primary business goal of the website. To measure converted visits, you first need to define which goal or step in the funnel counts a conversion when completed.
When it comes to benchmarking conversion rates, you need to be careful. In order to get a realistic comparison, the types of conversions need to match. There’s no point in comparing demo sign-ups to actual purchases.
Let’s take a look at some common types of conversion per industry.
eCommerce and shopping websites:
- Purchases completed
- Going through the steps in the checkout funnel
- Products added to basket/cart
- Contact forms completed
- Coupon applied
See the top eCommerce and shopping websites here >>
News and media websites:
- Impressions & clicks (CTR)
- Pageviews to articles with adverts
- Clicks on adverts
- Clicks on affiliate links
- eBooks/Reports downloaded
- Clicks on videos
- Contact forms completed
- Newsletter subscribers
See the top news and media websites here >>
Business and consumer websites:
- Contact forms completed
- Free trial request
- Demo request
- Full software purchased (via the Contact Us or Plans/Subscription page)
- Newsletter subscribers
See the top business and consumer websites here >>
Finance websites:
- Contact forms completed
- Subscription completed
- ‘Thank You’ page completed
- Purchase completed
See the top finance websites here >>
Make sure you select the correct parameters for comparison. What is most representative of success in your line of business?
Sometimes web metrics can raise more questions than they answer. You may want to investigate deeper into your conversion funnel to evaluate its efficiency. Define the funnel stages and choose representative metrics for each stage or step the lead takes. This provides additional data points to compare. You can identify where in your funnel the level of dropouts is higher than average. Find out how to get started with your conversion funnel optimization.
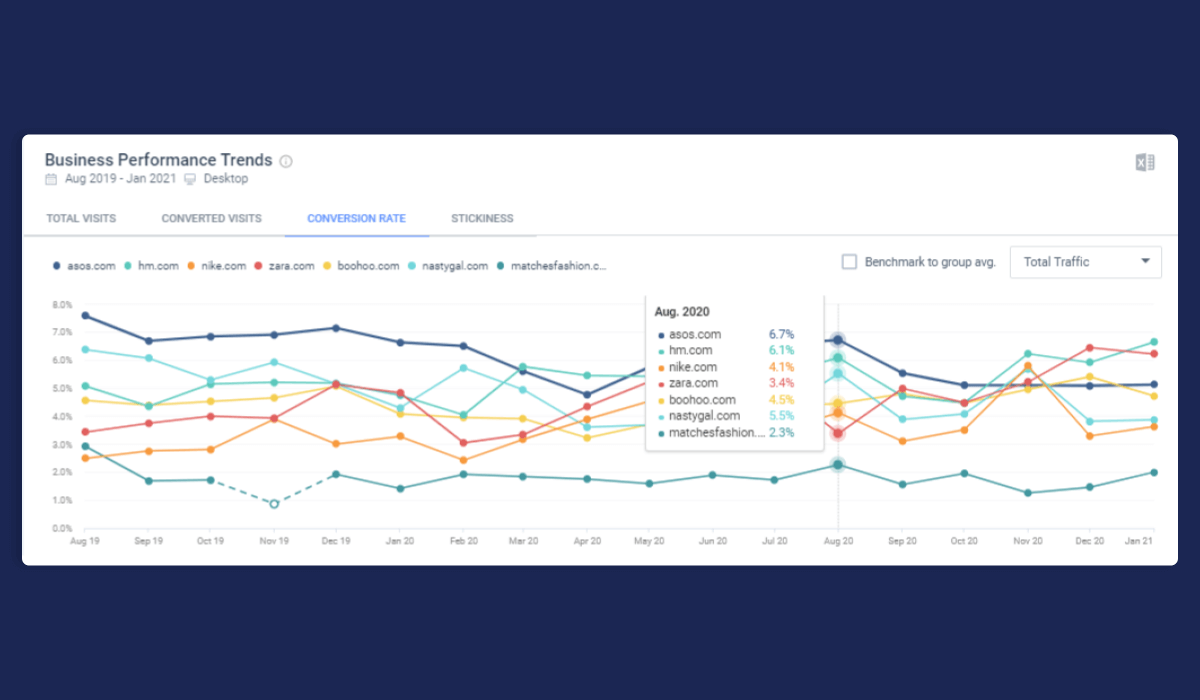
Average conversion benchmarks to get you started
Below is a graph with the average conversion rates for key industries. You can use this information to understand how you stack up against the competition.
Gauge customer acquisition and retention
Conversion metrics to benchmark:
- First-time visitor conversion rate
- Returning visitor conversion rate
Remember we looked at visitors earlier to evaluate the amount of traffic? Now you want to know the rate of conversions for the different visitors.
The ratio is highly dependable on the type of business. B2B sites can expect a low percentage of first-time visitors converting. The majority of conversions happen only after prospects have already interacted a few times and consumed a significant amount of content.
For eCommerce sites, on the other hand, it will be the opposite. Most visitors will convert on their first visit or not at all.
It’s all a question of what a conversion means for the business. Commercial sites aim to retain customers and get them to make additional purchases; in other words, convert again and again. For a publisher or service provider, a sign-up for a paid subscription is expected only once. These companies need to pay more attention to engagement metric benchmarks to see a higher first-time visitor conversion rate and analyze how customers interact with similar sites in order to gauge their returning visitor conversion rate.
Evaluate customer engagement
Engagement metrics to benchmark:
- Interactions per visit
- Stickiness or DAU/MAU
The number of interactions per visit is significant in service-providing industries and sectors, such as SaaS for B2B, e-learning, streaming sites, and some publishers and financial services. Any site that customers subscribe to should be interested in monitoring and benchmarking the level of customer interaction as an indicator for engagement.
Even for retailers and consumer goods companies, the numbers could be of some interest to see if people arrive to purchase a specific item or browse a variety of pages before making a decision. Start by looking at the industry standard and take it from there.
Stickiness is a valuable indicator of user experience and on-site usability. It tracks and measures how many days in a given month converted users are active on average. Looking at stickiness, which is the DAU/MAU ratio – Daily Active Users divided by Monthly Active Users – shows how engaged they are and how “sticky” your product is.
A “sticky” product or brand is one that “sticks with” the customer or at least in the customer’s memory and causes them to return. In the long run, it’s everyone’s goal to have loyal customers.
This metric is beneficial for large brands who aim to be their website visitors’ and customers’ first choice, regardless of the industry. However, a high stickiness index is not the number one measure of success in all industry sectors.
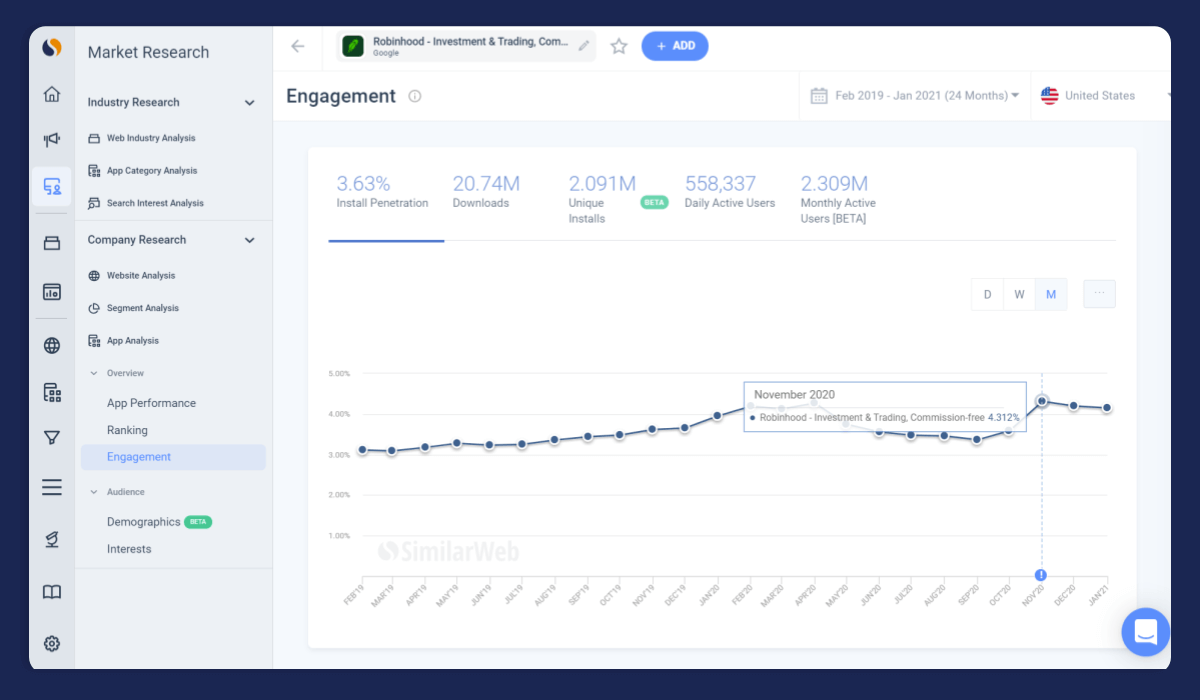
The most insightful mobile app metrics
The analyst’s most effective work starts after conversion, that is after the user downloaded the app. Usually, the underlying purpose of researching app metrics is customer retention, which is why user activity determines success. Here’s what you should ask when comparing your competition.
How active are users?
Metrics to benchmark:
- Daily active users (DAU)
- Monthly active users (MAU)
- Average app session (also referred to as average visit time)
- Stickiness or DAU/MAU
Similar to the engagement metrics for websites, the numbers of daily and monthly active users will vary per industry. Some apps are intended for everyday use, others for less frequent activity, some only occasionally. First, determine where on the scale from daily to occasional use your app is located. Then benchmark against similar apps in your industry.
The same goes for the average app session. If you are offering an e-learning app, you want users to be active at least throughout one course lesson at least. An instant translation app, on the other hand, wouldn’t require a user to spend a significant amount of time during each visit. You get the idea. See what’s common in your niche.
Stickiness is a valuable metric to look at with all apps because it directly indicates the average activity level of people who downloaded the app. The metric calculates the average number of days within the measured month on which users were active on the app. By comparing it to the industry standard, you can determine how your app measures up.
What’s your market share and reach?
Metrics to benchmark:
- App downloads
- Unique installs
- Install penetration
You may have set goals for the number of installed apps you want to reach in a set period. Are they realistic? Check the industry average and keep monitoring to make sure you’re on the right track.
Look separately at the number of unique installs, which shows how many devices have installed your app. The app downloads metric shows the number of downloads from Google Play or Apple’s App Store, which can happen multiple times to the same device.
Install penetration measures the percentage of all devices in a defined region that have installed your app. This puts the number of installs in relation to the maximum possible installs. For instance, it can display that your app was installed on 30% of all iPhones in California.
How high are ratings and rankings?
Metrics to benchmark:
Use Similarweb’s app intelligence ranking based on the app stores’ 1-5 star rating to benchmark your app’s popularity against your competition. Many potential users will decide based on the highest-ranking and positive customer reviews when there are several similar apps. A lower-than-average ranking can reflect UX/UI issues or poor graphics.
Conclusion
Benchmarking shouldn’t focus on business parameters only. It’s critical to identify key drivers for success so you can grow your business. Website metrics provide tools to map and measure your path towards success so you can repeat what works well and fix what doesn’t.
Your competition is doing the same. Rather than watching them from the outside, get into the data that reveals their processes and strategies. Use Similarweb’s research intelligence tools to get all relevant metrics for your competitors. See how you measure up to the best in class every step of the way and where you are over or underperforming. Use website performance benchmarks to decide on strategic questions and build your digital strategy.
Sign up for free to Similarweb’s analytics platform and get access to a wide range of website metrics benchmarks.

Website Metrics FAQ
Why do website metrics matter?
Website metrics allow you to look at the numbers that matter, rather than relying on figures that competing companies publish, and ultimately help your bottom line.
What are the 4 types of metrics?
Average session duration, pages per session, time on page, and page load time.
What is a good website metrics tool?
Dig deeper into your site analytics using analysis tools such as Google Analytics, Adobe Analytics, or Similarweb to pinpoint where you can improve.

Related Posts


Benchmarking Website Traffic: Complete Guide + 2025 Industry Data


Benchmark like a boss with fresh competitive data
Contact us to set up a call with a market research specialist