Historical Trend Analysis: Benchmarking to Build a Digital Strategy
If your company grew its digital market share by 10%, but the industry grew by 20% year-over-year (YoY), then how do you know if you are on track to win your market? Or vice versa, your industry fell by 10% but your company only lost 2% of market share? Are you in good shape or do you need to embrace change?
Knowing industry benchmarks can help steer your digital strategy in the right direction, keep your executive leadership team up-to-speed on market dynamics, and accelerate your digital growth.
However, gathering this information can take time and quickly becomes outdated if you aren’t continuously monitoring traffic and engagement metrics over time. That’s where a digital scorecard comes in handy. It’ll track your industry and competitive benchmarks in real time so you’re always in the know about who’s winning your market. For example, if you are only analyzing last year’s industry performance, how can you ensure you are benchmarking to pre-pandemic levels and accurately anticipate market recovery?
By looking into historical data trends, you can measure your website performance relative to industry norms. For example, what was happening in the market before COVID-19 hit. With these insights, you can build a baseline for digital performance and strengthen your decision-making process, plus analyze how the market evolves and takes shape over time.
Digital scorecards in action: How markets evolved pre and post-pandemic
Last year was off the charts. Quite literally. Industry trends were unpredictable, to say the least as COVID-19 shut down the world. And while some industries such as web conferencing, eCommerce, and news and media reaped benefits from the sudden surge of online traffic, others, such as travel and hospitality, practically nose-dived. But what do they look like now? And how does this compare to pre-pandemic levels?
Using digital scorecards of historical data, we look back at how industries have evolved over the last couple of years, to track industry performance and understand what the market looked like then and now.
Industry performance digital scorecards
Below we review leading industries such as eCommerce, Travel, Publishers and Media, Digital Job Classifieds, Online Gaming, and Financial Services, benchmarking the following metrics: average monthly visits, visit duration, bounce rate, and device distribution.
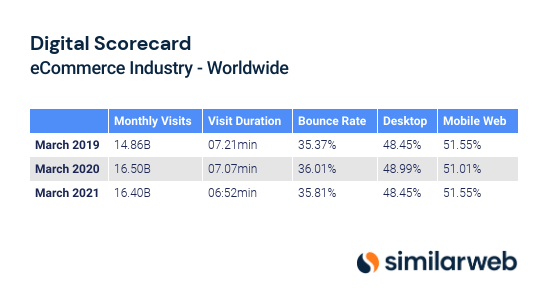
- Industry increased by 10% based on pre-pandemic levels (2021 vs. 2019 data)
- Desktop vs. mobile split is back to pre-pandemic levels, although there was only a slight variation in consumer behavior in 2020
- Visit duration has decreased by almost 30 seconds as people spend less time online as the world starts to recover from lockdowns
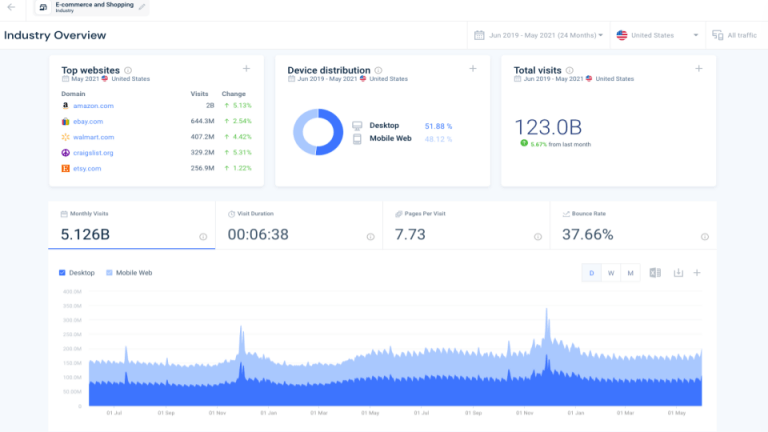
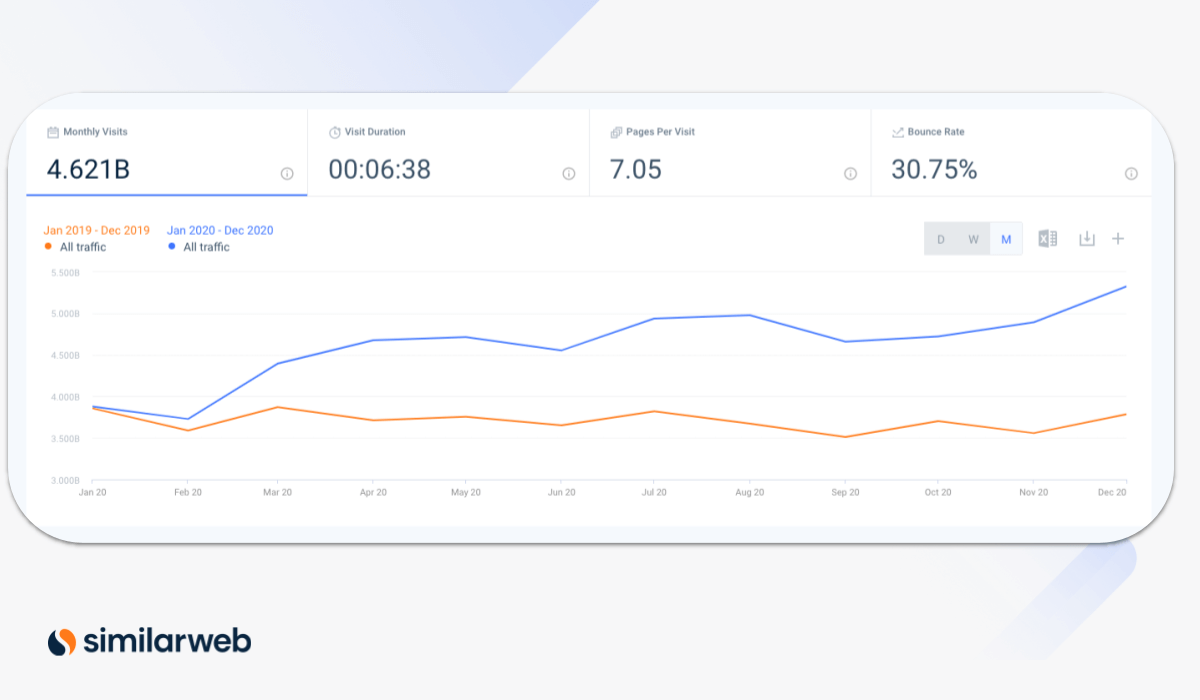
In the below chart, see the trend over time for the eCommerce industry and the enormous growth in traffic in 2020 (blue line) vs 2019 (orange line).
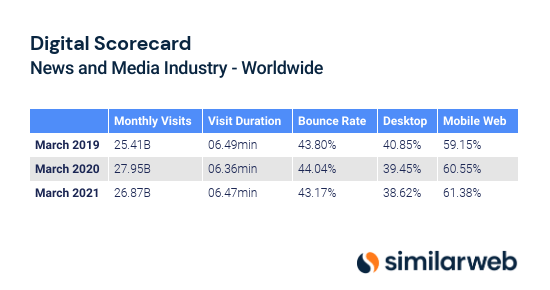
- Industry increased by 5% based on pre-pandemic levels (2021 vs. 2019 data)
- Most readers are consuming their news from mobile devices
- Dropping below 2020 monthly visits, 2021 is still performing better than 2019
- The traffic spike in 2020 can be a market fluctuation attributed to new user behavior, which has since shifted back to pre-pandemic norms
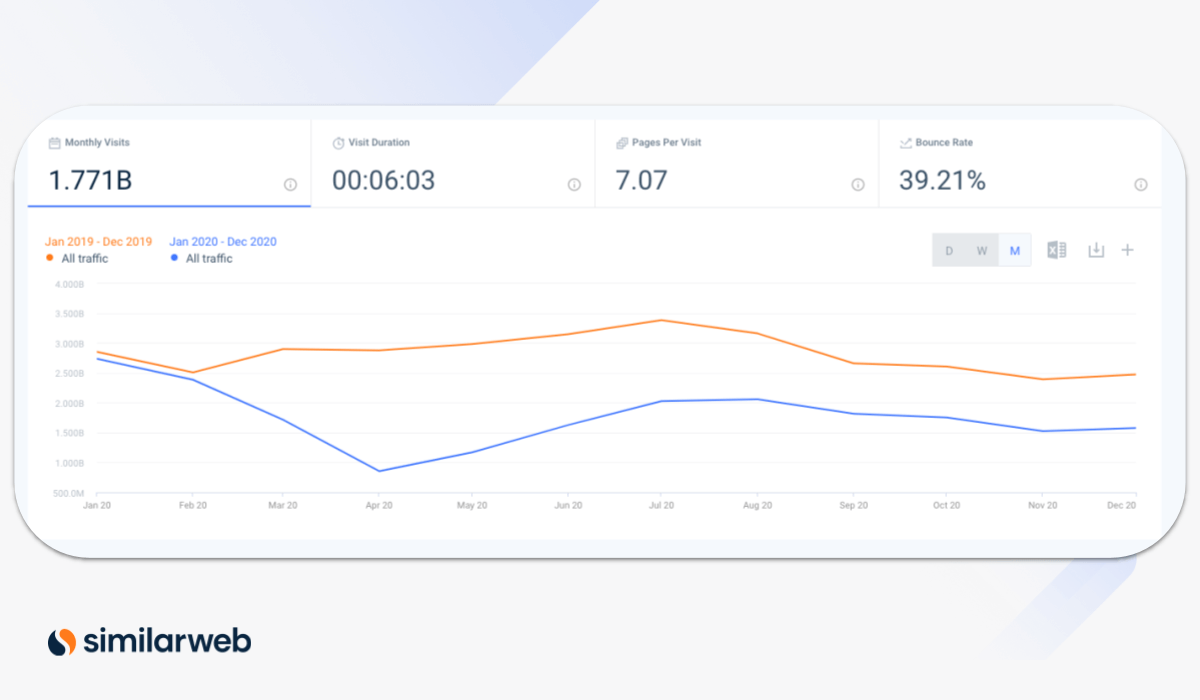
In the below chart, you can see the differences in trends in traffic of 2019 (orange line) vs 2020 (blue line) and how visits to the News and Media industry spiked around March 2020 when Covid-19 hit and the November election period in the US.
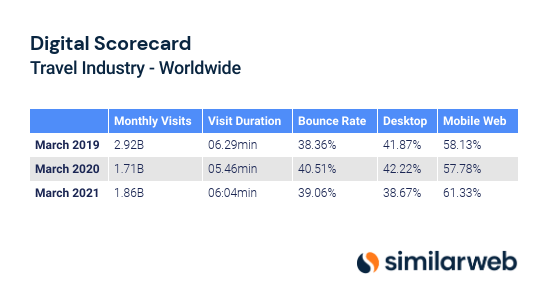
- The travel sector was hit hard by COVID-19, with the industry experiencing a 52% decrease from 2019 to 2020
- We are starting to see recovery with 8.4% growth in the industry (2020 to 2021)
- Mobile Web has slightly overtaken Desktop as consumers book trips closer to home (Desktop is more often used for longer international trip planning)
- User experience is starting to normalize – page duration increased by 18 seconds since the start of the pandemic. Bounce rates have steadily decreased as well
In the below chart, see the difference in traffic trends around Feb – March last year (blue line) as the travel industry was impacted by Covid-19 versus the trend for 2019 (orange line).
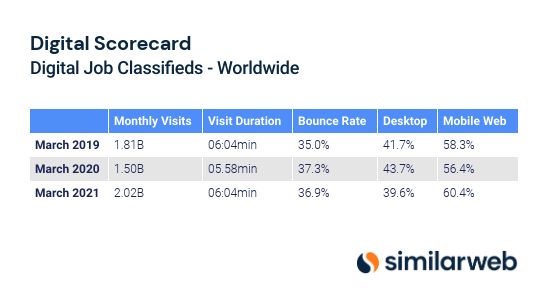
- The Digital Job Classifieds industry increased by 11% based on pre-pandemic levels (2021 vs. 2019 data)
- More and more job seekers are looking at digital classifieds via mobile
- Although people are visiting digital classifieds more often, they are spending less time online. Session duration has decreased by 27 seconds (2021 vs. 2019 data)
In the below chart, see the difference in trends to the digital job market declined from Jan – April last year (blue line) and how the industry maintained a similar trend based on 2019 traffic engagement (orange line).
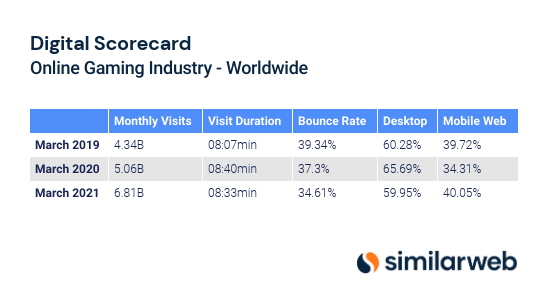
- Online Gaming grew by 44% based on pre-pandemic levels (2021 vs 2019 data)
- Desktop is still the popular choice of gamers to play online
- Users are spending more time playing games online, which means more exposure to ads. Session duration increased by 33 seconds (2020 vs. 2019) and 26 seconds (2021 vs. 2019)
- Data suggests that the growth the online gaming industry experienced during the pandemic is going to continue post-pandemic
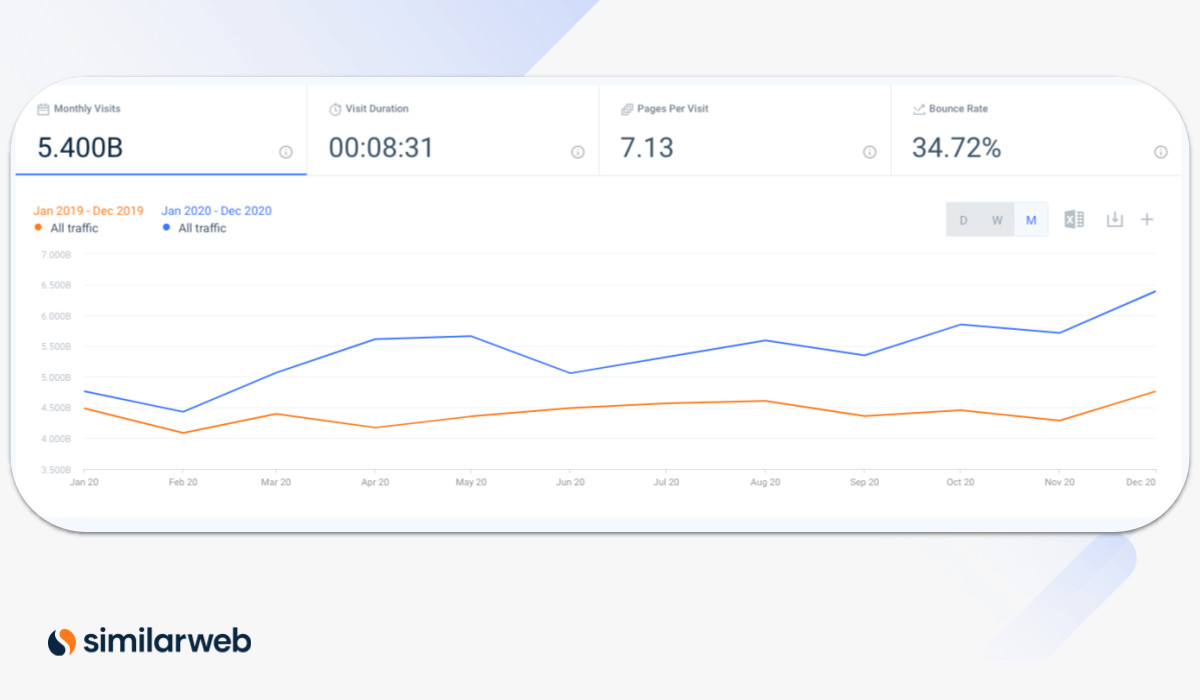
See below the trend between 2019 (orange line) vs 2020 (blue line) and how the digital gaming industry grew exponentially during the pandemic last year.
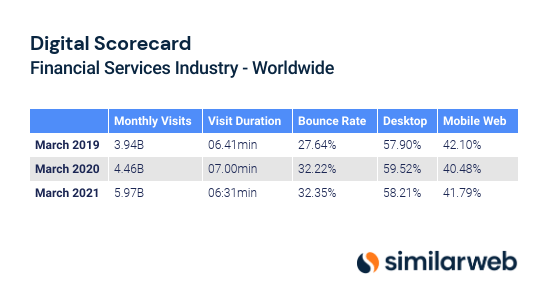
- The Financial Services industry increased by 41% based on pre-pandemic levels (2021 vs. 2019 data)
- User experience is underperforming compared to pre-pandemic levels. While visit duration is only down by 10 seconds, bounce rate is up nearly 5%
- Financial services is one of the few industries where desktop is more popular than mobile web as people worked from home and starting to see a shift back to pre-Covid norms
In the chart below, you can see how the financial services industry followed a similar trend but in 2020 (blue line) the industry increased year-on-year.
Why business leaders should track industry performance and historical trends
1. Market leadership is a marathon: Understand the growth rates of your industry and competitors over time to assess if big bets and long-term strategy are paying off
2. React faster to predict market behavior: Each season builds upon the previous, in a continuous motion – research historical patterns to forecast potential market demand
3. Keep your digital scorecard up-to-date: Benchmarking is an ongoing process which means you need to make sure your digital scorecard is always up-to-date so business leaders can make informed decisions
Stay up-to-date on fresh insights
Check out our Digital Research Insights Blog.
Track historical trends with Similarweb
Try Similarweb Digital Research today and get started with historical trend analysis to uncover the insights you need to win your market.

Related Posts


How to Conduct a Social Media Competitor Analysis: 5 Quick Steps


Benchmark like a boss with fresh competitive data
Contact us to set up a call with a market research specialist