Key Real Estate Industry Benchmarks

Despite facing many challenges over the past few years, the real estate industry is still thriving. The industry has proven its ability to adapt to technological, customer, and market shifts over time. Traditional classifieds have become digital 3D tours, open houses are now virtual walkthroughs, and apartments are rented for weeks or months at a time without any face-to-face communication.
Whatever the reason, looking at properties online has become an enjoyable pastime for many, and shows like Million Dollar Listing and Selling Sunset are now the standard for reality television.
There’s an undeniable fascination with the real estate industry and the need for digital research to develop a strong customer acquisition strategy is a must for all key players in the market.
So where do we stand now? Which trends survived the pandemic, and which will shape the future of the real estate industry?
In this article, we use real estate benchmarks from the top 100 websites worldwide to give you a better understanding of what your baseline performance should be to stay competitive.
The titans of the real estate industry
The online real estate industry is growing fast. In the last two years, total visits to real estate websites worldwide have increased 48% – nearly doubling from 1.3 billion to 2.1 billion.
Staggeringly, the top ten real estate websites worldwide account for almost half of the industry’s total traffic. In March 2022, the industry leaders received 957.3 million total visits.
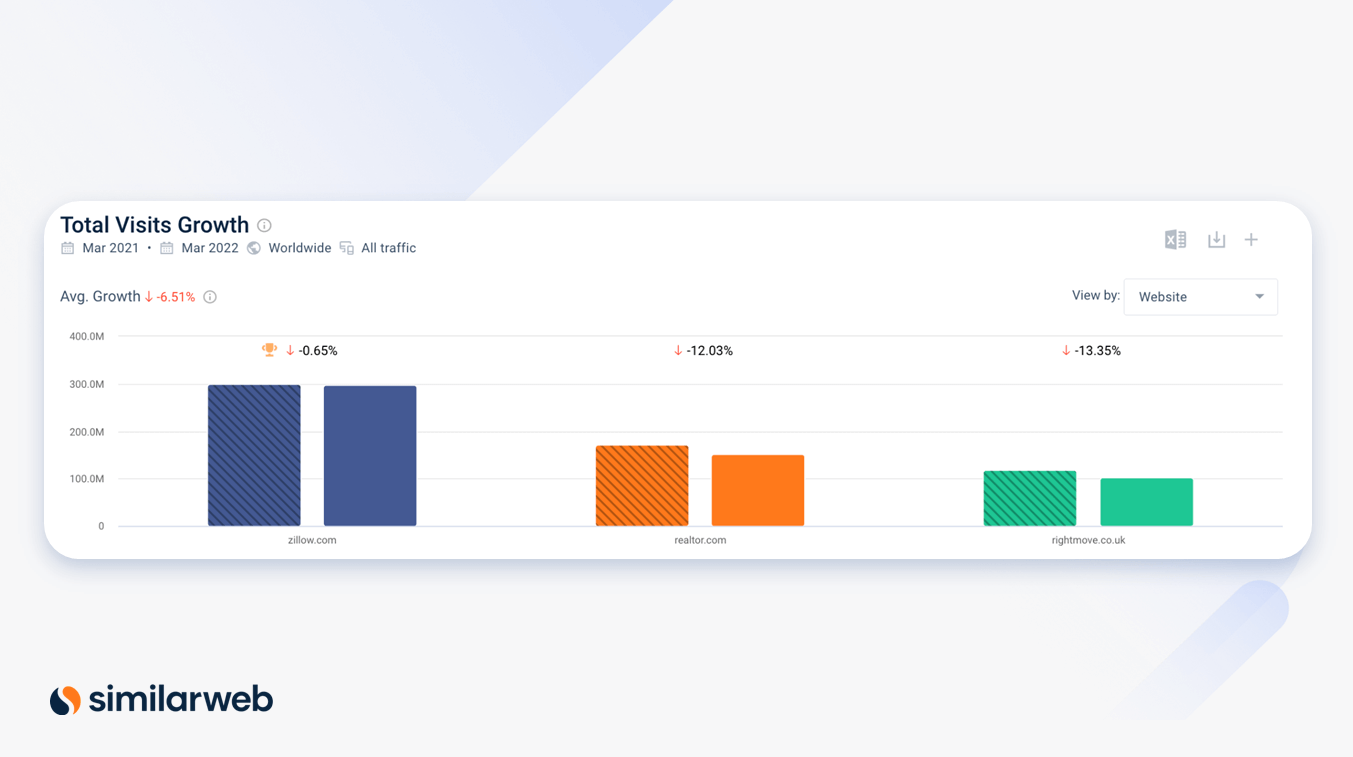
The most popular online real estate website is zillow.com, which had 298.4 million monthly visits in March 2022. For reference, its closest competitor, realtor.com, earned 151.2 million monthly visits in the same month, followed by rightmove.co.uk at 102.6 million.
However, all three of these websites have experienced a slight decline in traffic in the last year. The average growth of these websites has declined by 6.5%.
Traffic share distribution – the local community is key
Looking at the real estate industry benchmarks for traffic share gives you a pretty good idea of which websites users prefer when looking for their dream home. It can also be an important indicator of up-and-coming industry players to watch.
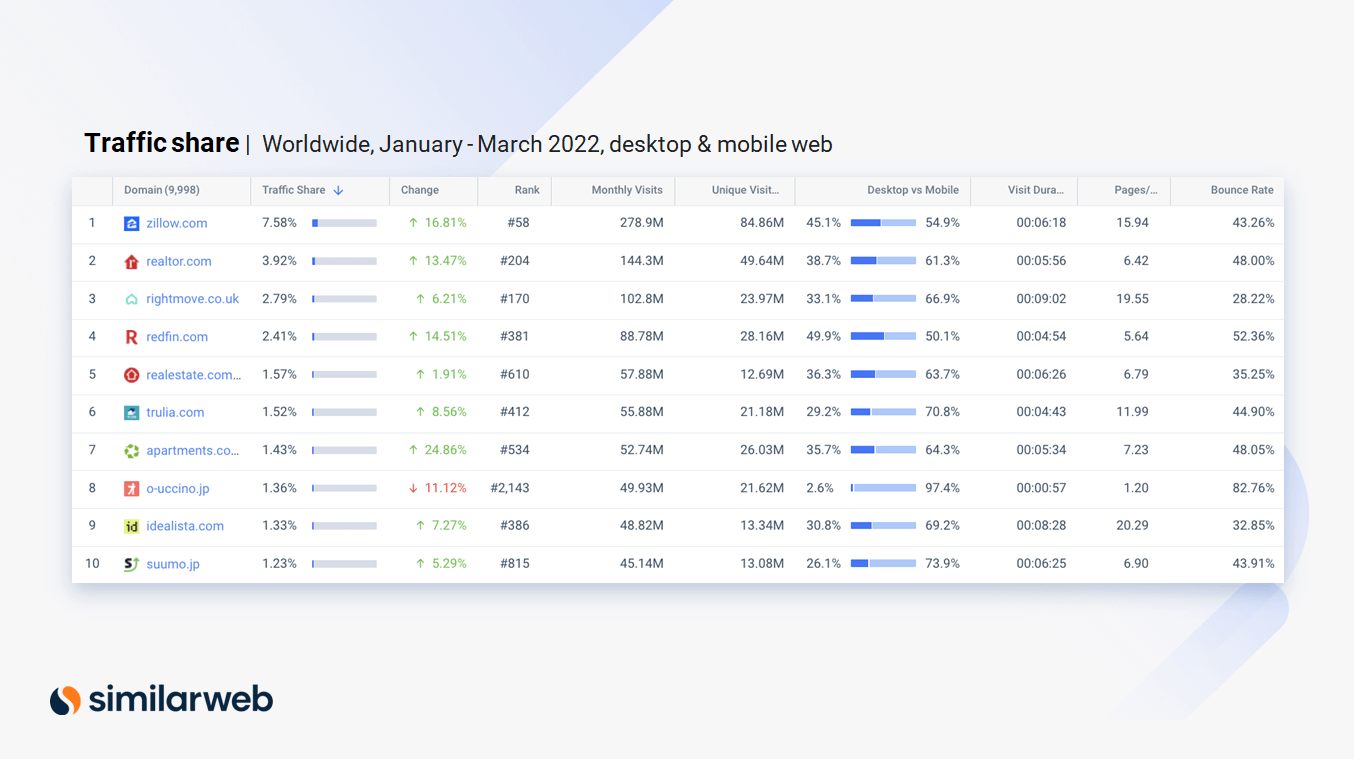
Take a look at how traffic is distributed among the top ten in the leaderboard:
There are a few country-specific domains in the top ten list. This suggests that for real estate, there’s a powerhouse leader earning most of the traffic locally without much competition. These websites are zillow.com and realtor.com in the U.S., rightmove.co.uk in the U.K., realestate.com.au in Australia, and suumo.jp and o-uccino.jp in Japan.
In the past three months, nine of the most popular real estate websites have increased their traffic share, while only one has lost ground. This suggests the industry is getting stronger and there’s an increased interest in looking for real estate online.
Visits over time – spring into action
When analyzing real estate benchmarks, engagement metrics like visits over time can give you a better understanding of how to use seasonal events to your advantage.
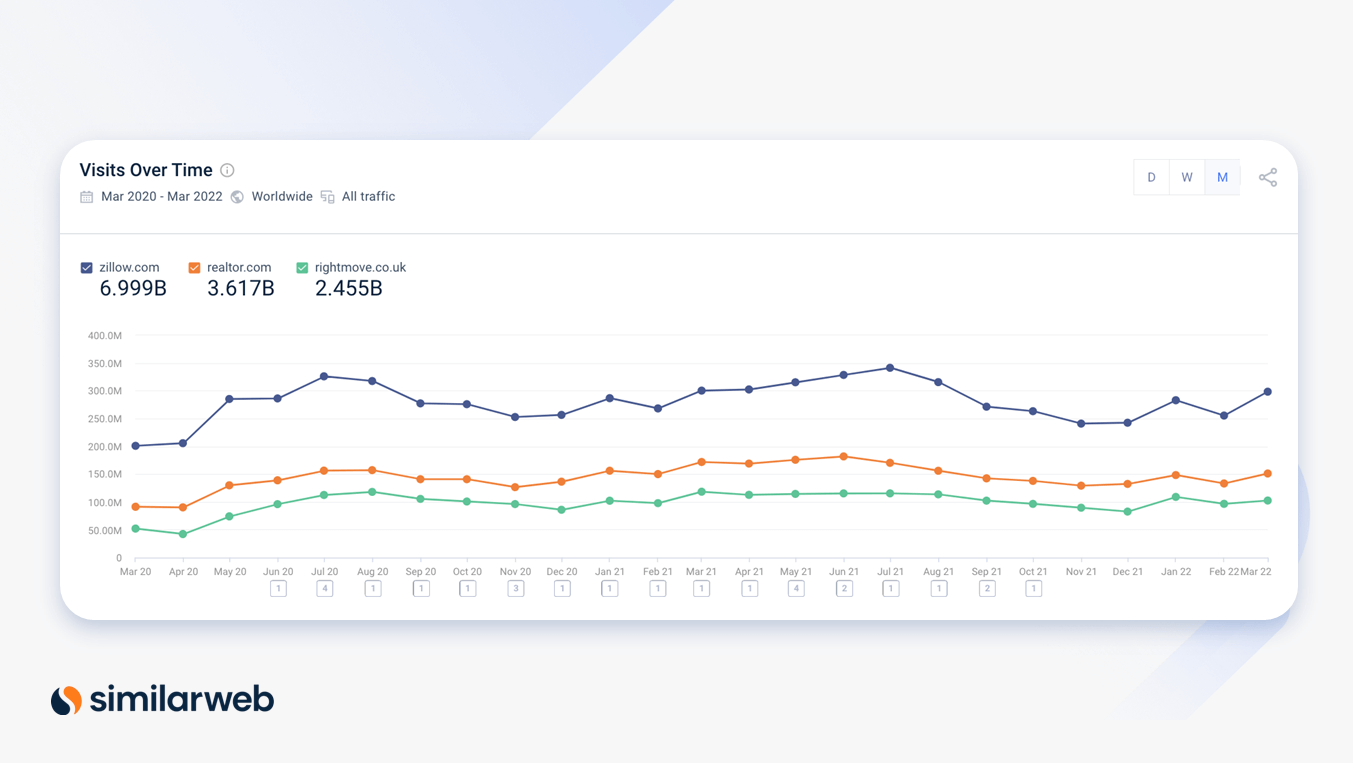
Let’s look at the competitive set zillow.com, realtor.com, and rightmove.co.uk – the top three real estate websites worldwide.
Historical data from the past two years reveals a significant increase in traffic to these sites during certain periods of the year. The increase tends to start in the spring and peak in the summer. As the winter months roll in, traffic to these sites starts to decrease.
Audience loyalty explained
In online real estate, the stickiness of your website can dictate how likely a user is to actually seek out your services or make a purchase. Website stickiness is calculated by dividing the average number of unique visitors by the average total monthly visits. This number is a good indicator of how loyal your audience is and how likely they are to come back to your site.
Top 100 websites in the category, worldwide:
- Unique visitors (745.4 million) / Total visits (2.2 billion) x 100 = 33.9%
Top 25 websites in the category, worldwide:
- Unique visitors (446.7 million) / Total visits (1.4 billion) x 100 = 31.9%
Top 10 websites in the category, worldwide:
- Unique visitors (311.2 million) / Total visits (1.0 billion) x 100 = 31.1%
On average, global real estate websites have a stickiness level above 30%. If yours is lower than this, you may need to rethink how your site functions, your user experience, or the information you present right off the bat. Try to think of new ways to draw customers in and convert them into returning visitors who keep coming back for more.
Device split – mobile is king
Benchmarking device distribution will give you insight into how your audience accesses your website. Why does this matter? It’s an important metric for optimization. Let’s say most of your traffic comes from mobile. You’d want to make sure the mobile version of your website not only offers the same experience as your desktop one but also doesn’t lag or have any bugs.
Like most industries today, we’re seeing that there’s a shift toward mobile web in real estate. Users are nearly twice as likely to access these websites from their phone than from a desktop, and we can see that on a year-over-year basis (YoY), mobile web is growing (albeit slightly), while desktop is losing traction.
Top 10 websites in the category:
- Desktop – 37.9% in 2022 (vs. 38.4% in 2021)
- Mobile Web – 62.1% in 2022 (vs. 61.6% in 2021)
Top 100 websites in the category:
- Desktop –36.5% in 2022 (vs. 37.0% in 2021)
- Mobile Web –63.5% in 2022 (vs. 63.0% in 2021)
Where to hold your open house
Determining which marketing channels are bringing the most traffic to your website is one of the most important steps of market research. Because there are so many ways a user can end up on your site, it’s important to understand which channels are the most successful so you can focus your marketing budget and efforts accordingly.
Benchmarking your marketing channel performance against your main competitors (or the whole industry) will help you better identify top-performing channels and narrow down where you may want to implement changes.
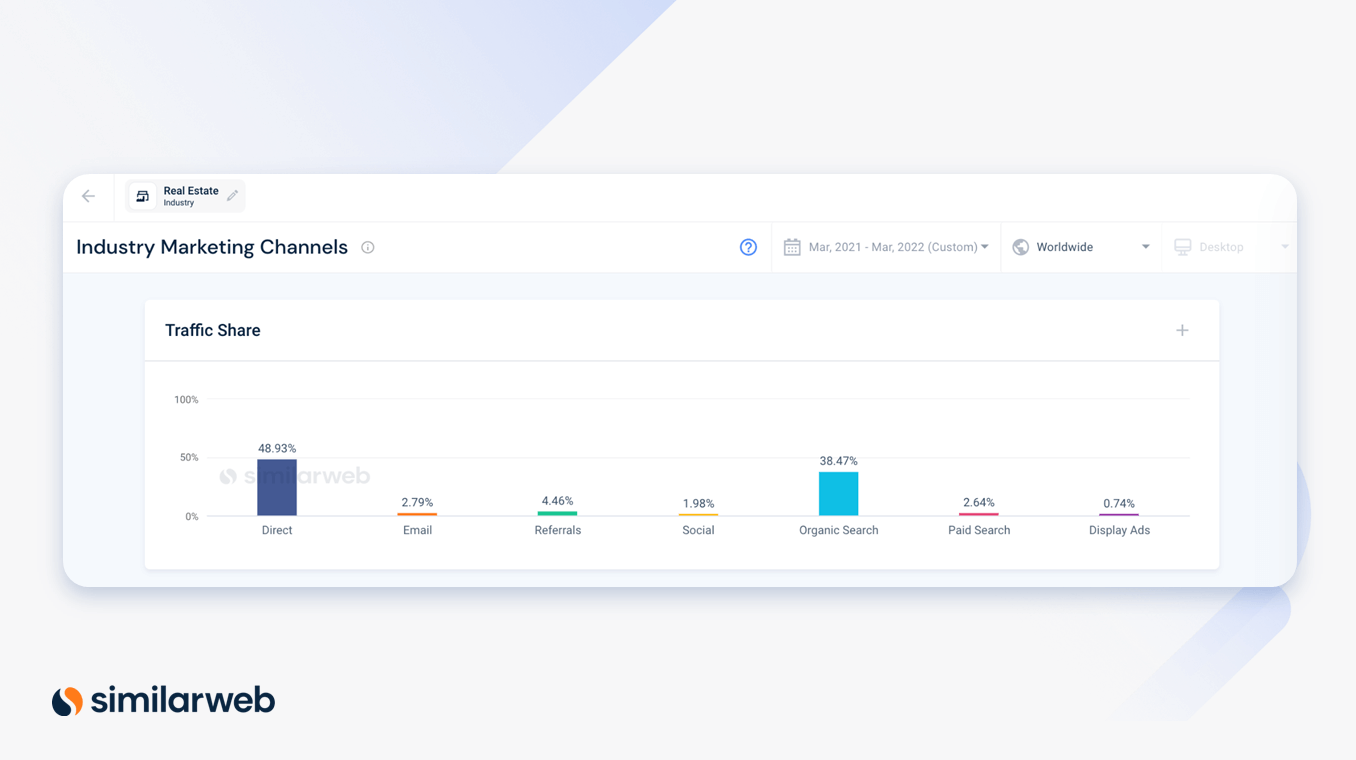
In the last year (March 2021 – March 2022), two traffic sources fought for the top spot in the global real estate industry: direct and organic search. Direct is winning so far, accounting for 48.9% of the traffic sent to global real estate websites; organic search comes in a close second with 38.5% of traffic share.
The remaining traffic is split among other marketing channels: email (2.8%), referrals (4.5%), social (2.0%), paid search (2.6%), and display ads (0.7%).
Let’s add some of the top real estate websites into the mix. When we compare channel performance of zillow.com, realtor.com, and rightmove.co.uk to the industry as a whole, it’s obvious how well-known these websites are. The amount of traffic the top three receive from both direct and organic search shows they are household names.
It’s interesting to note that although rightmove.co.uk receives less direct traffic worldwide than both zillow.com and realtor.com, the website has a much higher average visit duration for users coming to the website directly.
Long lease – keep users coming back
There are three key website metrics you should benchmark to measure your visitors’ on-site experience and engagement with your website:
- Average session duration: A longer session duration means your visitors are engaged and spending more time on your site.
- Average pages per visit: The higher the number, the more content your visitors are browsing through while on your site.
- Average bounce rate: The percentage of visitors who enter a site and then leave after viewing just one page. A lower bounce rate means that your content is relevant to your visitors.
Below are user experience benchmarks for real estate websites globally, as well as in the U.S. and the U.K. (March 2021 – March 2022).
Top 100 websites in the category globally, all traffic
- Monthly visits – 2 billion
- Average visit duration – 6 minutes 08 seconds
- Average pages per visit – 10.2
- Average bounce rate – 40.9%
Top 100 websites in the category in the U.S., all traffic
- Monthly visits – 1 billion
- Average visit duration – 5 minutes 39 seconds
- Average pages per visit – 9.4
- Average bounce rate – 44.8%
Top 100 websites in the category in the U.K.
- Monthly visits – 231.1 million
- Average visit duration – 6 minutes 46 seconds
- Average pages per visit – 11.8
- Average bounce rate – 38.3
Here’s a snapshot of how the top ten real estate websites perform compared to the industry benchmark. Rightmove.co.uk wins overall in terms of user engagement, with the longest average visit duration (8 minutes 49 seconds) and the lowest bounce rate (28.2%). The website also scores highly for pages per visit (19.2).
Know your audience
Congrats! You’ve nearly mastered your real estate benchmarking strategy. Now that you have a good idea about your competitors’ website performance, it’s time to take a closer look at your audience. Determining if your target audience differs (or resembles) that of your competitors will give you an advantage as you grow into new markets.
Ten countries make up approximately 75% of the market share for the top 100 online real estate websites. Visitors in these countries account for 2.5 billion total visits from January – March 2022.
Females are more likely to visit real estate websites than males. And age distribution for this industry skews younger, with 67% of the audience falling between 18–34 years old, and 33% at 35+ years old.
The next step
In a market that’s constantly evolving with the world around it, benchmarking is a very powerful tool to understand your position in the real estate industry and pinpoint areas of potential growth.
But how can you collect this information yourself? With Similarweb you’ll have access to real-time data (like the insights showcased in this blog) to help you target your audience more effectively, get the most out of your marketing channels, improve website engagement, and more.
Why wait any longer? Get started for free and get the benchmarks you need to edge out the competition.
Benchmark like a boss with fresh competitive data
Contact us to set up a call with a market research specialist


