7 Benchmarks to Win the Digital Gaming Industry

The online gaming industry is constantly evolving. New technology makes last year’s model obsolete overnight, a game can have explosive popularity for a month and then plummet out of nowhere, and there’s always an update to make whatever you’re playing better.
In such a competitive industry, continuous improvement is the key to smart decision-making and success. Benchmarking data can provide you with the analysis and insights you need to solve your pain points, whatever they may be.
Whether you want to perfect your marketing techniques, create go-to-market strategies, or map out business processes, this article will dive into the research metrics and competitive benchmarks you need to win the online game.
The rise of online gaming
There’s a popular misconception that kids these days just don’t appreciate the great outdoors. They’ve traded in Sandlot-style baseball games for TikTok dances and virtual reality.
But, they may have got it right.
In 2020, COVID-19 showed us just how meaningful digital connections can be, and that isolating in your apartment for hours didn’t necessarily mean you were alone. While social distancing may have physically kept us apart, online gaming allowed us to build new communities in the digital world. Online gaming skyrocketed in popularity and showed no signs of slowing down – but is this still the case now society is returning back to normal?
Let’s take a look at some of the industry benchmarks you should aim to beat in 2022.
1. Total visits
Total visits are one of the first website performance metrics you should evaluate to determine where you stand in the market.
When conducting a YoY analysis, the world-class 100 websites in the digital gaming category had 76.6 billion total visits in 2021, a whopping 20% more than in 2020 (62.7B). When looking specifically at the U.S., the growth is slightly weaker. 2021 saw a 17.0% increase in total site visits to the top 100 digital gaming websites, growing from 16.7 billion to 19.8 billion in one year.
In the first two months of 2022, traffic on gaming websites remains the same when compared to November – December 2021. The slow decrease in traffic illustrated above can be attributed to the world’s slow recovery from COVID-19, as society is beginning to function in a similar way as pre-pandemic, with face-to-face activities again.
2. Top websites
Twitch.tv is the most popular online gaming site worldwide, earning 6.3% of the global traffic share in February 2022 for the industry (1.2 billion monthly visits). The website experienced 25.8% growth in 2021, growing from 10.8 billion total visits (January – December 2020) to 14.0 billion (January – December 2021).
When looking at the U.S. specifically, roblox.com performs best, winning 8.2% of the traffic share (268.1 million monthly visits) in that market.
3. Website stickiness
For online gaming, the stickier your website, the better. This is another indicator of a site’s superior performance. A sticky website means that your users are choosing to return to your site time and time again, and usually implies loyal users and strong customer satisfaction.
Website stickiness is calculated by dividing the average number of unique visitors by the average total monthly visits.
Top 100 websites in the category (December 2021 – February 2022, worldwide):
- Unique Visitors (164.2 million) / Total Visits (7.0 million) = 23.5%
Top 25 websites in the category:
- Unique Visitors (120.3 million) / Total Visits (4.6 million) = 26.2%
4. Desktop vs. mobile web split
Data on device split can help you locate internal performance gaps.
For most industries, 2020 was a year of rapid growth in the mobile world, with many optimizing apps to mimic the experience and interface of their desktop counterparts.
However, the digital gaming industry is experiencing the opposite. Although the data for global device split for the top websites in this category shows a small increase YoY for mobile use, desktop still remains popular with gamers. This showcases how apps can’t yet replace the graphics associated with traditional PC or desktop gaming.
Top 100 websites in the category
- Desktop – 63.1% in 2021 (vs. 64.2% in 2020)
- Mobile Web – 37.0% in 2021 (vs. 35.8% in 2020)
Top 25 websites in the category:
- Desktop – 69.6% in 2021 (vs. 70.0% in 2020)
- Mobile Web – 30.4% in 2021 (vs. 30.0% in 2020)
5. Marketing channels deep dive
Between affiliate marketing, paid advertising, and old-fashioned word-of-mouth, knowing which marketing channels bring traffic to your gaming website is an important step of market research.
Benchmarking these channels against your competitors’ performance will help you plan and implement changes accordingly to get the most ROI from your marketing budget. For instance, if you see that most of your competitors have a weak referral marketing strategy, you can capitalize on this weakness in their business performance and work with top affiliates to draw traffic toward your site.
Direct (71.4%) is the main source of traffic to digital gaming websites, followed by organic search (19.6%), and social (5.2%).
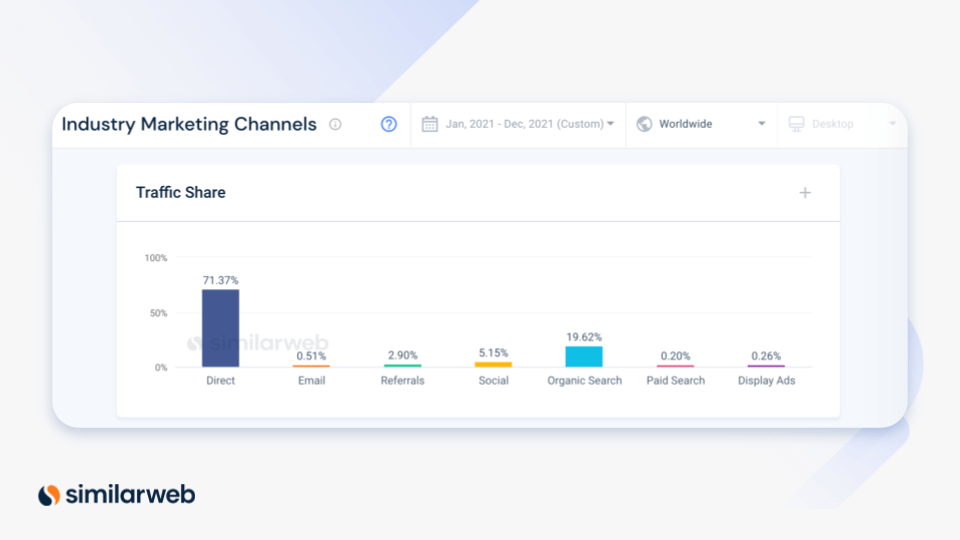
When taking a look at the last three months (December 2021 – February 2022), twitch.tv performs much better than the industry benchmark for direct traffic. However, the gaming giant lags behind the other top 100 websites in different marketing channels, especially organic search. This shows that many of twitch.tv’s competitors are taking advantage of SEO best practices and other organic search tactics.
Get your FREE guide!
Download the free guide to Competitor Benchmarking
Personal info
6. User experience and satisfaction
There are three key metrics you should be tracking to measure your visitors’ on-site experience and satisfaction with your website:
- Average session duration: A longer session duration means your visitors are engaged and are spending more time on your site.
- Average pages per visit: The higher the number, the more content your visitors are browsing through while on your site.
- Average bounce rate: The percentage of visitors who enter a site and then leave after viewing just one page. A lower bounce rate means that your content is relevant to your visitors.
Below are user engagement benchmarks for gaming websites globally, as well as in the U.S. and the U.K. (December 2021 – February 2022)
Top 100 websites in the category globally
- Monthly visits – 7.0 billion
- Average visit duration – 8 minutes 25 seconds
- Average pages per visit – 7.4
- Average bounce rate – 34.3%
Top 100 websites in the category in the U.S.
- Monthly visits – 1.8 billion
- Average visit duration – 8 minutes 02 seconds
- Average pages per visit – 7.1
- Average bounce rate – 35.9%
Top 100 websites in the category in the U.K.
- Monthly visits – 274.2 million
- Average visit duration – 7 minutes 14 seconds
- Average pages per visit – 5.3
- Average bounce rate – 39.0%
When looking at the top five websites globally, although twitch.tv has the highest traffic share, both roblox.com and chess.com score significantly higher for session duration and pages per visit. Gamers on these websites are playing longer, and are exposed to more ads with each page they visit. For free gaming websites like these, effective advertising is key to strong ROI – it’s where the money is.
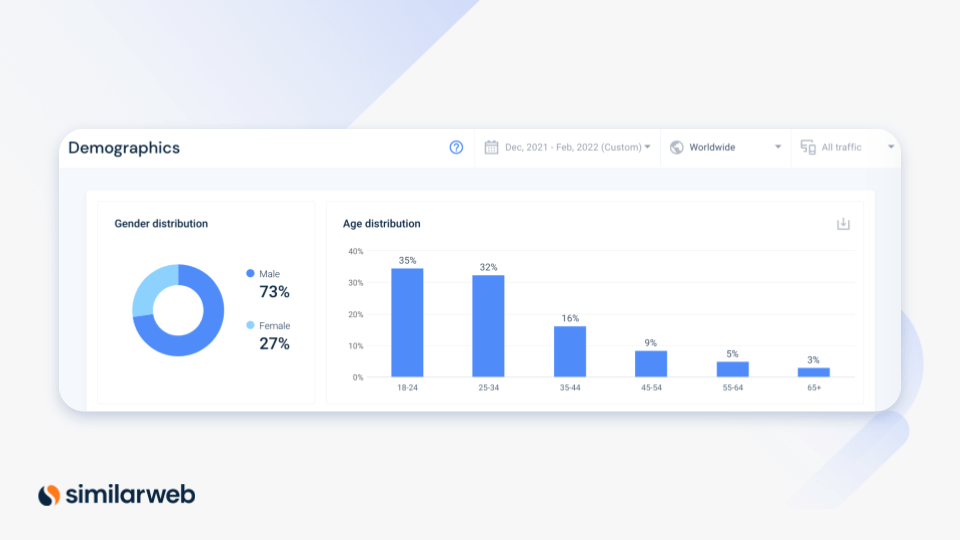
7. Audience analysis
Who are the people actually coming to your website? How do the gamers on your site differ from those of your competitors? What gives you that competitive advantage?
These are questions that audience analysis can help you answer. Defining your ideal customer and target audience is fundamental for any business venture, product launch, and digital strategy. With the right data collection, you’ll be able to expand user reach, grow into new markets, and ultimately win consumers away from your competitors.
Five countries make up approximately 40% of the market share for the top 100 online gaming sites. Gamers in the United States, China, South Korea, Japan, and Russia account for 6.8 billion total visits to gaming sites from December 2021 – February 2022.
Males are more than twice as likely to visit online gaming websites compared to females. And age distribution for this industry tends to skew younger, with 67% falling between 18–34 years old.
Benchmarking with data
The benchmarking process will give you the competitive edge to not only outperform the competition but also streamline your own processes. Using Similarweb’s accurate data gives you the latest benchmarks. Get started for free to find out where you stand in your market.
Related articles
- 7 Benchmarking Types for Better Business Decisions [and Examples]
- 6 Benchmarks to Outperform the Biggest Digital Job and Career Websites
- Benchmarks for Digital Publishers & News Sites
- B2B and Beyond: 6 Industry Benchmarks to Assess Your Site
- Get in the Game: How to Ace Audience Analysis
- [Infographic] Online Gaming Ranked by Digital Market Share

Related Posts


Benchmark like a boss with fresh competitive data
Contact us to set up a call with a market research specialist