


Financial Services Benchmarks: See How the Industry Measures Up

Did you know that traffic to Financial Services websites dipped this year? Did you know that Google Pay is the second most downloaded financial service app in the US, and the most downloaded financial service app in the UK?
The financial services industry is one of the fastest-changing out there, originally spurred on by digital transformation, the pandemic has only increased this disruption further.
Our industry benchmarking series shares all the key digital data points you need for this market using Web Intelligence. So read on to discover more in-depth stats around financial services benchmarking and spot the top performers in the space.
1. Total visits to financial services websites
Total visits is a key metric to benchmark financial services, and one of the first website performance metrics used to determine where a website stands in the market.
In the last two years, total visits to finance websites in the months of January – March have increased 33% worldwide – from 12.2 billion in 2020 to 17.0 billion in 2022. The drastic rise in visits makes sense, given that COVID-19 forced customers to access their finances online.
However, in comparison to 2021, visits to finance websites are down by 1.1% in 2022. Total visits were slightly higher in 2021, at 17.2 billion – presumably due to the pandemic preventing people from visiting bricks and mortar banks/services.
When looking at the past two years as a whole, the financial services category had a total of 68.9 billion visits worldwide in 2021, an increase of 19% compared to 2020. In 2020, this industry had a total of 56.9 billion visits worldwide.
The finance industry in the U.S. also experienced a jump in traffic. Total visits increased by 11.3% – from 30 billion in 2021 to 33.6 billion in 2022.
2. On-site engagement metrics
There are three key website metrics you should benchmark to measure visitors’ on-site experience and engagement with a website:
- Average session duration: A longer session duration means your visitors are engaged and spending more time on your site.
- Average pages per visit: The higher the number, the more content your visitors are browsing through while on your site.
- Average bounce rate: The percentage of visitors who enter a site and then leave after viewing just one page. A lower bounce rate means that your content is relevant to your visitors.
Below are user experience benchmarks for finance services websites globally, as well as in the U.S. and the U.K. (January – March 2022).
Top 100 websites in the category globally, all traffic
- Monthly visits – 5.7 billion
- Average visit duration – 6 minutes 03 seconds
- Average pages per visit – 6.5
- Average bounce rate – 32.8%
Top 100 websites in the category in the U.S., all traffic
- Monthly visits – 2.8 billion
- Average visit duration – 6 minutes 08 seconds
- Average pages per visit – 6.6
- Average bounce rate – 28.9%
Top 100 websites in the category in the U.K., all traffic
- Monthly visits – 532.3 million
- Average visit duration – 4 minutes 21 seconds
- Average pages per visit – 5.5
- Average bounce rate – 35.5%
3. The top 10 financial websites
Which websites are grabbing the top ten spots globally?
- Paypal.com
- Coinmarketcap.com
- Tradingview.com
- Chase.com
- Intuit.com
- Investing.com
- Wellsfargo.com
- Bankofamerica.com
- Binance.com
- Capitalone.com
Paypal.com is the most popular financial services website worldwide, earning 2.5% of the global traffic share, and 504.2 million monthly visits in January – March 2022. In the first quarter of 2022, (January – March) there were an estimated 429 million active registered PayPal accounts worldwide.
PayPal also takes first place as the most popular finance site in the U.S., winning 3.5% of the traffic share, and 205 million monthly visits in the same period.
The next two websites on our list globally are coinmarketcap.com and tradingview.com. Both websites have 1% of the traffic share, and 206.7 million and 206.4 million monthly visits, respectively.
Here’s a snapshot of how the top financial services websites perform compared to the industry benchmark:
- Paypal.com wins overall in terms of monthly visits, with 504.2 million.
- Intuit.com has the longest average visit duration, at 10 minutes and 7 seconds, just over four minutes longer than the industry standard.
- Wellsfargo.com has the highest pages per visit with 11.2, surpassing the industry average of 6.5.
- Chase.com shows the lowest bounce rate with 14.2%, which stands at just over half of the industry standard.
4. Website traffic sources
Knowing which marketing channels bring traffic to a website is an important step in market research. Since there are so many ways a user can end up on a site, it’s important to understand which channels are the most successful to focus a marketing budget and efforts accordingly.
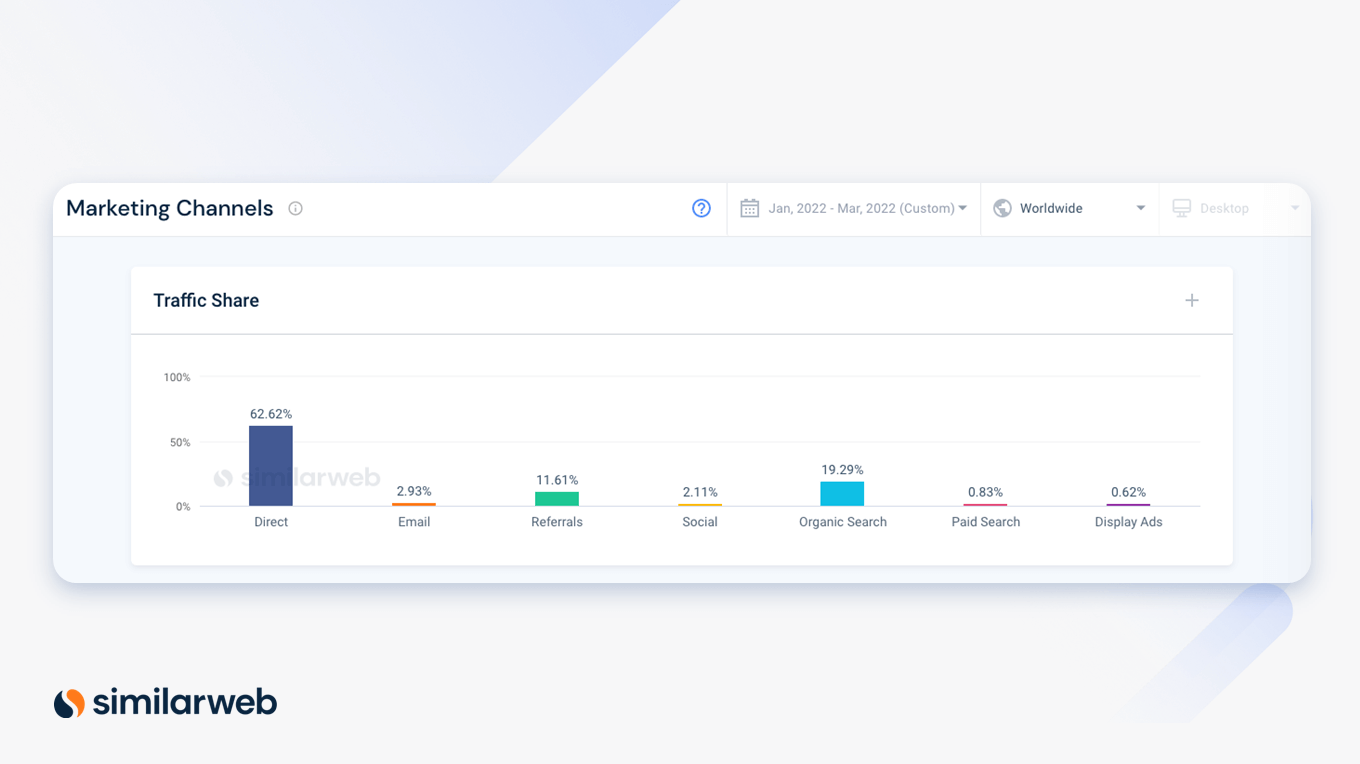
Direct (62.6%) is the main source of traffic to the top financial services websites worldwide, followed by organic search (19.3%) and referrals (11.6%)
The remaining traffic is split among other marketing channels: email (2.9%), social (2.1%), paid search (0.8%), and display ads (0.6%).
5. Audience analysis
Next on our finance benchmarking metrics list is audience analysis. Defining the target audience of financial services allows us to understand the industry in greater depth. Which region are most of the population browsing from? Are browsers predominantly male or female? What age range do the majority fall into?
These are all questions that benchmarking website performance and audience analysis can answer.
Worldwide traffic share
For the finance industry, 10 countries make up approximately 59% of the market share for the top 100 websites. Visitors in these countries account for approximately 8.02 billion total visits from January – March 2022.
Here’s a breakdown of traffic share and monthly visits per country, January – March 2022:
- U.S. (23.7% of traffic share, 2.8 billion monthly visits)
- India (4.9%, 943.0 million)
- Japan (4.8%, 901.6 million)
- Russia (4.2%, 490.1 million)
- France (3.7%, 453.4 million)
- Poland (3.7%, 399.2 million)
- Germany (3.6%, 460.1 million)
- Canada (3.5%, 410.7 million)
- United Kingdom (3.3%, 532.3 million)
- Brazil (3.2%, 630.6 million)
The United States remains on top of the list, making up almost a quarter of the total global traffic.
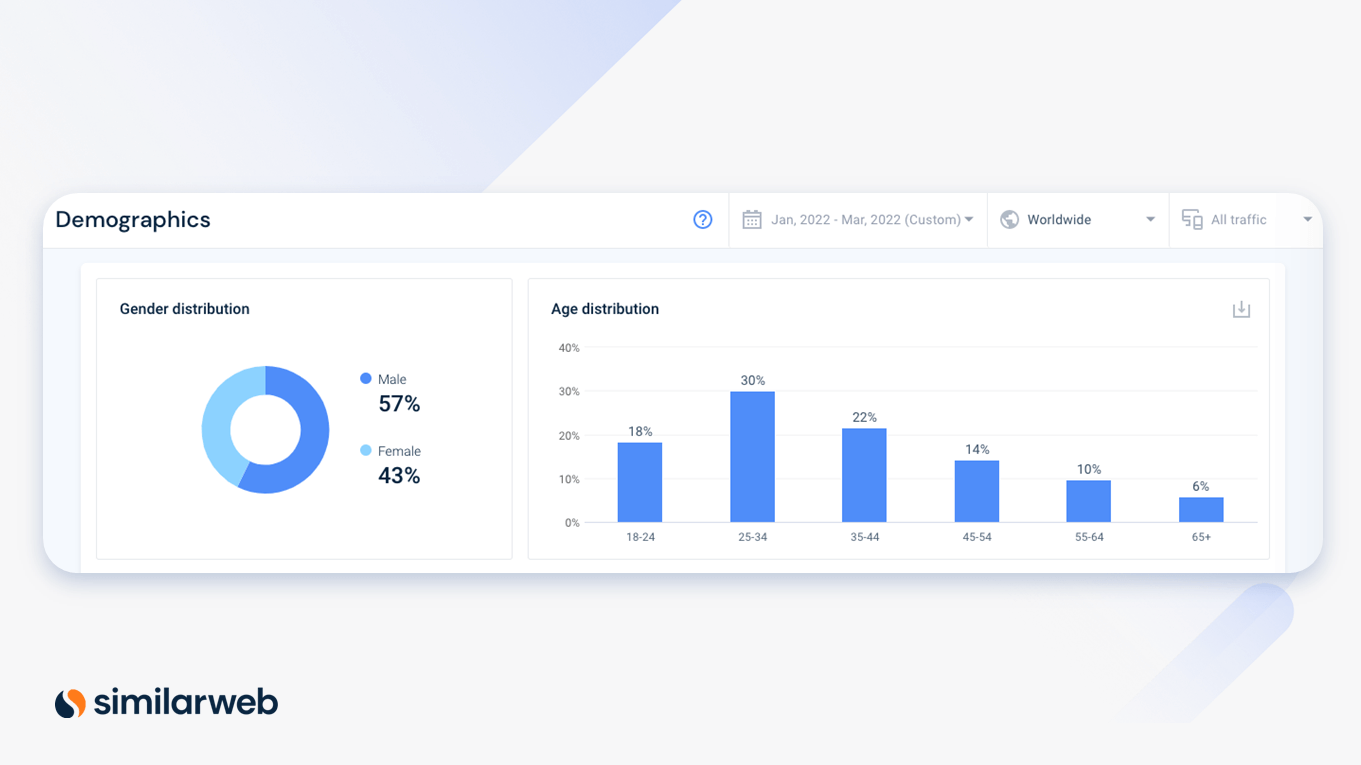
Age and gender distribution
Other audience demographics to track include age and gender.
Males are more likely to visit finance websites than females. Age distribution for this industry appears relatively balanced, with 48% of the audience falling between 18–34 years old, and 52% at 35+ years old.
6. Device split
Device split provides an understanding of how an audience is accessing a website.
We can see that over time financial service websites are less affected by the ongoing trend towards mobile. Data shows that these websites get most of their search queries from laptops and personal computers. This makes sense given that making an investment or checking account statements requires more attention than an online order. So when it comes to money-related decisions, people tend to prefer the familiar surroundings of their home or office.
Top 100 websites in the category (January – March):
- Desktop – 54.7% in 2022 (vs. 56.2% in 2021)
- Mobile Web – 45.3% in 2022 (vs. 43.8% in 2021)
Top 10 websites in the category (January – March):
- Desktop – 64.0% in 2022 (vs. 64.0% in 2021)
- Mobile Web – 36.0% in 2022 (vs. 36.0% in 2021)
These metrics highlight the importance of having a clear desktop experience for users, but since the number of mobile users is still high, it is important not to neglect a user-friendly mobile experience.
7. Financial services benchmarking: the app edition
For many, mobile apps have become extremely popular when handling finances on the go. When briefly checking our account balance or quickly transferring money to a friend, the ease of using an app on our phones takes precedence.
Let’s take a look at the top five finance apps on Google Store in the U.S. and the U.K.:
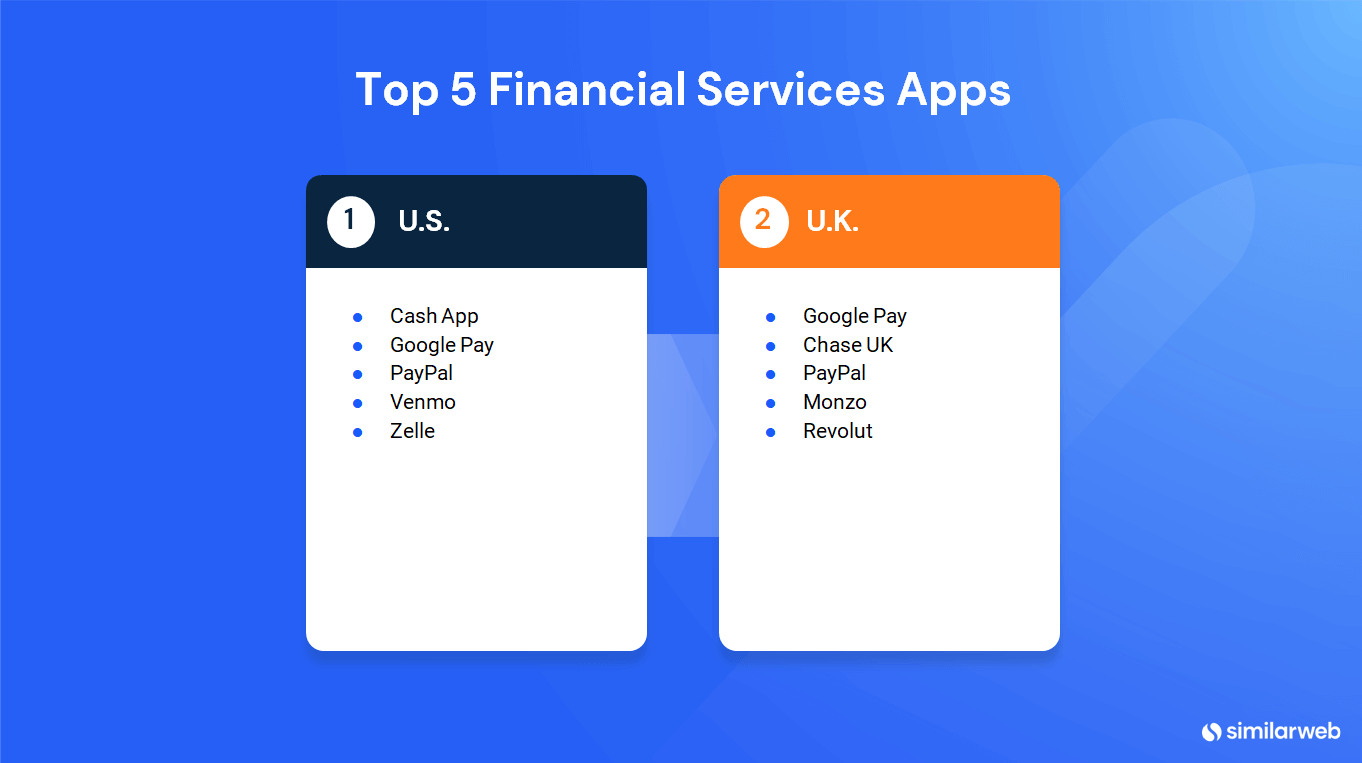
When looking at the top finance apps, we see that while those in the U.S. receive much more average monthly visits, which can be attributed to a greater population, the U.K. comes in as a close second for install penetration rate.
Key engagement metrics for the top 5 finance apps in the U.S. (January – March 2022):
- Average monthly downloads – 7.8 million
- Average monthly active users – 12.8 million
- Average install penetration – 15.2%
Key engagement metrics for the top 5 finance apps in the U.K. (January – March 2022):
- Average monthly downloads – 491.3K
- Average monthly active users – 1.1 million
- Average install penetration – 13.7%
Here’s a summary of the app metrics we analyzed:
- Install Penetration: The percentage of devices in the defined market with the app installed on average
- Downloads: App downloads from the Google Android Store in the given time period
- Monthly Active Users: The average amount of unique monthly active users
Ready to start benchmarking?
For a deeper analysis and to help you assess your position in the market, use Similarweb’s Web Intelligence platform, which can be applied to numerous industries for competitive benchmarking.
Get all the digital data you need to stay ahead today.
FAQ
What is a financial benchmark?
A financial benchmark is a standard against which the performance of a security, mutual fund, or investment manager can be measured.
What are the most important metrics of financial services benchmarking?
Bounce rate, engagement rate, device split, and conversion rate.

Related Posts


How to Do A Competitive Analysis: Complete Guide & Free Templates


Benchmark like a boss with fresh competitive data
Contact us to set up a call with a market research specialist