How to See Your Competitors’ Pageviews and Benchmark Against Them

A high number of pageviews isn’t necessarily an indicator of high user engagement or potential revenue from your website or app. But, that doesn’t mean pageviews are insignificant. Monitoring and working with this key metric may even be more valuable than you think. The trick is to look at it in the right context.
On Google Analytics, pageviews mainly help with your technical and functional analysis. We will show you a way to monitor your pageviews and visits and use competitor benchmarking in a way that caters to business management.
What is the definition of Pageviews in Google Analytics?
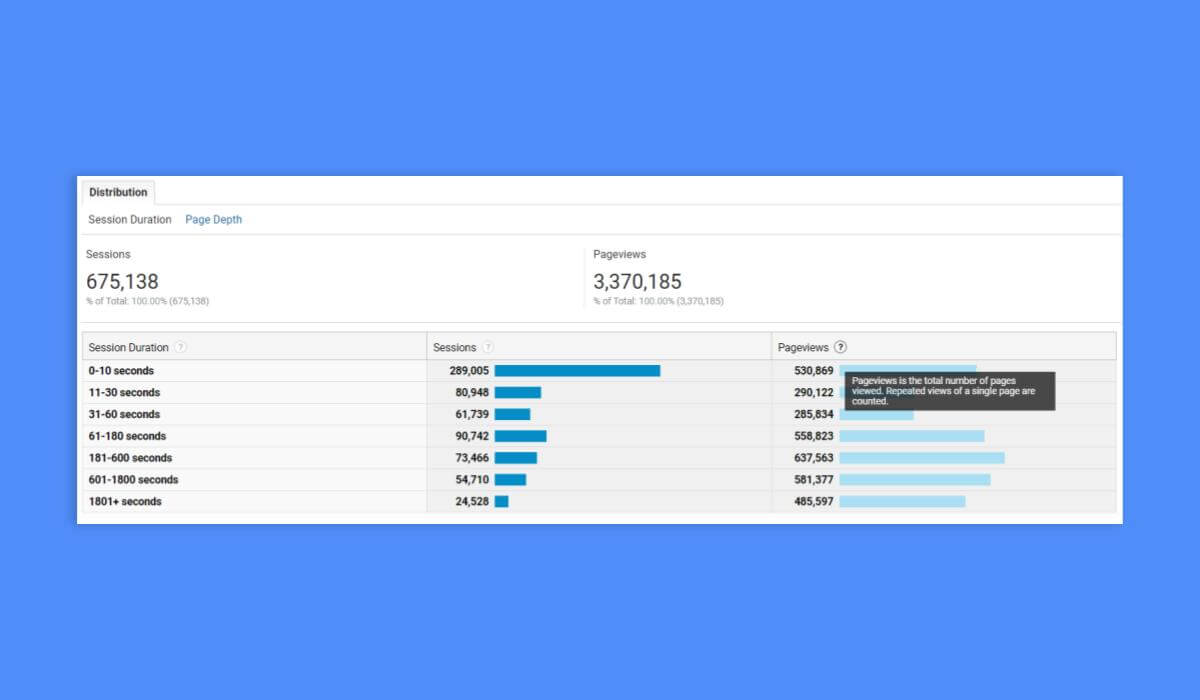
Let’s go to the source and ask the Google Analytics help center, where a pageview is defined as:
“A pageview (or pageview hit, page tracking hit) is an instance of a particular page being loaded (or reloaded) in a browser.”
Each time a user opens a webpage, it counts as a view or pageview hit. The user may leave and go back to the same page 20 times during a session, each time the site crawler records a pageview. Even when the visitor reloads or refreshes a page, it’s another view.
This doesn’t tell you much about a visitor’s behavior. To learn more about that, Google Analytics also provides unique pageviews. This shows the aggregated number of pageviews generated by the same user in the same session. In other words, each page the user opens in a single session is counted only once, even if they reloaded and visited the page multiple times.
How does Similarweb calculate pageviews?
Similarweb’s marketing intelligence platform provides an additional, similar metric, in which subsequent views of the same page are included until the user is inactive for at least 30 minutes.
For example, if a user opens a page and reloads it several times, or moves to another page and comes back, that’s a single page visit. The user then decides to leave your site to compare your product to that of a competitor and is inactive on your website. If they return within less than half an hour, it’s still the same visit. If they stay away longer, their return counts as an additional visit.
This helps you get a better understanding of how visitors interact with the pages on your site or app. You can then look at the Pages/Visit metric to understand how many different pages on average the user viewed during a session or visit.
Note that most businesses use first-party direct measurement tools such as Google Analytics to measure and analyze traffic to their own domains. Google Search Console is another tool that can be used to understand organic traffic metrics. The data provided by these tools are different from the data provided by Similarweb, which comes from multiple sources, including panel-based behavioral data and public data sources.
Leverage daily pageviews per visitor for more insight
To help you understand the scope of engagement per user, monitor how many pages a person views on average in one day. You want to understand the behavior of a unique visitor. How many pages or features does one access on average? Do they visit the same page all the time, do they have several favorite pages (if so, which), or do they explore random places on your website?
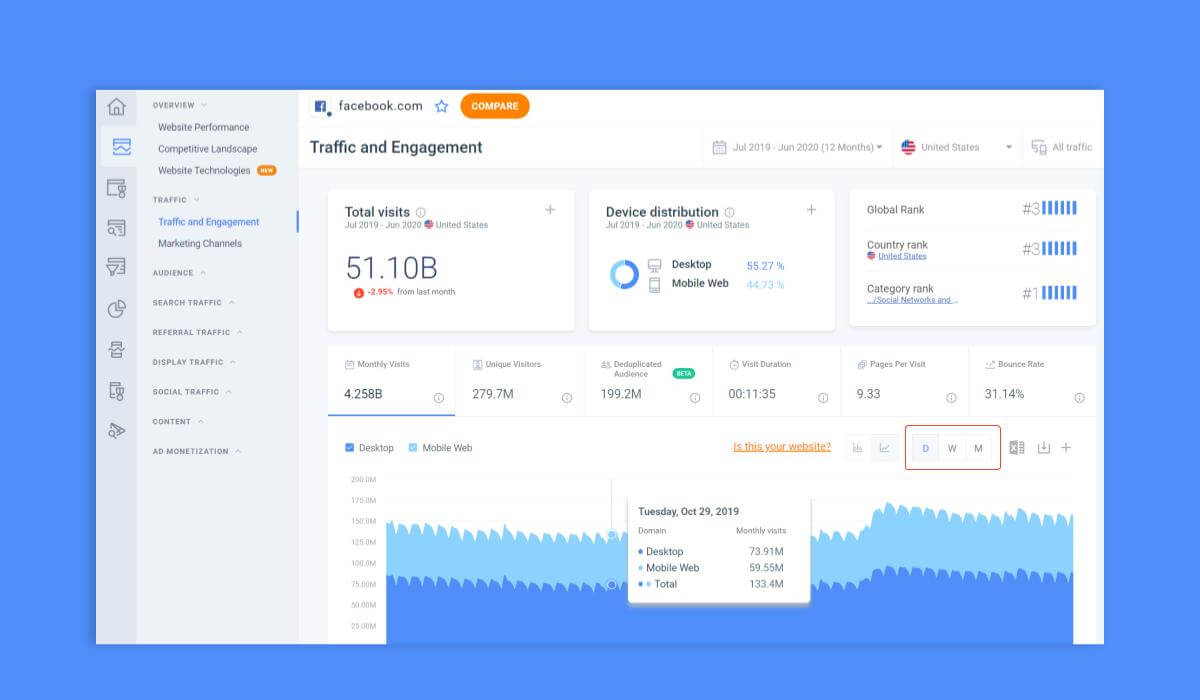
On the Similarweb platform, you can set the time frame to monitor Total Visits – i.e., over weeks, months, or even years. You will then see how many pages each unique visitor viewed on average per the selected time frame.
Why you should look at Monthly Visitors
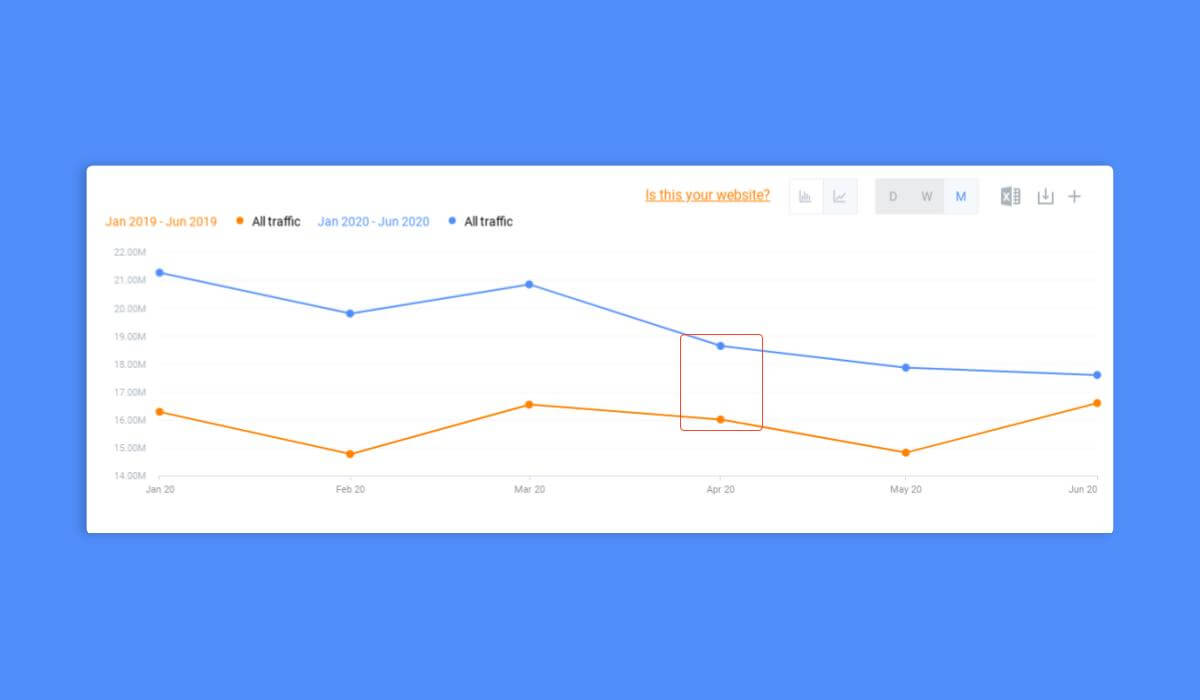
Looking at daily highs and lows is not enough to determine business achievements, but rather the ability to sustain high numbers and steady growth will determine your success or failure.
Similarweb lets you monitor periodic pageviews, such as monthly, weekly, or daily visits, which are a bit complicated to find on Google Analytics. Mobile apps, retailers, and SaaS B2B companies benefit the most from this feature.
The Monthly Visitors metric helps you understand the level of activity on your site in the context of time and over long periods. The pageviews metric is equivalent to dividing the number of monthly visits by the number of pages per visit.
By looking at the bigger picture, you can better understand trends and variations over time. This is useful for strategic planning. You can even use monthly visits in your goal setting for the year/quarter ahead.
What is a good number of Monthly Pageviews based on my industry?
If you enter this search query in Quora or a search engine like Google, you get answers ranging from 1,000 to 100,000. What’s worse, all the answers are correct. A blog is very different from a product page on your eCommerce site, and navigation apps are different from news apps. It also makes a difference whether you are new or established in the market, a local or international enterprise, and you’re targeting small or large businesses.
It’s up to you to work through the jungle of data to figure out how you measure up. Similarweb helps with that because it focuses on competitive analysis and provides the most useful tools for applicable comparisons.
Tracking your industry’s and competitors’ Pageviews
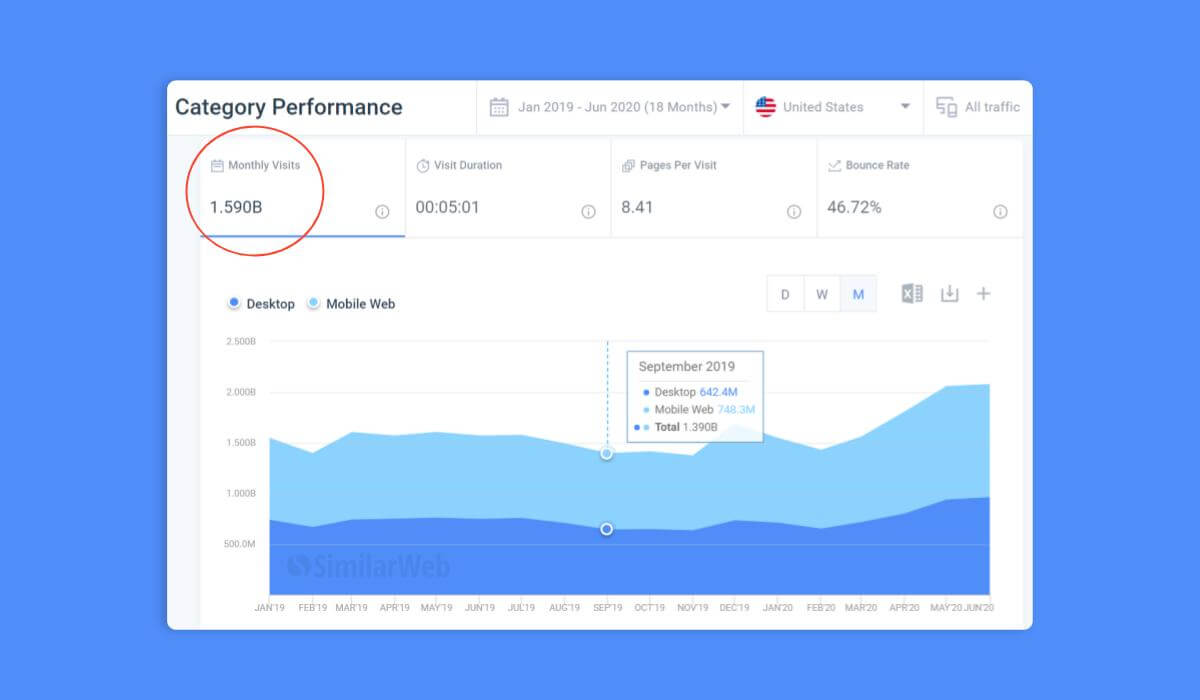
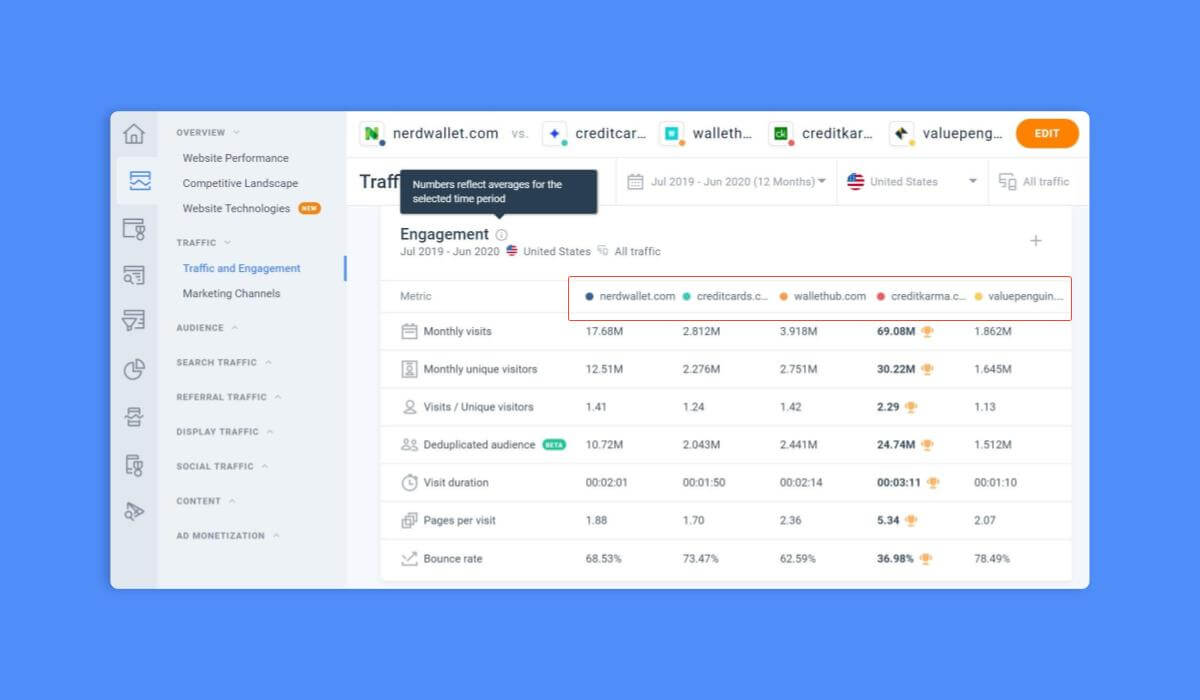
You know better than any web analytics tool who your biggest competitors are. The platform allows you to pick a number of competitor sites, see their page visits and compare the performance across key engagement metrics. Keep tracking their stats and yours to get a clear view of your business landscape.
Another option is to choose a category and benchmark yourself to the industry as a whole. Knowing where you fit in with a similar crowd helps assess your market position more accurately, lets you focus on areas that need improvement, and set long-term goals for market growth.
Similarweb also provides you with a monthly Email Digest, including information about your website pageviews and those of your competitors.
Next Step: Improve the quality of your website traffic
We’ve shown you how analyzing pageviews in the right context of time and competition can be beneficial for your long-term business objectives. What you really want to investigate, though, is the quality of your traffic, in addition to its quantity. Ultimately, you want traffic that converts and visitors who buy your product, engage with your site, and return for more.
Similarweb platform lets you dig into data that helps evaluate your traffic quality. You’ll find a large number of engagement metrics on the platform, and you’ll gain visibility into Average Visit Duration, Device Distribution, Visits Per Unique Visitor, Bounce Rate, and more. These are tools to increase the amount of high-quality traffic to your website.
The platform is designed to help you understand how your users think and act, and how your competition performs. Similarweb provides data that helps you manage your business. You can set and monitor goals with a direct connection to your business objectives.
FAQ
What are pageviews and why are they important?
A pageview is when a page is loaded or reloaded in a browser. If you use the Similarweb marketing intelligence platform, you can see how many times one page is viewed until the user is inactive for at least 30 minutes, giving you a clear picture of what user interaction looks like on your site.
How can I make use of the insights I get from pageviews?
Monitor how many pages one person, or a unique visitor, views on average in one day. This will help you understand the scope of their specific engagement and ultimately, paint a clearer picture of their buyer persona.
How can I see my competitor’s pageviews?
Head to Similarweb and pick any number of competitor sites, view their page visits, and compare performance across key engagement metrics. Keep tracking their stats and yours to get a clear view of your business landscape.
Benchmark like a boss with fresh competitive data
Contact us to set up a call with a market research specialist
