Benchmarking Website Traffic: Complete Guide + 2025 Industry Data

In the competitive digital landscape, understanding how your website performs relative to industry peers is essential. Benchmarking website traffic enables businesses to identify gaps, spot growth opportunities, and refine strategies to stay ahead. Whether you’re aiming to boost user engagement, optimize content, or drive conversions, benchmarking provides a roadmap for sustainable online success.
In this article, we’ll show benchmark numbers from large-scale studies by HubSpot and Similarweb, explain the important metrics and channels when tracking website traffic.
What is website traffic benchmarking?
Website traffic benchmarking involves comparing your site’s performance metrics against industry standards to gauge effectiveness. This process helps identify areas that need improvement and informs data-driven improvement.
By understanding how your metrics stack up against the competition, you can set realistic goals that align with market trends. Benchmarking is an invaluable tool for assessing your site’s health, staying relevant in your industry, and growing your market footprint.
The importance of benchmarking website traffic
Performance insights
Benchmarking provides a clear view of your site’s performance by highlighting metrics such as unique visitors, bounce rates, and engagement levels. These metrics allow you to make data-driven decisions to improve your site’s effectiveness.
Regularly comparing your performance to industry standards helps evaluate your marketing practices, keep your content relevant, and ensure your site stays user-friendly and meets user expectations. Tracking trends through benchmarking helps maintain your competitive edge and prevents your site from becoming outdated in a fast-changing digital economy.
Inbound traffic strategy
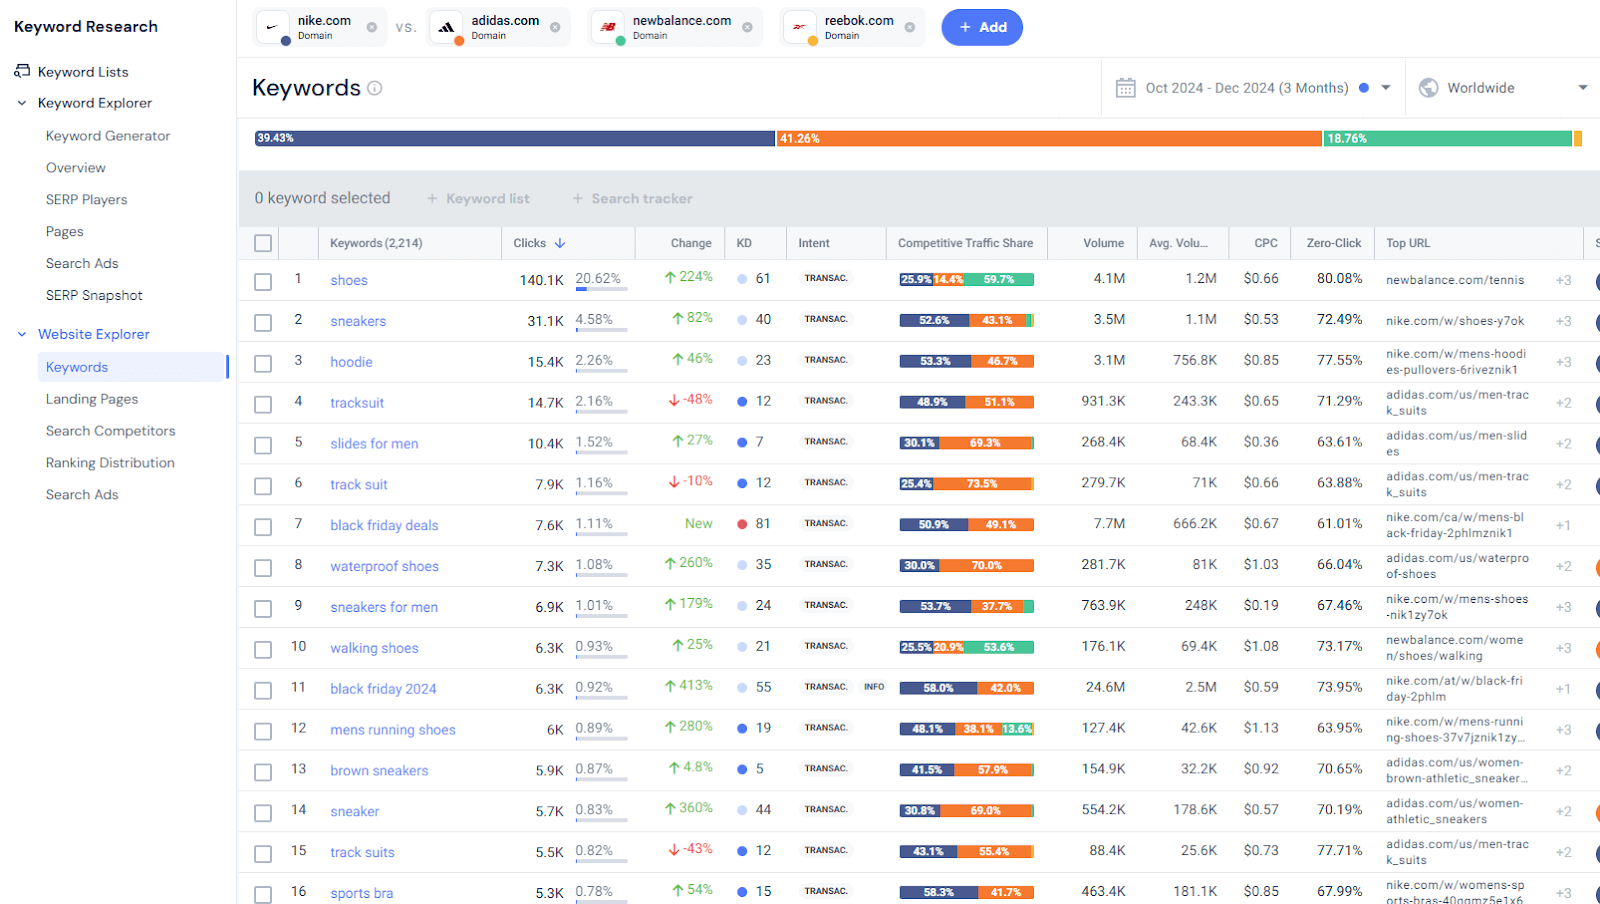
Evaluating your competitors’ traffic sources and keyword traffic share helps refine your inbound strategy. By analyzing their success in organic, direct, referral, and social media traffic, you gain valuable insights into effective keyword usage and backlink opportunities, enhancing your approach to search rankings.
SEO is a critical part of most companies’ inbound strategy and strongly relies on competitor benchmarking. Monitoring competitors’ SEO tactics reveals trends in content optimization and current technical SEO practices. This knowledge allows you to adjust your strategy, improve keyword targeting, and identify new ways to boost your site’s search visibility.
Market trends and opportunities
Benchmarking helps you spot industry trends and reveals growth opportunities by highlighting differences between your site’s performance and key competitors. Analyzing these gaps can uncover ways to increase your market share.
Here are a few examples of how benchmarking can impact your marketing strategy:
- Discovering that competitors consistently outperform you in mobile traffic may indicate a need to improve your mobile site or app
- Seeing keywords or product categories that drive major traffic to competitors can encourage you to develop new products or features
- Identifying content types that drive engagement and loyalty for competitors—for example, thought leadership blogs or deep reports with statistics—can inform your content strategy
How many visitors does a website typically get?
The number of visitors a website typically receives varies widely based on factors such as its size, industry, and content strategy. While it’s impossible to pinpoint a universal average due to the huge diversity of the Internet, there are general trends and benchmarks to consider.
Distribution of website traffic
According to a HubSpot survey of over 400 web traffic analysts, who self-reported traffic for the websites they manage, this is the current distribution of website traffic:
- 1,001-15,000 visitors per month: This is the biggest category, making up 46% of respondents.
- 15,001-50,000 visitors per month: 19.3% of respondents.
- 50,001-250,000 visitors per month: 23.2% of respondents.
- 250,001-10 million visitors per month: 11% of respondents.
- 10 million+ visitors per month: Only 0.5% of respondents.
Traffic by company size
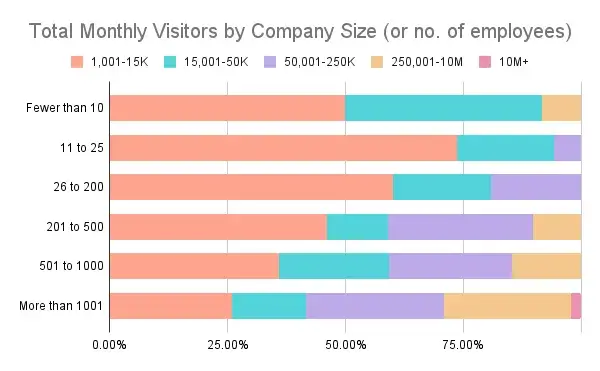
Larger companies often generate higher traffic due to extensive resources and marketing budgets. For example:
- Companies with over 1,000 employees are much more likely to attract over 250K visits per month.
- However, even smaller companies can achieve high traffic—8% of companies with fewer than 10 employees report over 250K visitors.
Traffic by content production
Content frequency plays a critical role in driving traffic. Websites with frequent content updates generally attract higher levels of traffic.
For example, only those publishing multiple times daily can achieve and sustain visitor counts exceeding 10 million per month. These sites often include news platforms, social media services, or large-scale eCommerce platforms, where consistent updates are vital for user engagement.
Traffic by website age
Older websites often benefit from established reputations, broader link-building opportunities, and long-term visibility in search engine results. Sites active for over a decade dominate higher traffic ranges, as they are more likely to have well-established audiences and consistent search visibility.
Websites aged 7–9 years also show impressive results, frequently surpassing the traffic levels of older competitors. This is often due to the adoption of innovative content strategies or staying attuned to changing audience preferences.
Younger websites, while disadvantaged by limited domain authority, can still achieve high traffic with aggressive marketing, niche targeting, or unique content offerings.
Device distribution
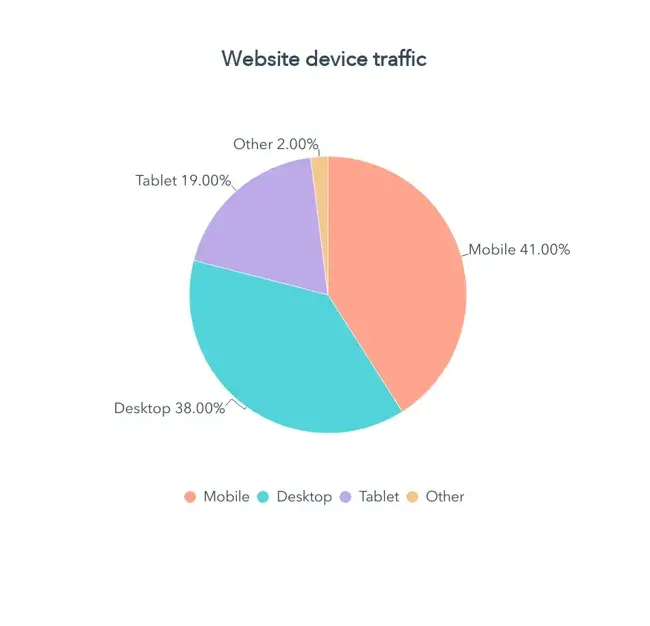
According to survey respondents, the majority of their traffic comes from mobile devices (41%), followed by desktops (38%) and tablets (19%). This trend underscores the importance of mobile-friendly design and responsive websites.
By analyzing these benchmarks, businesses can better understand where their website stands, set expectations with stakeholders, and refine strategies to attract and retain visitors.
Website traffic benchmarks by industry
Website traffic benchmarks vary significantly across industries due to differences in audience behavior, content strategy, and market conditions.
Similarweb’s 2024-25 Marketing Benchmark Report provides traffic data for the biggest websites in several industries. It segments website traffic performance into three cohorts: Giants (top 10 websites in their industry), Challengers (ranked 11-100), and Up-and-Comers (ranked 101-500 or beyond). These categories help businesses compare their performance to similarly ranked competitors.
Let’s review key figures from the report for three important industries: news and media, food and drink, and air travel.
News and Media
- Giants in this category dominate with an average of 204 million visits per month, driven primarily by direct traffic (77% of their total).
- Challengers receive an average of 8.1 million visits monthly, relying more on organic traffic (50% direct traffic compared to 77% for Giants).
- Up-and-Comers receive an average of 926.8 thousand monthly visits, driven more by referral traffic (33% compared to 49% direct traffic).
- Social media contributes only 1% for Giants and 7% for Up-and-Comers, showing limited reliance on this channel for traffic.
- Marketing channel distribution for the entire category during 2024:
Food and Drink
- Giants attract an average of 296 million monthly visits, with direct traffic accounting for nearly 47%.
- Challengers receive an average of 2.2 million monthly visits, with organic traffic accounting for 40% (compared to 43% direct traffic).
- Up-and-Comers benefit from a growing trend toward healthy eating and digital engagement, showing the potential for growth in mobile and organic channels. They have an average of 426.3 thousand visits (41% direct traffic).
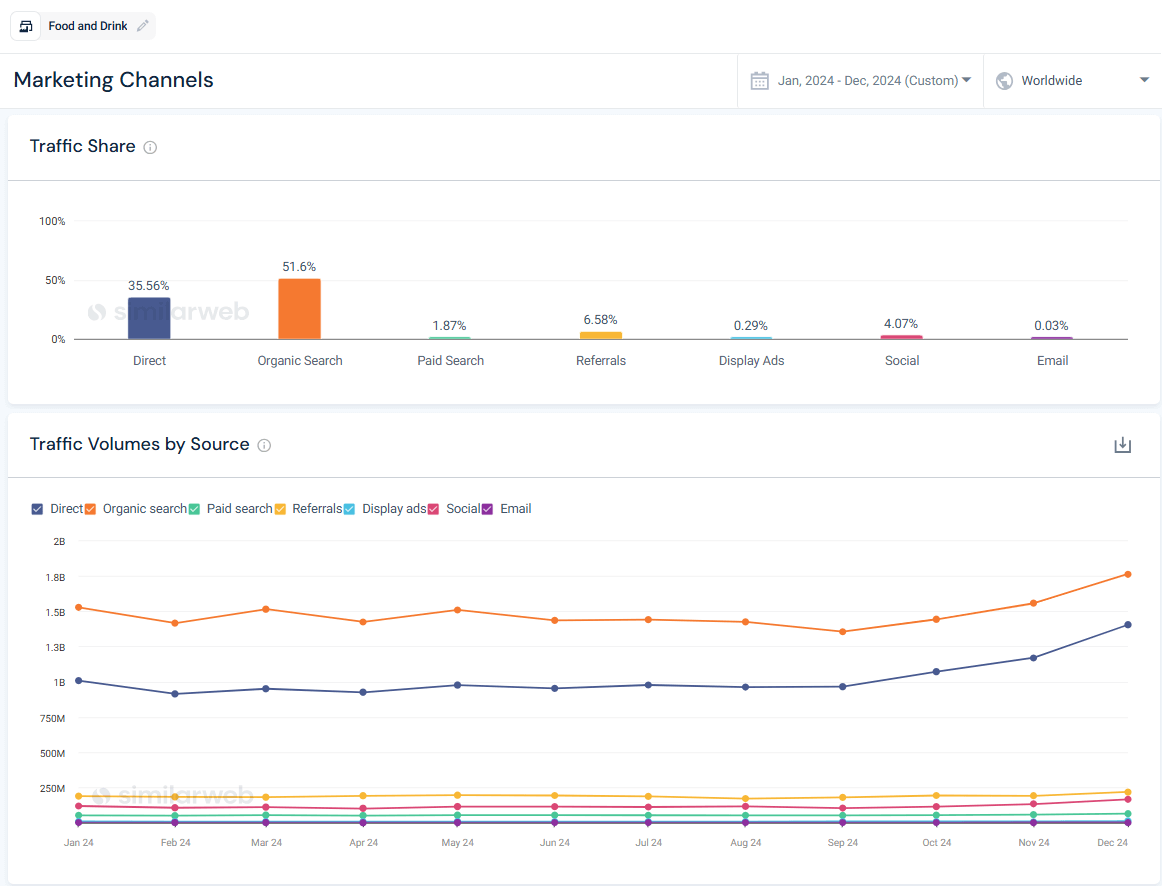
- Marketing channel distribution for the entire category during 2024:
Air Travel
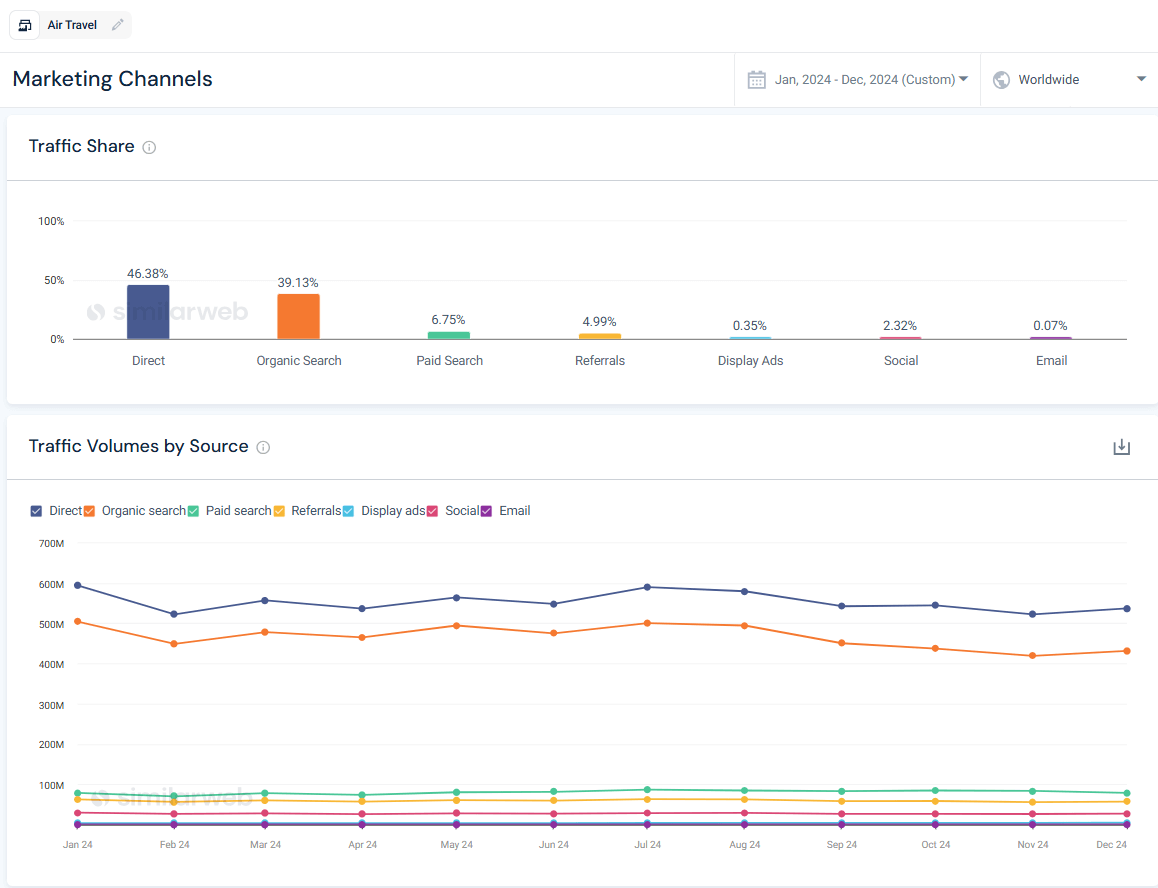
- Giants receive around 12.2 million visits per month, with direct traffic making up 55% of total visits.
- Challengers have 649.4 thousand monthly visits on average, of which 41% is direct traffic.
- Up-and-Comers have only 68.8 thousand visits per month, with direct and organic traffic each comprising 35%.
- Organic search accounts for 33%, while paid and referral traffic are less significant compared to other industries. Giants’ reliance on direct traffic underlines the importance of brand recognition.
- Marketing channel distribution for the entire category during 2024:
Key takeaways
- Direct traffic: Giants in most industries benefit significantly from direct traffic, indicating strong brand recognition and loyalty.
- Organic traffic: For Challengers and Up-and-Comers, organic search is a major growth driver. Businesses in these categories should focus on SEO, particularly for non-branded keywords.
- Paid and social channels: Paid traffic tends to have a higher ROI for Giants, while Up-and-Comers and Challengers may use social channels more effectively to build brand awareness.
These benchmarks provide actionable insights for businesses, allowing them to align their traffic strategies with industry norms and capitalize on untapped opportunities.
Key metrics for website traffic benchmarking
When tracking website traffic, it’s important to watch the right metrics. These indicators provide insights into user behavior, helping to identify strengths and areas for improvement.
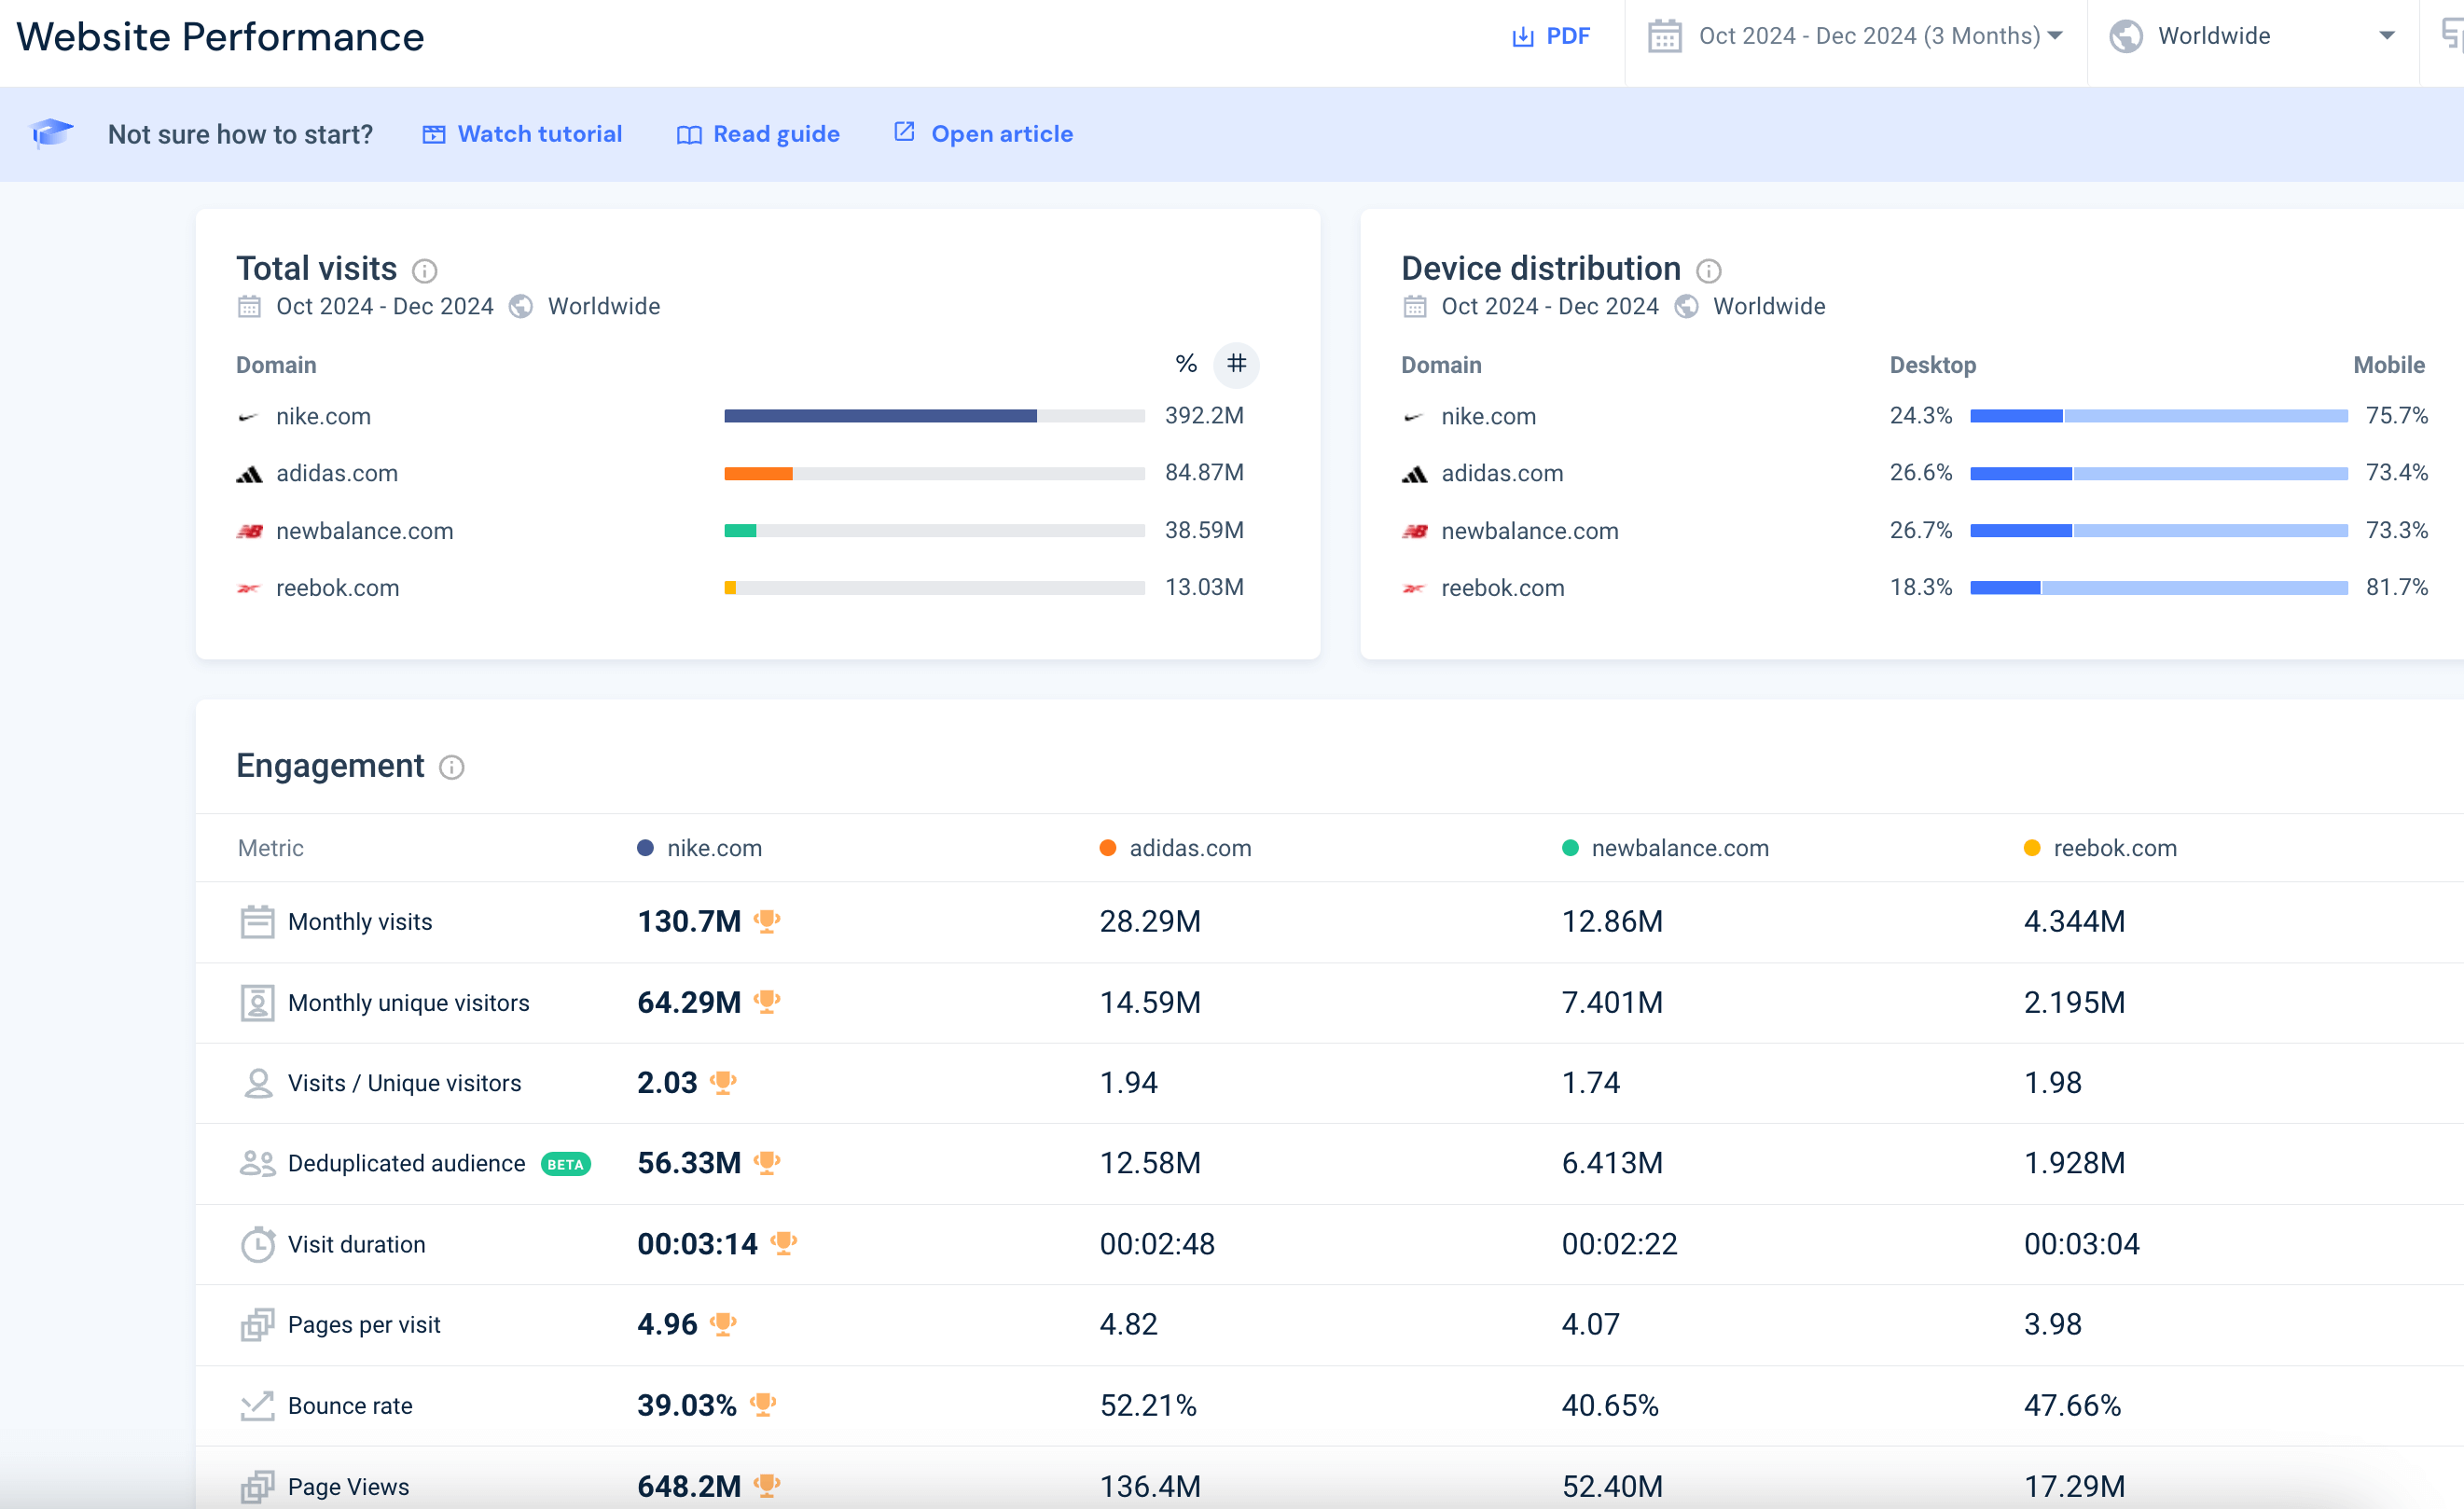
With tools like Google Analytics and Similarweb, you can easily access detailed reports on user engagement. For example, Similarweb’s Website Performance report shows the number of visits, device distribution, and engagement metrics like unique visitors and visit duration. It can show the same metrics for multiple competitors, creating an instant traffic benchmark.
Here are some of the most important metrics you should track:
Visits / Unique visitors
Visits, also known as sessions, represent the number of times users enter your website over a certain period. If the same user accesses the website multiple times, they are counted as multiple visits. This metric is important as a raw measure of traffic, and because every site visit represents an opportunity to convert website users.
Unique visitors is an estimate of the number of distinct individuals who visit your site within a given period. This metric is vital because it reveals your site’s reach and ability to attract new users. Regularly tracking unique visitors allows you to monitor growth trends and evaluate the effectiveness of campaigns aimed at expanding your audience.
For instance, a spike in unique visitors after launching a new marketing initiative suggests that your efforts successfully attracted fresh traffic. Comparing unique visitors to total visits can also provide insights into visitor engagement, indicating whether users return to your site or leave after a single visit.
Note: Similarweb shows a unique metric called deduplicated audience. This estimates the unique number of users across different devices. Usually, if the same person visits your website from their laptop and their mobile phone, they would be counted as two unique visitors. But in the deduplicated audience metric, they are only counted once.
Visit Duration
Visit duration measures the average amount of time a visitor spends on your website. This metric is a key indicator of content engagement and relevance. Longer visit durations typically suggest that users find your content valuable, while shorter durations may indicate issues such as poor design, irrelevant content, or a lack of clear navigation.
Analyzing visit duration by page or site section can help you identify which parts of your website perform well and which need improvement. For example, blog pages with high visit durations might inspire a strategy to create more long-form content, while pages with low durations may require updates to improve usability or clarity.
Pages Per Visit
Pages per visit refers to the average number of pages a user views during a single session. This metric sheds light on how effectively your site encourages exploration. A high number of pages per visit indicates that users are engaged and find your site easy to navigate, while a low number may signal poor internal linking or irrelevant content.
Improving pages per visit involves strategies such as adding related links, creating content hubs, or optimizing call-to-action buttons. Tracking this metric over time allows you to assess the impact of these changes and refine your approach to user engagement.
Bounce Rate
The bounce rate measures the percentage of visitors who leave your website after viewing only one page. A high bounce rate often indicates a mismatch between user expectations and your content, slow load times, or poor mobile optimization.
Reducing your bounce rate may involve improving your site’s design, ensuring faster load speeds, and crafting compelling content that aligns with user intent. Additionally, implementing clear and enticing calls-to-action can encourage visitors to explore more pages, driving engagement and reducing bounces.
Page Views
Page views is a raw metric that tracks the number of pages viewed on your site, including repeated views of the same page by a single user. Each visit, or session, might include multiple page views. It is usually not recommended to use this metric on its own, however, in combination with other metrics it can provide valuable information. Page views are the basis for calculating important metrics like pages per visit and bounce rate.
Benchmarking traffic sources
Understanding traffic sources is key to crafting successful marketing strategies. Website visitors come from various channels, each offering unique engagement opportunities. By analyzing these sources, you can better allocate resources to maximize results.
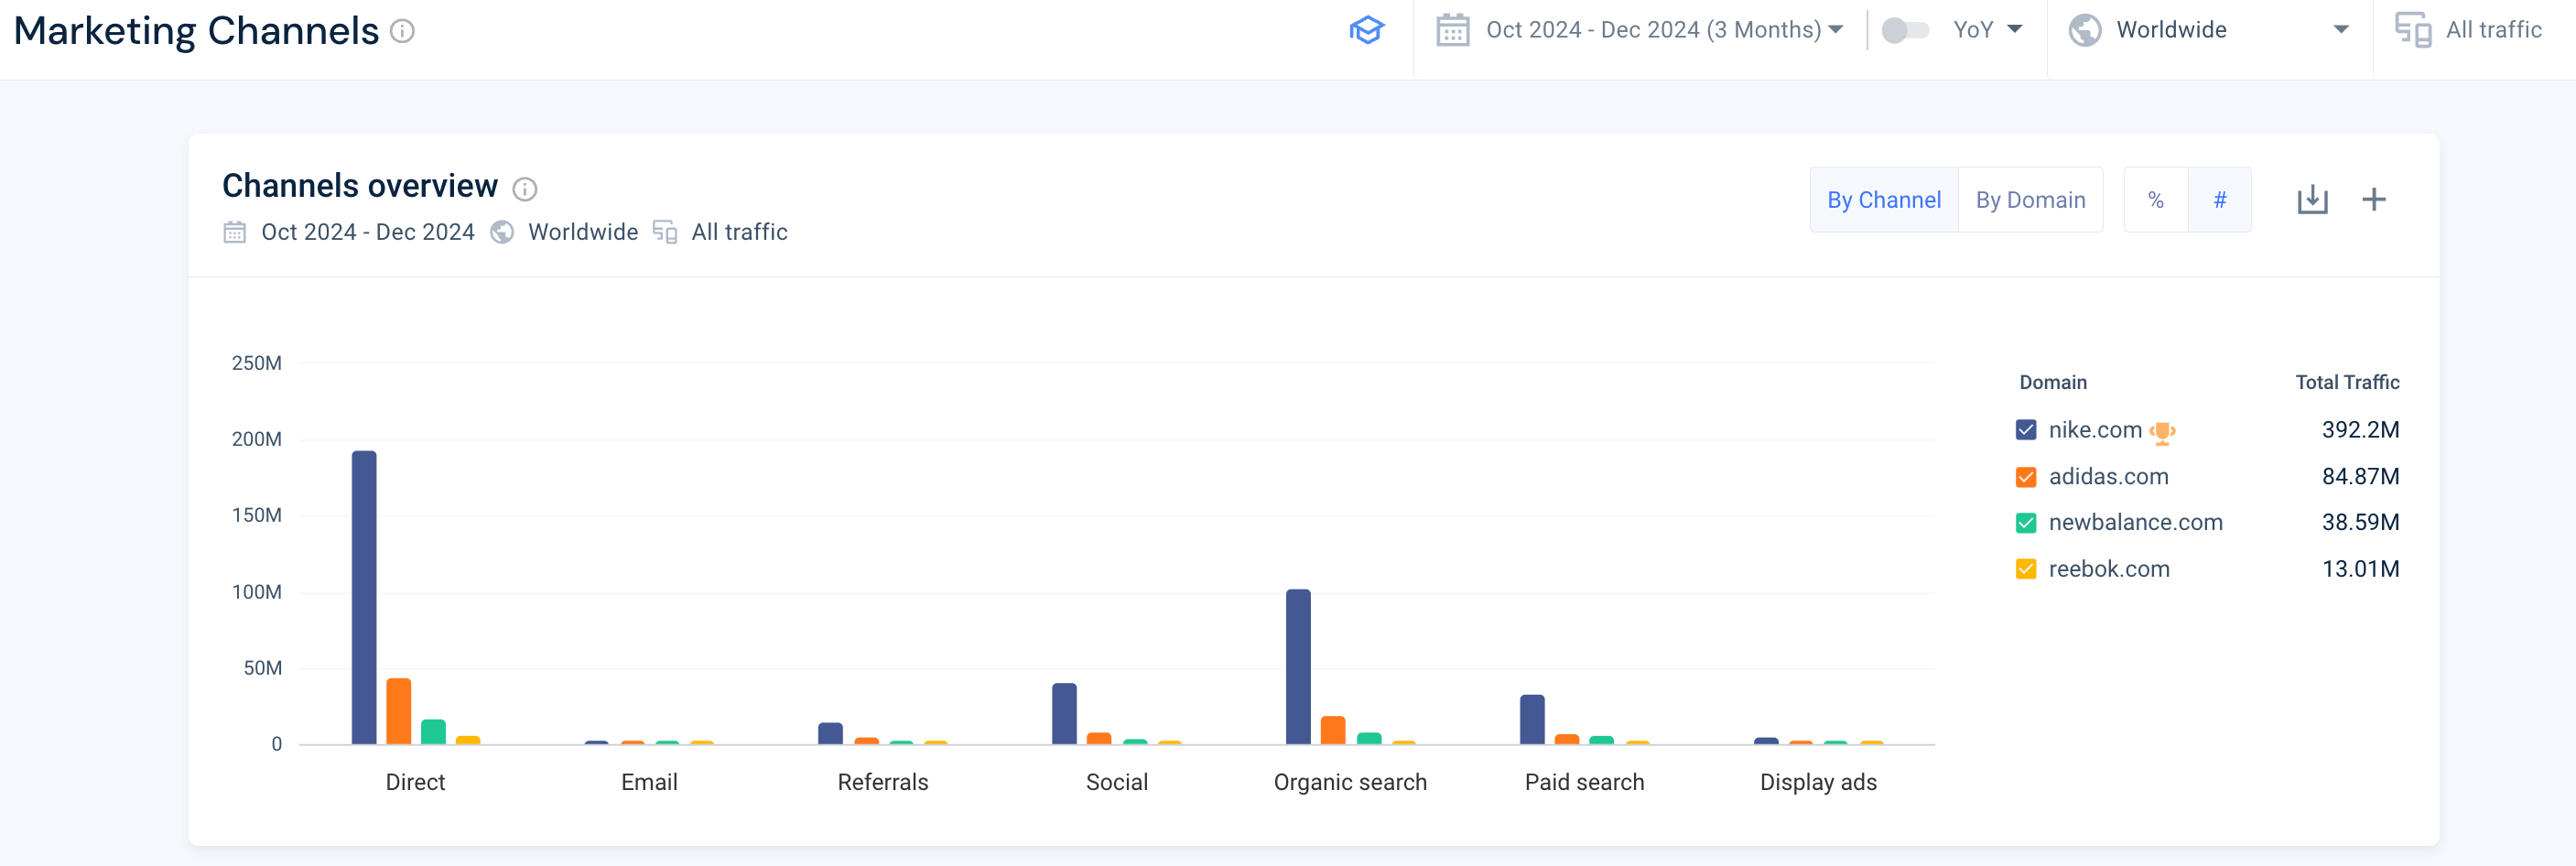
The Similarweb Marketing Channels report shows traffic across different channels for your website, with the ability to add competitors. Below you can see traffic by channels for Nike as compared to its main competitors. Both Nike and its competitors rely on direct traffic, then organic traffic, as the top channels to drive website visitors.
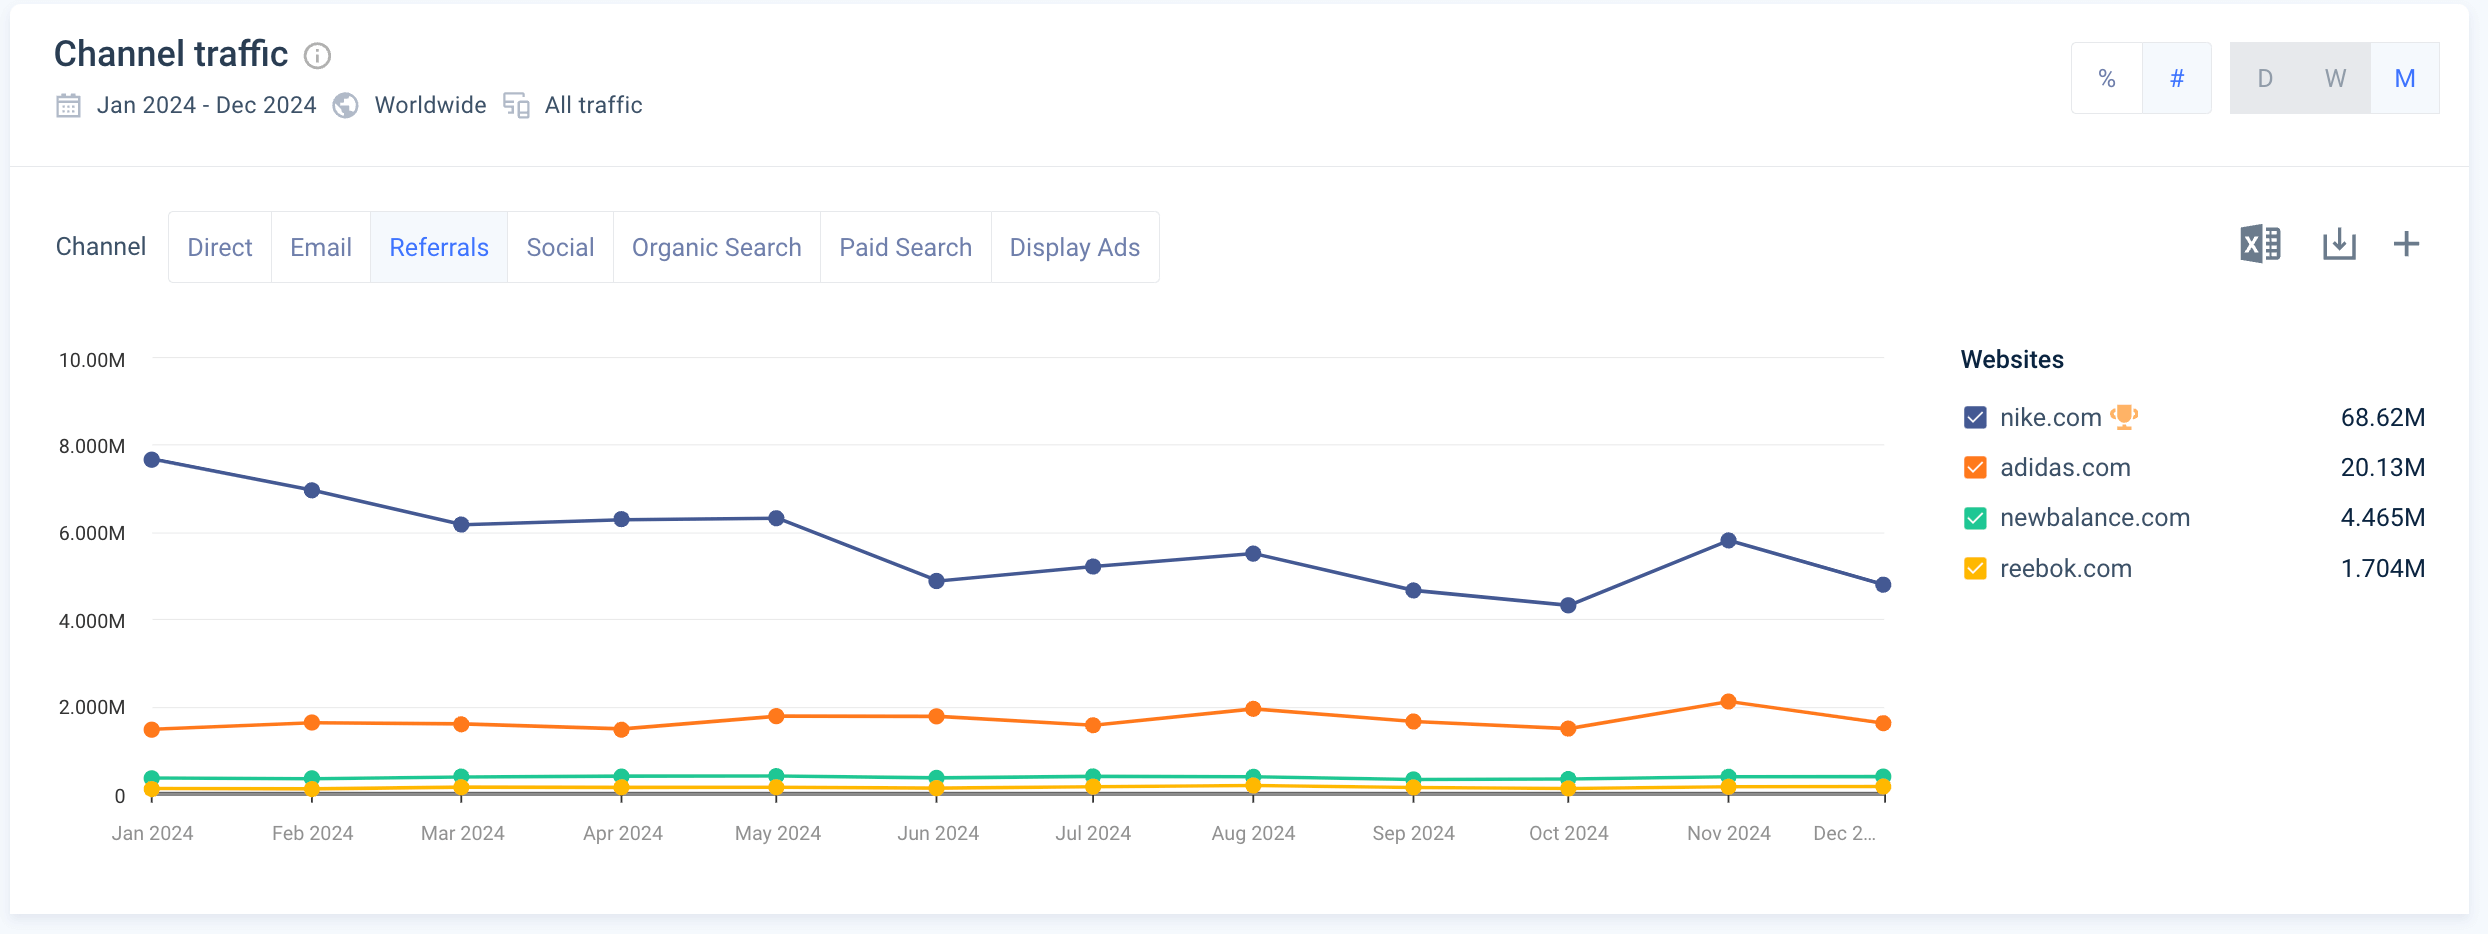
You can also see the development of channel traffic over time. For example, Similarweb shows that while Nike has more referral traffic than competitors, it has been declining over the past year, while referral traffic to Adidas has significantly increased.
Traffic analysis helps identify your most effective channels, enabling targeted optimization for greater impact. This approach enhances performance and improves your return on investment. Here are the major traffic sources you should analyze:
1. Organic search
Organic search traffic consists of visitors arriving via unpaid search engine results. It’s a reliable, long-term source of high-quality traffic, as these users are actively seeking what your site offers. Comprehensive SEO strategies, including keyword research, on-page optimization, and authoritative backlinks, are key to improving search visibility and capturing this valuable audience. Consistent content updates and technical SEO audits help maintain competitiveness in search rankings.
Organic traffic is typically more engaged and likely to convert than other sources, making it a cost-effective channel over time. By investing in robust SEO tactics, you can build a sustained flow of qualified visitors with higher conversion potential. Regular analysis of search trends and performance metrics ensures your content remains relevant and competitive.
2. Paid search
Paid search involves running ads on search engines to attract targeted traffic. While this approach requires investment, it offers precise control over who sees your ads, enabling immediate visibility and engagement from specific audiences. Effective use of paid search can complement SEO efforts by driving traffic during key periods, such as product launches or special promotions.
Success with paid search depends on continuous optimization. Monitoring conversion rates and return on ad spend (ROAS) helps refine targeting and improve results. By analyzing campaign data, you can adjust keyword bids, ad copy, and audience settings to maximize performance.
3. Display ads
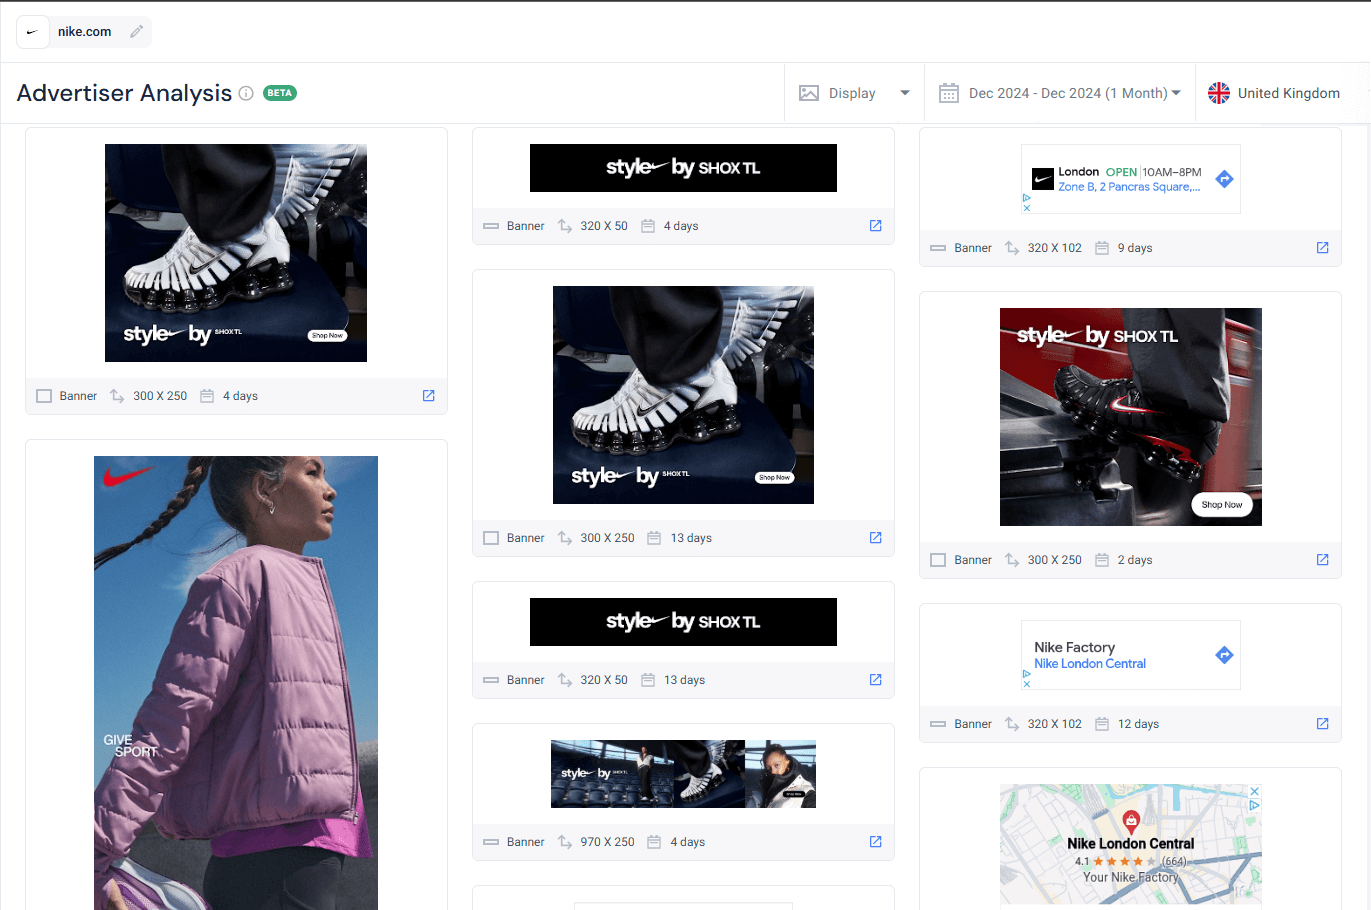
Display ad traffic comes from users who click on visual advertisements placed on websites, apps, or social platforms. These ads, often in the form of banners or videos, are designed to capture attention and drive awareness. Display ads are particularly useful for reaching new audiences and retargeting previous visitors to your site.
Similarweb’s Ad Intelligence gives you access to your competitors’ display ads, allowing you to analyze their ads before you create your own.
To maximize display ad effectiveness, focus on clear visuals, compelling copy, and strong calls to action. Leveraging programmatic advertising tools enables precise targeting based on demographics, behavior, and interests. Regularly analyzing metrics such as impressions, click-through rates, and conversion rates helps refine ad placement and design for better performance.
4. Direct traffic
Direct traffic refers to users who access your website by typing the URL directly into their browser or using bookmarks. This type of traffic often indicates strong brand recognition and loyalty, as these visitors are typically repeat customers or familiar with your brand. High direct traffic levels suggest effective branding that fosters user trust and engagement.
To further increase direct traffic, focus on consistent branding across all marketing channels. Engaging visitors during their first visit with excellent content and seamless user experience can encourage them to return and bookmark your site. Monitoring direct traffic trends provides valuable insights into the strength of your brand and customer relationships.
Note: Nowadays, a large fraction of direct traffic reported by website analytics tools (like Google Analytics or Adobe Analytics) is not “really” direct. Rather, it represents other types of traffic that cannot be accurately tracked, due to legal restrictions or user-applied privacy measures like ad blockers. Similarweb overcomes this restriction, using unique data sources to accurately estimate “true” direct traffic for websites.
5. Referral traffic
Referral traffic originates from external websites linking to yours, such as blogs, news sites, or forums. These visitors often carry trust from their originating site and tend to be highly engaged. Building referral traffic involves forming strategic partnerships and securing backlinks from reputable sources. Each backlink acts as a vote of confidence, boosting both traffic and search engine authority.
To maximize referral traffic, focus on acquiring links from industry-relevant sites. This approach enhances referral credibility and can significantly increase engagement. Participation in guest blogging, industry forums, and strategic partnerships are effective ways to build a robust referral network. Monitoring referral sources helps identify your most valuable partners and informs targeted relationship-building efforts.
6. Social media
Social media traffic comes from platforms like Facebook, X, Instagram, and LinkedIn. High traffic from these sources indicates strong content resonance with your audience. Social media’s visual and interactive nature allows rapid sharing and engagement, making it ideal for promoting content like blog posts, videos, and infographics. Hashtags and SEO-friendly descriptions enhance visibility and engagement.
To maximize social media traffic, tailor content to each platform’s unique style and demographic. Consistent branding and targeted messaging increase user interaction and shares. Social media analytics provide insights into user behavior, enabling data-driven adjustments to your strategy. Regular monitoring of engagement metrics helps refine content and stay aligned with audience preferences.
7. Email
Email traffic comes from visitors who click on links in your email campaigns, such as newsletters or promotional messages. This channel is highly effective for nurturing existing customers and driving repeat visits. Personalized email content, segmented lists, and strong call-to-actions are key to increasing engagement and click-through rates.
Tracking email metrics like open rates, click-through rates, and conversion rates provides insights into campaign effectiveness. High email traffic often reflects well-targeted and engaging content. To optimize this channel, continuously expand and refine your email lists, and regularly test subject lines, email designs, and audience segmentation. Automated email workflows, such as welcome series or abandoned cart reminders, can further enhance traffic and conversions over time.
Tools for website traffic benchmarking
Effective website traffic analysis relies on tools that provide actionable insights. With the right software, you can monitor performance, identify trends, and make data-driven decisions. These tools offer valuable information on visitor behavior to your site and your competitors, helping you refine strategies and enhance user engagement.
1. Google Analytics 4
Google Analytics 4 (GA4), provided free for most websites, is probably the most commonly used tool for measuring and analyzing website traffic. It provides insights into user behavior on your websites and mobile apps. Its event-based model enables detailed tracking of user interactions, from clicks and scrolls to downloads and form submissions, but can be complex to implement and understand. Many website owners do not implement GA4 correctly, or find it difficult to interpret its metrics.
GA4’s customizable dashboards allow users to view key metrics such as sessions, bounce rates, and conversions. Additionally, GA4 is able to track cross-device journeys, making it possible to provide a broad view of user interactions. But again, these capabilities are difficult to implement and use for users who are not analytics experts. Another key limitation of Google Analytics is that it does not provide data for competitor websites and apps.
2. Similarweb
Similarweb is a powerful tool for competitive analysis, offering insights into your competitors’ traffic sources and market share. It provides reliable data on visitor demographics, user engagement, and traffic distribution across different marketing channels, for almost any website on the Internet. These insights enable businesses to benchmark performance against competitors and identify areas for growth.
With Similarweb, users can track industry trends and analyze how competitors distribute traffic across channels such as direct, referral, and social. This information helps refine marketing strategies and optimize resource allocation. Similarweb’s actionable data empowers businesses to develop targeted campaigns and stay competitive in their market. Similarweb also offers a range of free tools like Website Traffic Checker, where you can see this data in a limited form about any domain.
3. Adobe Analytics
Adobe Analytics is an enterprise-level tool designed for businesses seeking advanced insights into customer behavior. Unlike Google Analytics it does not have a free version. Its primary strength lies in its ability to process large volumes of data from various channels, including websites, apps, and offline sources. Its Adobe Sensei module uses machine learning to uncover patterns and predict future trends.
Adobe Analytics supports deep segmentation, allowing users to analyze specific audience groups based on criteria such as demographics, location, or behavior. Its advanced attribution models help marketers understand the impact of each touchpoint in the customer journey, enabling data-driven decisions for campaign optimization.
4. Microsoft Clarity
Microsoft Clarity is a free analytics tool that specializes in visualizing user behavior on websites. Its standout features include heatmaps, session recordings, and an easy-to-understand dashboard that highlights key user interaction metrics. Clarity helps identify friction points in user journeys, such as excessive scrolling or repeated clicks, which often indicate frustration or confusion.
Clarity’s “rage click” and “dead click” tracking features help pinpoint areas where users encounter issues. These insights help businesses prioritize improvements that enhance usability and engagement. Clarity emphasizes simplicity, making it accessible even for small teams or individuals with limited analytics experience. Additionally, Clarity ensures privacy compliance by automatically masking sensitive data.
5. Hotjar
Hotjar focuses on user interaction through heatmaps and session recordings. These features provide detailed insights into user navigation, highlighting frequently clicked areas and identifying engagement hotspots. By revealing user behavior patterns, Hotjar helps identify potential UX issues that might not be apparent from raw data alone.
Heatmaps and session recordings offer valuable insights into how users interact with your site, informing design and content improvements. User feedback tools, such as surveys and polls, provide additional context to data-driven observations, combining quantitative with qualitative data.
Strategies to increase website traffic
Driving traffic to a website involves a combination of strategies tailored to attract and retain visitors. This includes optimizing for search engines, engaging users through social media, and creating compelling and user-friendly experiences. Here are some of the strategies you can use to increase website traffic:
1. SEO best practices
SEO is key to improving website visibility and increasing organic traffic. Start by conducting thorough keyword research to identify terms that align with user search intent. Use these keywords strategically in titles, meta descriptions, and content to enhance on-page SEO. Additionally, optimize technical aspects of your site, such as fixing broken links, creating a sitemap, and improving loading speed and mobile compatibility, to support search engine indexing and ranking.
Success in SEO requires staying current with evolving algorithms and trends. Regular site audits help maintain technical readiness and identify areas for improvement. By combining on-page optimization, backlink-building strategies, and technical SEO, you can improve your site’s search rankings and sustain long-term traffic growth.
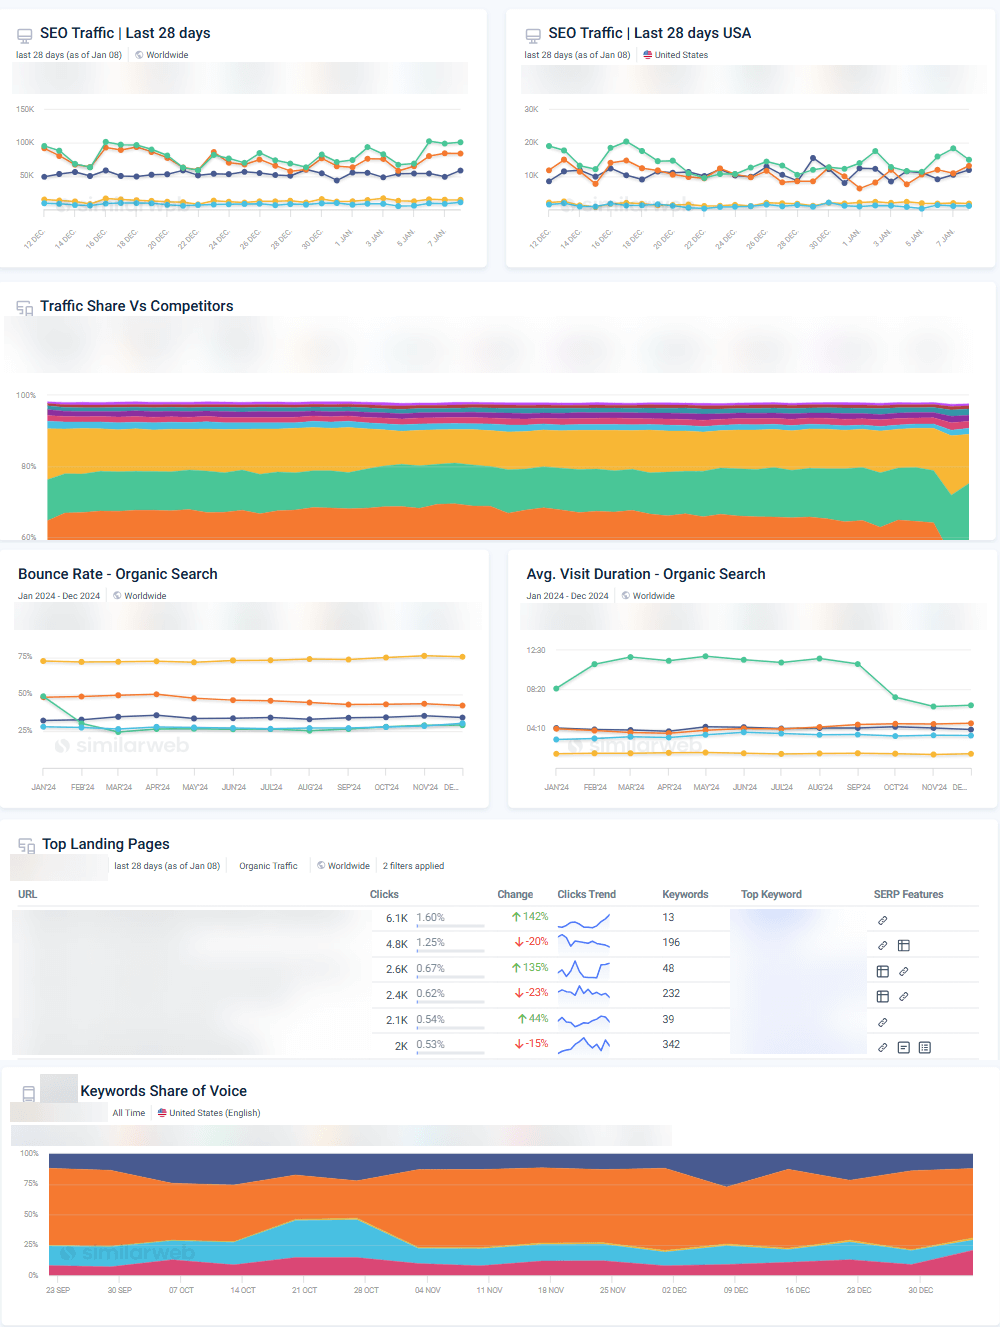
Similarweb offers a complete set of SEO tools that includes everything mentioned above – from keyword research tools to backlink analytics and site audit tools, plus the ability to create custom dashboards and monitor your activity as well as market share – all in one place.
2. Content marketing strategies
Consistency is key to content marketing success. Regularly publishing blogs, videos, and infographics, helps establish your brand as an industry authority. Educational and informative content engages existing users while attracting new audiences. Evergreen content ensures lasting relevance, while timely content attracts new audiences.
Effective content marketing relies on understanding your audience’s preferences and delivering content that meets their needs. Maintaining a content calendar helps organize and maintain consistent output across channels. A well-planned content strategy, grounded in audience insights, builds trust and drives sustained traffic growth.
3. Social media engagement
Social media is a powerful tool for driving website traffic. Regular engagement with your audience on platforms like Instagram, Facebook, X, and Reddit, helps build community and boost traffic. Sharing posts, engaging in discussions, and responding to comments fosters connections and encourages followers to explore your website.
Success in social media requires understanding each platform’s unique dynamics. Tailoring content to match platform-specific styles and demographics maximizes engagement. Leveraging analytics tools, such as X Analytics or Facebook Insights, provides insights into audience preferences and behavior. Using these insights, you can refine your approach and create strategies that effectively convert social interactions into website visits.
4. Mobile optimization
With the growing prevalence of mobile internet use, optimizing your website for mobile devices is essential. Responsive design ensures that your site functions and displays well on all screen sizes. Fast load times and seamless navigation are critical to preventing user drop-offs and improving the mobile experience.
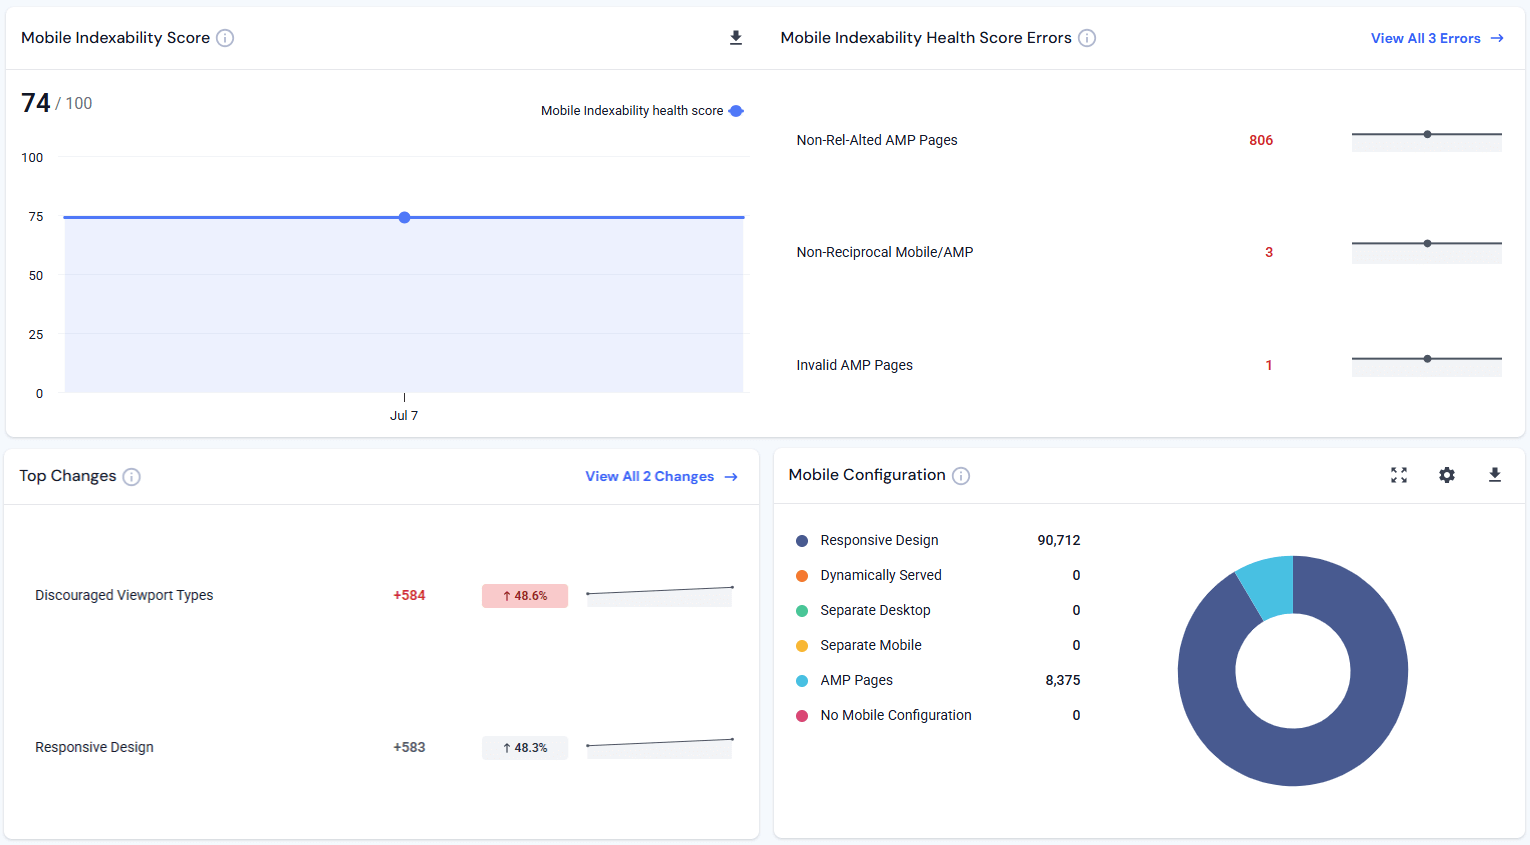
Mobile-friendly websites also improve search rankings, as search engines prioritize sites optimized for mobile. You can easily track your mobile website status with Similarweb’s site audit tool. It will allow you to inspect, track, schedule, and create tasks directly from the UI, helping you optimize your mobile website and making sure you provide the best experience to your users.
Developing a mobile app can complement your website by providing an enhanced user experience for mobile users. Apps often offer faster load times, offline access, and personalized features, making them more appealing to frequent users. By creating a mobile app, you can improve user engagement, build brand loyalty, and increase traffic through push notifications and in-app promotions.
5. User experience improvements
A positive user experience (UX) is key to reducing bounce rates and increasing return visits. Start with a clean, intuitive design that makes navigation straightforward. Use clear calls-to-action (CTAs) and an easily navigable structure to guide visitors smoothly through your site.
UX design also considers accessibility, ensuring the site is usable for all visitors. Conducting regular usability tests helps identify and address friction points in the user journey. By continuously improving UX through design, speed, and accessibility enhancements, you can increase user satisfaction, foster loyalty, and transform first-time visitors into repeat customers.
Best practices for leveraging website traffic data
Effective use of website traffic data is key to online success. Consistently monitoring traffic provides invaluable insights into visitor behavior and site performance. By interpreting this data, you can identify trends, optimize resources, and implement targeted improvements to enhance user satisfaction and engagement. Here are some of the best practices for leveraging website traffic data effectively:
1. Setting realistic traffic goals
Establishing realistic traffic goals starts with understanding your current baseline and industry benchmarks. This helps set achievable targets tailored to your business’s needs. By focusing on metrics like unique visitors, visit duration, and pages per visit, you can develop actionable strategies that drive meaningful progress.
Clear and realistic goals provide direction for your marketing and content efforts. Breaking long-term objectives into smaller, measurable milestones makes progress easier to track and builds momentum toward larger achievements. Regularly update your targets to reflect market changes.
2. Regular traffic monitoring
Consistent traffic monitoring helps you stay informed about your website’s performance and respond to changes in real-time. By regularly reviewing visitor numbers, engagement metrics, and conversion rates, you can quickly identify trends and adjust strategies as needed.
Similarweb provides up-to-date traffic numbers for your website and your industry, enabling data-driven decisions and timely optimization. With constant visibility into site performance, you can proactively address issues and capitalize on opportunities. Our traffic data is also available for extraction via our Data hub and Website traffic API.
3. Competitor traffic analysis
Analyzing competitor traffic provides valuable insights into their success strategies. By examining their content, backlinks, and engagement metrics, you can identify effective tactics and market gaps. Competitive analysis helps refine your marketing approach and seize opportunities they may have missed.
Data from competitor analysis provides benchmarks to measure your performance against and informs adjustments to your strategies. This analysis helps you stay competitive and maintain market relevance. By incorporating competitor insights into your plans, you can develop more effective strategies and improve your market positioning.
4. Data-driven decision making
Data-driven decision-making turns website analytics into actionable insights. Continuous analysis of visitor patterns informs strategic adjustments that enhance outcomes. Data-driven strategies are more effective because they are based on actual behavior and trends.
Accurate data enables better targeting of marketing resources and identification of channels with the best ROI. Using tools that provide reliable information helps you confidently test new ideas and measure their impact.
5. Continuous optimization
Regular audits are essential to maintain website competitiveness. By reviewing structure, content, and technical aspects, you can identify opportunities for improvement and address performance gaps. Continuous optimization ensures your site remains up-to-date and aligned with market trends.
Frequent technical and content updates keep your website fresh and visitor-friendly. Regular testing of new features or layouts provides insights into user preferences, helping you stay relevant. Continuous optimization supports sustained traffic growth and conversion rates by ensuring your site meets user expectations and market demands.
Benchmarking and growing website traffic with Similarweb
Website traffic benchmarking is more than just a measurement tool—it’s a catalyst for growth and innovation. Similarweb can help you track website performance metrics and compare them to industry standards, uncovering valuable insights that can help you optimize marketing strategies. With traffic data from Similarweb, you can refine inbound tactics, optimize paid advertising strategies, and identify untapped opportunities to grow your audience.
FAQs
What is website traffic benchmarking?
Website traffic benchmarking involves comparing your website’s performance metrics (such as visits, bounce rates, and engagement) against industry standards. This process helps identify traffic gaps, set realistic goals, and refine strategies to improve your site’s effectiveness.
What metrics are commonly used in website traffic benchmarking?
Key metrics include:
- Visits and unique visitors: Measures overall traffic and audience reach.
- Visit duration: Tracks the time users spend on your site, indicating content engagement.
- Pages per visit: Reflects how well your site encourages exploration.
- Bounce rate: Indicates the percentage of visitors who leave after viewing one page.
How does company size affect website traffic benchmarks?
Larger companies typically attract higher traffic due to extensive resources and established brand presence. However, small companies can achieve high traffic through niche targeting, innovative content strategies, and aggressive marketing.
What are the primary sources of website traffic?
The main traffic sources include:
- Organic search: Visitors arriving via unpaid search engine results.
- Paid search: Traffic generated through search ads.
- Referral traffic: Visitors from external links on other sites.
- Social media: Traffic from platforms like Instagram, LinkedIn, or X.
- Direct traffic: Users accessing your site directly by entering the URL.
How can companies use benchmarking data to improve website performance?
Companies can identify growth opportunities by comparing their traffic metrics to competitors. For example:
- Adjusting SEO strategies based on competitor keyword performance.
- Refining content strategies to match trends in engagement.
- Improving mobile usability if competitors outperform in mobile traffic.
How much traffic do websites get on average?
Based on HubSpot data:
- 46% of sites receive 1,001–15,000 visitors.
- 19.3% receive 15,001–50,000 visitors.
- Larger sites (10 million+ visits) represent only 0.5% of respondents.
How does device usage impact website traffic?
Mobile devices account for the majority of traffic (41%), followed by desktops (38%) and tablets (19%). This underscores the need for mobile-friendly designs to attract and retain users effectively.
2 Sources
- Hubspot (image). https://www.hubspot.com/hs-fs/hubfs/how-many-visitors-should-your-site-get_7.webp
- Hubspot (image). https://www.hubspot.com/hs-fs/hubfs/how-many-visitors-should-your-site-get_1.webp
Benchmark like a boss with fresh competitive data
Contact us to set up a call with a market research specialist
