


Core Web Vitals for SEO: How to Measure and Improve Them

In May 2020, Google introduced Core Web Vitals and this has reshaped how websites and pages are ranked. While relevance and search intent remain top priorities, Core Web Vitals added a new dimension by focusing on user experience.
These metrics measure how visitors interact with your site, and those pages that are able to meet these standards gain the edge when it comes to search rankings.
In this post, we’ll explain what Core Web Vitals are and how to optimize your site for Google’s user metrics.
What are Core Web Vitals?
Core Web Vitals are a component of Google’s initiative to improve the overall user experience on the web. These metrics assess a website’s speed, responsiveness, and visual stability. Optimizing Core Web Vitals is a key aspect of technical SEO and can contribute to better search rankings. While they serve as a minor ranking signal, their primary impact lies in improving user experience.
- Page load speed: How quickly a page’s content is visible to the user
- Interactivity (responsiveness): How quickly a page responds to user inputs, such as clicks or taps
- Visual stability: How stable a page’s layout is during loading, avoiding unexpected shifts
To evaluate these aspects of user experience, Google introduced Core Web Vitals, a set of specific metrics that quantify speed, responsiveness, and visual stability. These metrics help developers and SEOs optimize websites to better align with user expectations.
Know your Core Web Vitals
Tracking web performance metrics over time provides valuable insights into your site’s health and user experience. Below is a detailed breakdown of the Core Web Vitals and some additional important web performance metrics:
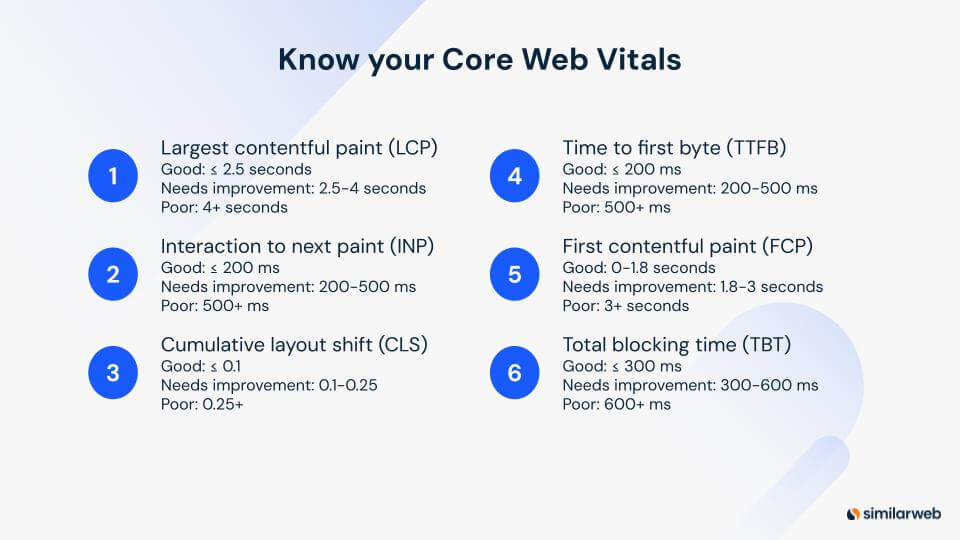
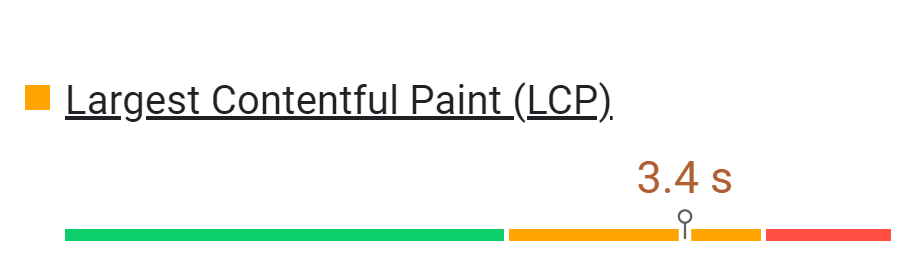
1. Largest Contentful Paint (LCP)
- Good: ≤ 2.5 seconds
- Needs improvement: 2.5–4 seconds
- Poor: 4+ seconds
LCP measures the time taken to load the largest visible content in the user’s viewport. Ideally, this should happen in less than 2.5 seconds to provide a positive user experience.
How to improve LCP:
- Reduce server response times
- Optimize and resize images
- Minimize CSS blocking and fine-tune stylesheets
A fast LCP creates a perception of efficiency and encourages users to engage with your site. The quicker users can see the main content, the better their experience.
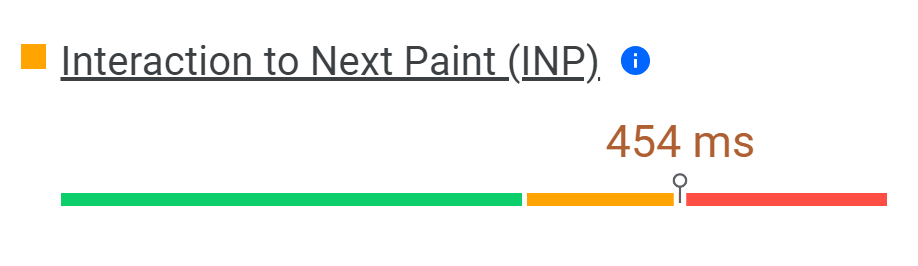
2. Interaction to Next Paint (INP)
- Good: ≤ 200 milliseconds
- Needs improvement: 200–500 milliseconds
- Poor: 500+ milliseconds
INP evaluates how quickly a page responds to user interactions. For an optimal user experience, aim for an INP of less than 200 milliseconds.
How to Improve INP:
- Reduce JavaScript execution time
- Use code-splitting to fetch only necessary assets
Quick responses prevent user frustration and keep interactions smooth.
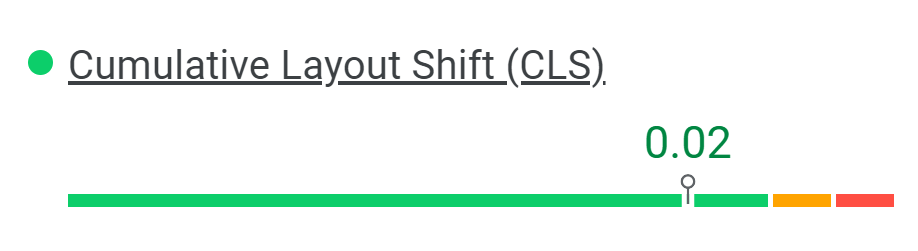
3. Cumulative Layout Shift (CLS)
- Good: ≤ 0.1
- Needs improvement: 0.1–0.25
- Poor: 0.25+
CLS measures visual stability by tracking unexpected layout shifts during loading. A score under 0.1 ensures a stable page with minimal disruptions.
How to improve CLS:
- Reserve space for images, ads, and other dynamic content
- Avoid inserting new content above existing content during load
Stable layouts keep users focused and prevent frustration caused by unexpected visual disruptions.
4. Time to First Byte (TTFB)
- Good: ≤ 200 milliseconds
- Needs improvement: 200–500 milliseconds
- Poor: 500+ milliseconds
TTFB measures the time it takes for the server to respond to the initial request. A TTFB under 200 milliseconds is considered ideal.
How to improve TTFB:
- Use faster servers or Content Delivery Networks (CDNs)
- Optimize database queries.
Faster server responses reassure users that the site is responsive, creating a better first impression.
5. First Contentful Paint (FCP)
- Good: 0–1.8 seconds
- Needs improvement: 1.8–3 seconds
- Poor: 3+ seconds
FCP gauges the time it takes for the first piece of content to render on a page. A good FCP is less than 1.8 seconds.
How to improve FCP:
- Optimize CSS and use lightweight frameworks.
- Prioritize loading critical content first.
A fast FCP reassures users that the page is loading, reducing the likelihood of them bouncing.
6. Total Blocking Time (TBT)
- Good: ≤ 300 milliseconds
- Needs improvement: 300–600 milliseconds
- Poor: 600+ milliseconds
TBT calculates the total time a page remains unresponsive to user inputs during its load. Keeping TBT under 300 milliseconds enhances interactivity.
How to improve TBT:
- Minimize JavaScript execution time
- Offload non-critical tasks to run in the background
A low TBT ensures smooth page responsiveness and correlates with a fast, interactive experience.
Retired Core Web Vitals
As web technology has evolved, several metrics have been retired from Google’s Core Web Vitals due to their inconsistency, sensitivity to minor variations, or reliance on outdated browser-specific behaviors. These metrics have been replaced by more reliable and standardized alternatives, ensuring a more accurate representation of user experience and page performance.
1. First Input Delay (FID)
What it measured:
FID captured the time from when a user first interacted with a page (e.g., clicking a button) to when the browser started processing the interaction. A good FID score was under 100 milliseconds, emphasizing quick response times for smoother user experiences.
Why it was retired:
FID was replaced by the more comprehensive Interaction to Next Paint (INP) metric, which provides a broader assessment of interactivity. Support for FID officially ended on September 9, 2024.
Suggested replacement:
Focus on INP for a more reliable and inclusive measure of interactivity and performance.
2. Time to Interactive (TTI)
What it measured:
TTI assessed the time it took for a webpage to become fully usable and interactive. A good TTI was typically under 5 seconds. Improvements often involved minimizing unnecessary JavaScript and deferring non-critical scripts.
Why it was retired:
Google found TTI to be overly sensitive to outlier network requests and long tasks, resulting in high variability. It was removed as a metric in Lighthouse 10.
Suggested replacement:
Metrics such as Largest Contentful Paint (LCP), Total Blocking Time (TBT), and Interaction to Next Paint (INP) are now preferred for assessing interactivity and performance more effectively.
3. First Meaningful Paint (FMP)
What it measured:
FMP tracked the time it took for the primary content to render on a webpage. A good score was below 2.5 seconds, often achieved by optimizing rendering paths and minimizing JavaScript blocking.
Why it was retired:
FMP was deprecated in Lighthouse 6.0 due to its sensitivity to minor page load differences, leading to inconsistent results. Its reliance on browser-specific implementation details made it challenging to standardize across all browsers.
Suggested replacement:
Largest Contentful Paint (LCP) is now recommended as a more reliable and consistent metric for measuring loading performance.
4. First CPU Idle
What it measured:
First CPU Idle determined how long it took for a page to become minimally interactive, meaning most UI elements were functional and responded to user inputs within a reasonable time.
Why it was retired:
While some considered First CPU Idle a useful complement to TTI, the differences between the two metrics were not significant enough to justify maintaining both. It was deprecated in Lighthouse 6.0.
Suggested replacement:
Modern metrics like Total Blocking Time (TBT) and Time to Interactive (TTI) are recommended for more accurate reflections of interactivity and user experience.
Why are Core Web Vitals important for SEO?
Core Web Vitals are important as they align with Google’s business goals. Google, as a search engine, makes revenue from selling search ads. If users have a bad user experience when using the platform, they might make fewer searches in the future. Fewer searches mean fewer search ads. Page experience metrics were added to Google’s ranking systems to address this.
Initially, Google’s Page Experience metrics included:
- Mobile-friendliness
- Safe browsing
- HTTPS security
- The presence of intrusive ads
But after extensive user research, Google discovered that site speed is a key part of user experience.
During their research, they discovered that if search results pages were slowed by 100 to 400 milliseconds, Google saw its users make between 0.2% to 0.6% fewer searches during the first three weeks of the experiment. As the experiment progressed, subjects began to make progressively fewer searches.
And as we said before, fewer searches = a lower market share for the search engine.
And that, my friends, is why Core Web Vitals were added to Google’s algorithms in 2020 and why they are so important for SEOs to consider as quality signals today.
Here are five reasons why optimizing these metrics is an important part of your SEO strategy:
1. Improves search rankings
Optimizing Core Web Vitals can enhance your search rankings. Since Google incorporates these metrics into its ranking algorithm, achieving higher scores gives you an edge over competitors. This leads to increased organic traffic, benefiting both user engagement and your site’s overall SEO performance.
2. Enhances user experience
A site that loads quickly and operates smoothly provides a better user experience. Faster websites encourage users to stay longer, explore more pages, and engage more deeply with your content. This positive experience increases the likelihood of conversions and sharing, fostering both user satisfaction and growth.
3. Reduces bounce rates
Smooth, uninterrupted page loads significantly decrease the chances of users leaving prematurely. Lower bounce rates and extended session durations signal to Google that your content is valuable. Optimizing Core Web Vitals helps create an engaging environment that keeps visitors on your site.
4. Boosts conversion rates
Fast, responsive websites drive higher conversion rates. Whether it’s completing a purchase, signing up for a newsletter, or downloading content, users are more likely to act when their interactions are seamless. Optimizing Core Web Vitals directly supports improved user satisfaction and business outcomes.
5. Future-proofing
As Google continues to emphasize user experience in its algorithms, optimizing Core Web Vitals ensures that you remain competitive. By addressing these metrics now, you’ll be better equipped to adapt to future algorithm updates and evolving user expectations, safeguarding your site’s long-term success.
Understanding how Core Web Vitals data works
One of the most important things to know when trying to optimize your Core Web Vitals is what kind of data sources Google uses to calculate it. There are two types of data for Google’s Core Web Vitals:
- Field data
- Lab test data
Understanding this will help you understand how your diagnostic tools work.
1) Field data
Field data is sourced from the Chrome User Experience Report (CrUX), which tracks real Chrome users to capture real-world web performance. This data is collected over a 28-day period, providing insights into how users experience websites in different conditions.
In a perfect world, you should focus on field data. This is because it is data that’s generated from actual users – but sadly, it’s not so simple. Field data isn’t available for all sites. What’s more, since field data is only collected every 28 days, you’ll have to wait 28 days to see the impact of your optimizations.
2) Lab test data
Lab test data is collected artificially in a test environment. It doesn’t come from real-world users but comes from a single device with a predefined location and network connection.
Unlike field data, lab data doesn’t have a 28-day collection period. This means that when you optimize your pages, you can see the effects immediately by running new tests. It has a distinct disadvantage, though, as lab tests are designed only to simulate real-world users. By definition, these metrics are always limited as they can’t possibly take every real-world factor into account.
How to measure Core Web Vitals
Improving your site’s user experience starts by accurately measuring and regularly auditing your Core Web Vitals. These metrics—loading speed, interactivity, and visual stability—are critical indicators of site performance. However, achieving and maintaining high standards requires more than a one-time check. Regular technical site audits and performance reviews are essential to identify and resolve issues promptly. Here’s a look at tools and techniques to measure and audit CWV effectively.
Similarweb Site Audit tool
The Similarweb Site Audit tool is a powerful resource for evaluating and improving Core Web Vitals as part of a comprehensive SEO strategy. Located under the SEO>Experience section, the tool provides an in-depth and easily digestible analysis of your site’s performance.
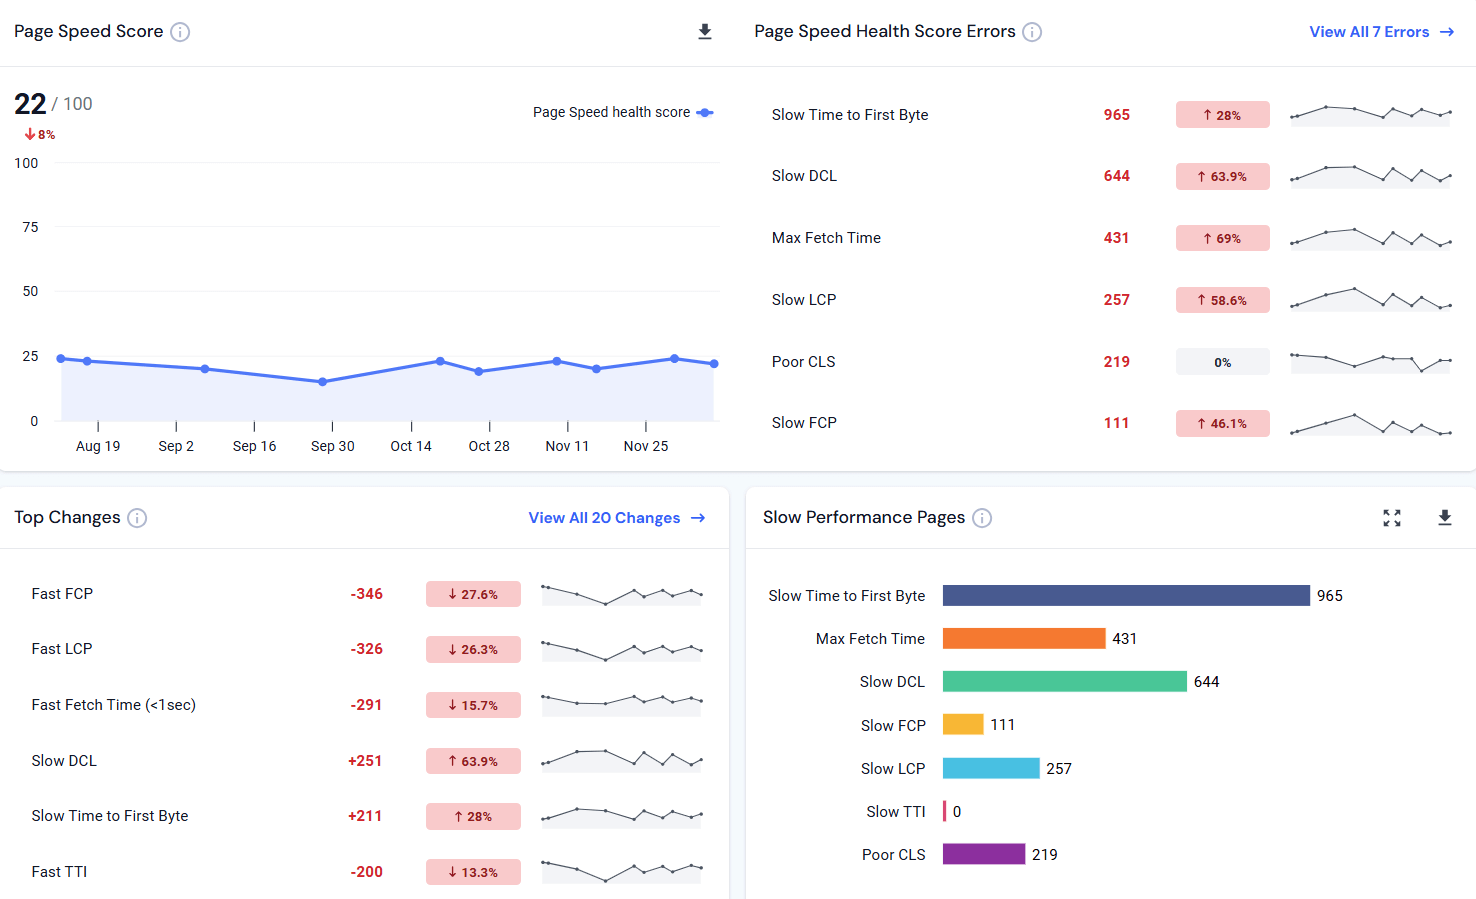
It aggregates data from multiple sources, giving you a well-rounded view of your site’s strengths, weaknesses, and opportunities for improvement. This aggregation is especially useful for pinpointing issues that may be impacting your Core Web Vitals. For example, if your site is slow, the tool identifies specific performance bottlenecks and offers actionable suggestions for speeding it up. These insights help you prioritize the most impactful fixes, ensuring that your optimizations have a direct and measurable effect on both user experience and SEO results.
Another standout feature of the Similarweb Site Audit tool is its ability to facilitate ongoing analysis. This continuous monitoring ensures that you can track the evolution of your Core Web Vitals over time, measure the effectiveness of your optimizations, and quickly address any new issues that arise. By regularly auditing your site with this tool, you can maintain strong performance, stay ahead of potential SEO challenges, and ensure your site consistently meets high user experience standards. This proactive approach not only helps protect your rankings but also positions your site for long-term success in an ever-changing digital landscape.
Google Search Console
Another effective way to monitor Core Web Vitals is through Google Search Console. Under the Experience tab in the left-hand menu, you’ll find the Core Web Vitals report, which provides real user data for the three key metrics:
- Largest Contentful Paint (LCP)
- Interaction to Next Paint (INP)
- Cumulative Layout Shift (CLS)
This report aggregates data from real users, offering URL-level insights to help you easily identify performance issues and take targeted action.
For instance, if a page has a poor LCP score, you can investigate further to understand the cause. By drilling down into the data, you might uncover specific elements contributing to layout shifts (CLS) or delayed rendering. The actionable insights provided by this report make it easier to implement precise fixes that improve user experience and Core Web Vitals scores.

Frequent use of Google Search Console is essential for the ongoing monitoring of your site’s performance. The platform offers valuable insights into potential issues in near real-time, enabling you to address problems promptly before they impact user experience or SEO rankings. By conducting regular audits, you can track the effectiveness of your optimizations over time, ensuring your site maintains strong performance and adapts to evolving requirements.
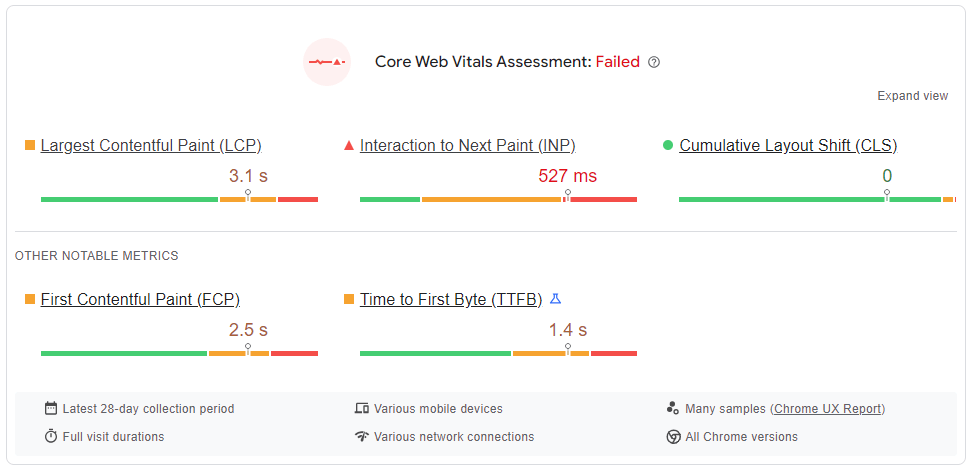
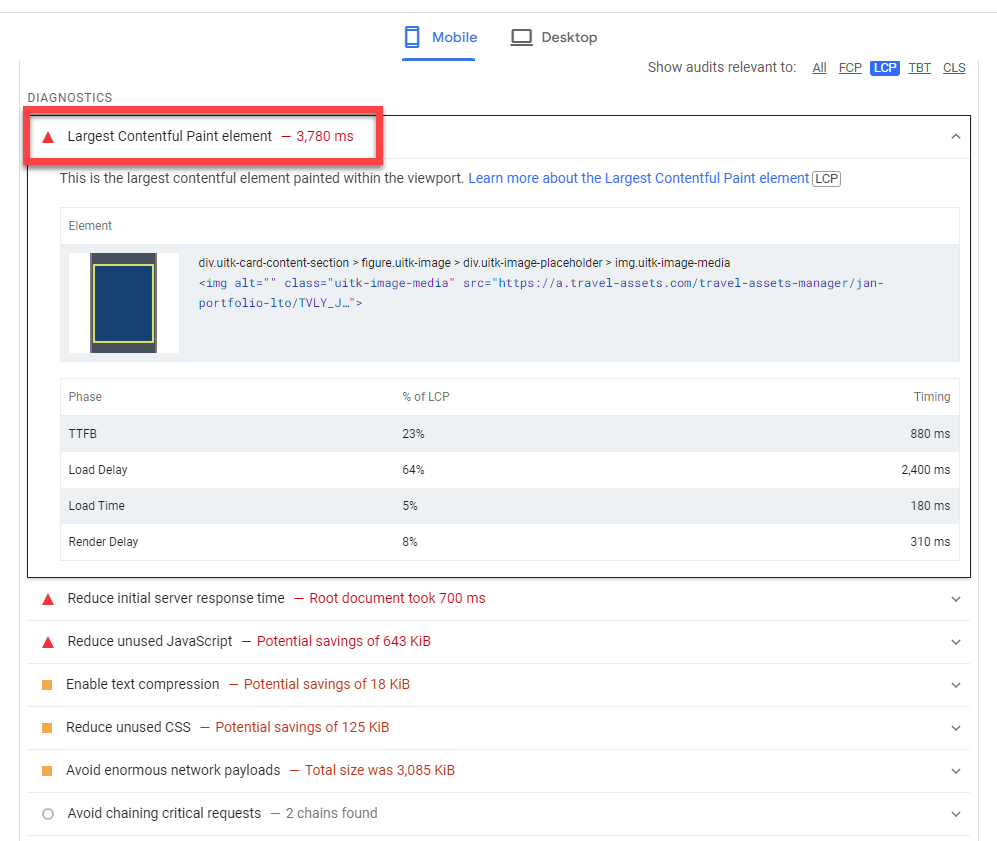
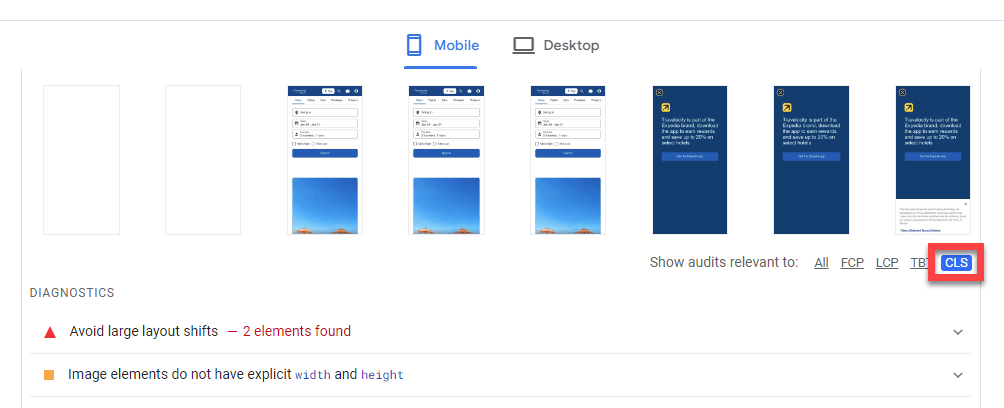
Google PageSpeed Insights
Google PageSpeed Insights is a valuable tool for testing the performance of your mobile and desktop site. It provides your Core Web Vitals scores alongside actionable recommendations to improve them. The tool combines lab data—collected in a controlled, standardized environment with consistent device, server, and network conditions—and field data, which reflects real-world user experiences.
For example, if your Largest Contentful Paint (LCP) score is poor, PageSpeed Insights might suggest compressing images, deferring JavaScript, or optimizing server response times. By implementing these recommendations, you can improve your Core Web Vitals scores, leading to a better user experience and stronger SEO performance.
Running PageSpeed Insights regularly helps you monitor performance fluctuations, particularly after updating content or introducing new site features. Keeping track of your scores ensures that your site’s performance remains stable over time. When issues arise, you can quickly identify and address them, maintaining an optimized and user-friendly website.
Lighthouse
Lighthouse, an integrated tool within Chrome DevTools, provides an in-depth audit of your web pages, including detailed metrics for Core Web Vitals. It goes beyond the Performance panel to deliver a comprehensive evaluation of your site, offering insights into various areas such as accessibility, best practices, SEO, and Progressive Web App (PWA) functionality.
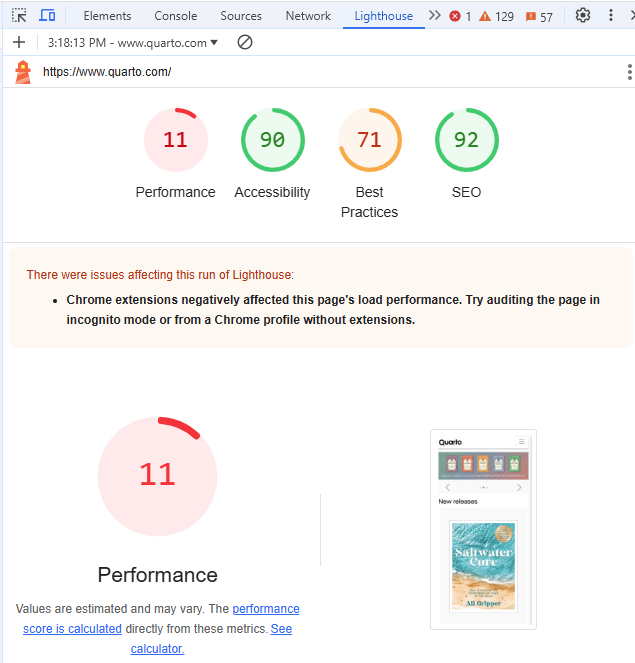
The tool audits your site’s current performance and provides actionable recommendations to improve it further. For SEOs, Lighthouse’s detailed metrics are invaluable for conducting regular performance audits. For instance, if you encounter issues with interactivity, Lighthouse can help pinpoint problem areas, such as excessive JavaScript execution times or resources that need prioritization. These insights enable you to make precise adjustments to optimize your site.
Lighthouse is ideal for SEOs who need thorough diagnostics as part of their regular performance checks. Its comprehensive reporting allows you to stay proactive, ensuring your site performs well and remains resilient to technical issues that could degrade the user experience. By using Lighthouse consistently, you can future-proof your site and maintain a high standard of performance and usability.
Web Vitals Chrome extension
To quickly measure Core Web Vitals on any page you load, install the Web Vitals Chrome extension. This handy tool will display real-time metrics for LCP, INP, and CLS for any page you visit – you can make observations and small tweaks to see instant changes in the design and experience of a page.
This extension is invaluable for SEOs who need to quickly diagnose and address performance issues in real-time. When your boss or a client asks for an immediate assessment of their site’s performance, this tool provides instant feedback without requiring a full audit. The availability of real-time data allows you to quickly confirm whether the changes you make are positively impacting user experience and SEO performance, ensuring swift and effective optimizations.
The Web Vitals Chrome extension allows you to quickly and frequently check your site’s performance. Whether you’re testing during development or after implementing content updates, this tool provides immediate insights into key metrics. These quick checks can help identify potential issues early, inform more comprehensive performance audits, and ensure your site consistently delivers a high-quality user experience.
Chrome User Experience Report (CrUX)
CrUX aggregates real-world user experience data from trillions of page views, providing valuable insights into how your site performs under actual user conditions. By benchmarking your site’s performance against industry standards, you can pinpoint areas where your site excels or falls behind compared to competitors.
Regularly using CrUX helps ensure your site meets or exceeds industry performance benchmarks. By tracking this data over time, you can identify trends, prioritize areas for improvement, and maintain a competitive edge in speed and usability. This ongoing analysis is crucial for delivering a consistently superior user experience.
How to improve your Core Web Vitals
Improving your Core Web Vitals not only enhances user experience but also boosts your SEO performance. Here’s a practical guide to getting your Core Web Vitals into the green:
Optimize your largest contentful paint (LCP)
Users simply don’t want to wait around for a slow page to load. They’d rather interact with the page as soon as possible, and they can only do that once the largest content element has fully loaded.
LCP measures the time it takes for the largest content element – like an image or text block – to fully render on a web page.
If the webpage loads quickly but the main image takes a while to appear, the LCP is delayed. If the essential content loads promptly, you’ve got yourself a fast LCP, improving your overall user experience.
Your target is to get your LCP to be under 2.5 seconds. But sometimes it isn’t always that easy.
Here are the most common causes of LCP issues:
- Large images or media files
- Slow server response time
- Render-blocking resources
- Slow resource load times
- Client-side rendering (CSR)
How to optimize LCP on your site
1. Prioritize the loading of resources
Check that essential resources, such as main content, images, and style sheets, load early in the page lifecycle. Use the preload and prefetch attributes to instruct browsers to prioritize these assets and avoid render-blocking, which occurs when loading is delayed by specific resources.
Preloading important resources like CSS and JavaScript delivers faster initial load times, while lazy loading defers non-important content, such as off-screen images, until needed.
Tools like Lighthouse can help identify resources that block the first paint, allowing you to optimize them effectively. By ensuring that your largest content elements load quickly, users will perceive your site as responsive, even if secondary elements continue loading in the background.
2. Optimize and compress images
Optimize images to improve load times by using modern formats like WebP, which reduce file sizes without compromising quality. Compress images using tools like ImageOptim or TinyPNG, and serve appropriately sized images tailored to each user’s device resolution.
Additionally, define image dimensions in your HTML to prevent Cumulative Layout Shift (CLS) issues, ensuring a stable page layout during loading.
3. Serve files on servers physically close to your users
Leverage a Content Delivery Network (CDN) to distribute your website’s static assets from servers geographically closer to your users. CDNs cache and deliver content quickly, reducing latency and improving load times.
For global audiences, CDNs like Cloudflare or Akamai ensure consistent performance, regardless of the user’s location, making them essential for maintaining a fast-loading site.
4. Host resources on the same server
Hosting static assets—such as CSS, JavaScript, and fonts—on the same server as your HTML content reduces DNS lookups and external requests. This consolidation minimizes latency and accelerates page rendering, helping your site deliver a faster and more seamless experience.
5. Use caching
Implement caching strategies to reduce the time required to load resources. Caching allows frequently used elements to be stored locally or on the server, enabling faster access when users revisit your site.
Both browser-side and server-side caching tools, such as Redis or Varnish, can effectively manage caching and eliminate repeated requests for the same resources. This significantly improves performance, particularly for returning visitors, and enhances your site’s LCP score.
6. Mobile first
Adopt a mobile-first strategy to verify that your site looks and functions flawlessly on the devices most used by your audience. This includes implementing responsive design, user-friendly navigation, and mobile-optimized content. Since Google predominantly uses the mobile version of sites for indexing and ranking, a mobile-first strategy is important for SEO.
Optimize your Interaction to Next Paint (INP)
As mentioned earlier, INP (Interaction to Next Paint) measures the responsiveness of a page. In March 2024, INP fully replaced FID (First Input Delay), as it accounts for all user interactions rather than just the first one.
Even when a webpage loads quickly, if there’s a delay between the user clicking a button and the browser responding, the INP is slow. On the other hand, a fast response ensures a smoother and more seamless user experience, which is essential for keeping visitors engaged.
For INP, the target is to stay under 200 milliseconds. This ensures the page feels responsive and interactive, improving overall user experience. Some common culprits that can cause delays include heavy JavaScript execution, long-running tasks, and render-blocking resources.
How to optimize INP on your site
1. Minimize Javascript execution
Reducing JavaScript execution can help minimize delays and improve response times. Heavy JavaScript usage slows down the site, so it’s crucial to optimize the amount of code being executed. Tools like Webpack or Rollup can break large JavaScript files into smaller chunks, optimize the script load order, and reduce the overall payload. By minimizing JavaScript, the main thread remains more available for user interactions, leading to a better Interaction to Next Paint (INP) score.
2. Defer non-essential Javascript
Deferring non-essential JavaScript involves delaying the execution of scripts that aren’t required during the initial rendering of a page. This strategy allows critical content to load faster, improving interactivity. Use attributes like defer or async to manage this effectively, and consider lazy-loading JavaScript that isn’t needed until triggered by user interactions. This ensures a faster and smoother user experience.
3. Break up long tasks
Breaking up long-running tasks ensures that the main thread remains responsive. Complex operations, like large calculations or data processing, can block the main thread, delaying interactions. Splitting these tasks into smaller chunks or spreading them over time helps avoid performance bottlenecks and reduces INP delays.
4. Use Web Workers
Web Workers are an excellent tool for running scripts in the background, freeing up the main thread for critical user interactions. Tasks such as complex computations or data processing can be offloaded to Web Workers, ensuring the main thread stays responsive. This approach significantly reduces INP delays by preventing heavy computations from blocking user interactions.
5. Use prerendering or server-side rendering (SSR)
Prerendering and server-side rendering (SSR) generate HTML on the server before sending it to the browser, reducing the client-side workload. This allows pages to become interactive much faster, greatly improving INP scores. Frameworks like Next.js for React provide built-in SSR support, making it easier to implement and optimize. Additionally, these techniques benefit other performance metrics, such as Largest Contentful Paint (LCP), by ensuring faster loading times.
Optimize your cumulative layout shift (CLS)
CLS looks at how visually stable your webpage is by measuring unexpected layout shifts during page load by measuring the distance the page elements have shifted.
A layout shift occurs if an ad loads and content is pushed down unexpectedly. You can use Google PageSpeed Insights to get a full diagnostics report and start minimizing such shifts to optimize CLS – this will provide users with a more visually consistent and pleasant browsing experience.
When it comes to optimization, your goal is to have a CLS of less than 0.1.
Here are some of the most common causes of CLS issues:
- Images without dimensions
- Ads, embeds, and iframes without dimensions
- Dynamically injected content such as ads, embeds, and iframes without dimensions
- Web fonts
How to optimize CLS on your site
1. Add dimensions to elements
When it comes to images without dimensions, you can easily add them to your HTML.
Here’s an example of HTML code that you can use:
<img src=”example.jpg” alt=”Description” width=”500″ height=”300″>
Alternatively, you can use CSS to set the dimensions of the images. However, it’s preferable to include the dimensions directly in the HTML for faster rendering.
<style>
.image-container img {
width: 500px;
height: 300px;
}
</style>
<div class=”image-container”>
<img src=”example.jpg” alt=”Description”>
</div>
2. Reserve space for images, videos, and iframes
If you display ads on your site, you can (and should) create a static element that reserves space for them.
As you can see below, bbc.com has added a placeholder element that is replaced with an ad when the page is completely rendered.

3. Preload fonts
Another way to prevent layout shifts and keep your web page optimized is to preload fonts. This will cause the browser to load them when the page’s primary content is displayed.
<link rel=”preload”
href=”your-font.woff2″ as=”font” type=”font/woff2″ crossorigin=”anonymous”>
Efficient font loading is vital for minimizing delays in rendering text. Use the font-display: swap property to ensure text remains visible while custom fonts load. Hosting fonts locally can also reduce latency, especially in regions where CDN performance may vary.
For example, Google Fonts supports this functionality using display=swap for immediate text visibility while custom fonts load in the background. Limit the number of fonts and font weights used to streamline loading times further.
Stay on top of things
Regularly monitor your site’s performance using tools like Google Search Console and Similarweb site audit tool. Keeping your settings up to date and staying informed about algorithm changes and best practices checks that your site maintains high performance standards.
Schedule routine Core Web Vitals audits to catch potential issues before they affect user experience or SEO rankings. Consider using performance monitoring tools that send alerts for anomalies, such as performance drops or unusual behavior, allowing you to address issues promptly.
Core Web Vitals: More than just higher rankings
Optimizing your Core Web Vitals could help your site in more than one way. Firstly, we’ve seen that Core Web Vitals is considered a ranking factor, and improving your metrics may improve your rankings.
Secondly, Core Web Vitals and user metrics, in general, are not just ranking factors. The more seamless your user experience, the better your site will convert.
And because user metrics could affect both rankings and conversions, we highly recommend that you include Core Web Vitals in your site audits.
FAQs
What are the Core Web Vitals?
Core Web Vitals are metrics defined by Google that help web developers to understand how users experience the speed, interactivity, and visual stability of their web pages. They are very important if you want to know how well your site is performing in terms of the end user.
How do I check my Core Web Vitals?
You can check your site’s Core Web Vitals using a variety of tools, such as Google Search Console, Google PageSpeed Insights, Lighthouse, and the Web Vitals Chrome extension. Each one of them offers you different insights and recommendations and will support you in the process of optimization.
How can I improve my Core Web Vitals?
There are several best practices you can follow to help boost your Core Web Vitals score, such as image optimization, fewer bytes of JavaScript, better caching, CDNs, preloading of the critical resources, and so on. These should be followed in order to make your site faster and as user-friendly as possible.
Do Core Web Vitals affect SEO?
Yes, Core Web Vitals is a ranking factor for Google. Better Core Web Vitals can mean higher rankings and better user experience. It’s incredibly important to optimize for these metrics for your sites to meet today’s performance standards.
How often should I audit my Core Web Vitals?
Conduct audits on a regular basis (ideally once a month) to identify and help rectify issues before they turn into a big problem or as a routine check to keep your site running at peak performance. Any major changes or updates to your site should also trigger an immediate audit.

Related Posts


Generative AI Statistics for 2026: The Latest Trends & Data Insights

How I automated GEO keyword research with Claude and the Similarweb MCP


How Query Reformulation In LLMs Changes Keyword Research Methodology For GEO


Track Gen-AI And Organic KPI's On The #1 SEO Platform
Give it a try or talk to our marketing team - it’s free!