What Is Clickstream Data and Why SEOs Shouldn’t Ignore It

From query to content, many factors can make or break the user experience on a search engine. Will users find relevant results? If they do, what will happen when they click? One of the things we learned from the Google leak of 2024 is that search engines measure user metrics when ranking content.
The question is, as an SEO, how can you optimize your content for each stage of the user journey? The answer all starts with the right data. Specifically… clickstream data.
In this post, we cover:
- What clickstream data is
- Where you can find it
- How you can use it to find insights beyond just rank tracking
What is clickstream data?
Clickstream data records user behavior and interactions on a website or application, such as page views, clicks, taps, swipes, and purchases. It captures the sequence of events or actions performed by users as they navigate through a platform, recording which pages they visit, in what order, and what they do on each page. This data helps you optimize your marketing and SEO by understanding user behavior.
A small sample of what you can measure includes:
- What search terms users are using to find content
- Which areas of a site or page are getting the most attention
- History of user’s buying behavior
- Where users click on a SERP
- How long was the user’s session duration
- Where users navigated to next
So essentially, clickstream data is data that measures what real people do on the web.
Types of clickstream data
You can record literally thousands of events using clickstream data, and the more data you gather, the more comprehensive insights you can gain into user behavior patterns, preferences, and pain points within your digital experience.
Here are a few useful types of clickstream data to get you started:
- Search data: Insight into user intent by analyzing specific search terms
- User interaction data: Shows how real users are interacting with your content, giving you behavioral insights
- Session data: Helps you understand user engagement patterns by including user interactions within a single visit or session
How is clickstream data collected?
You can collect clickstream data by using:
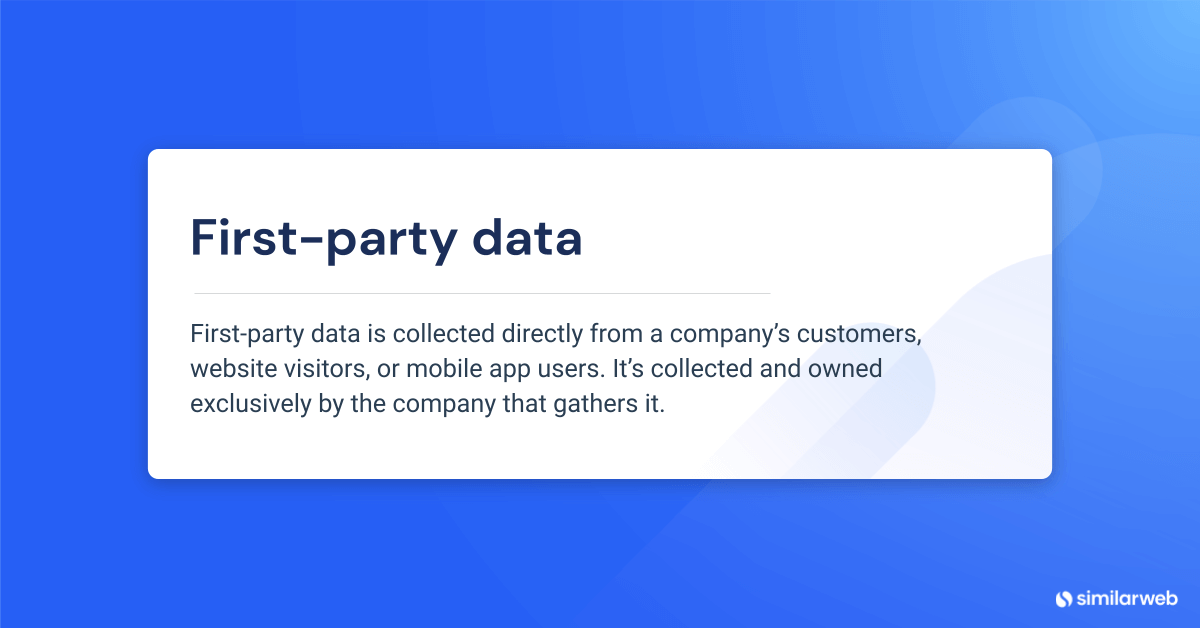
- First-party data tracking tools
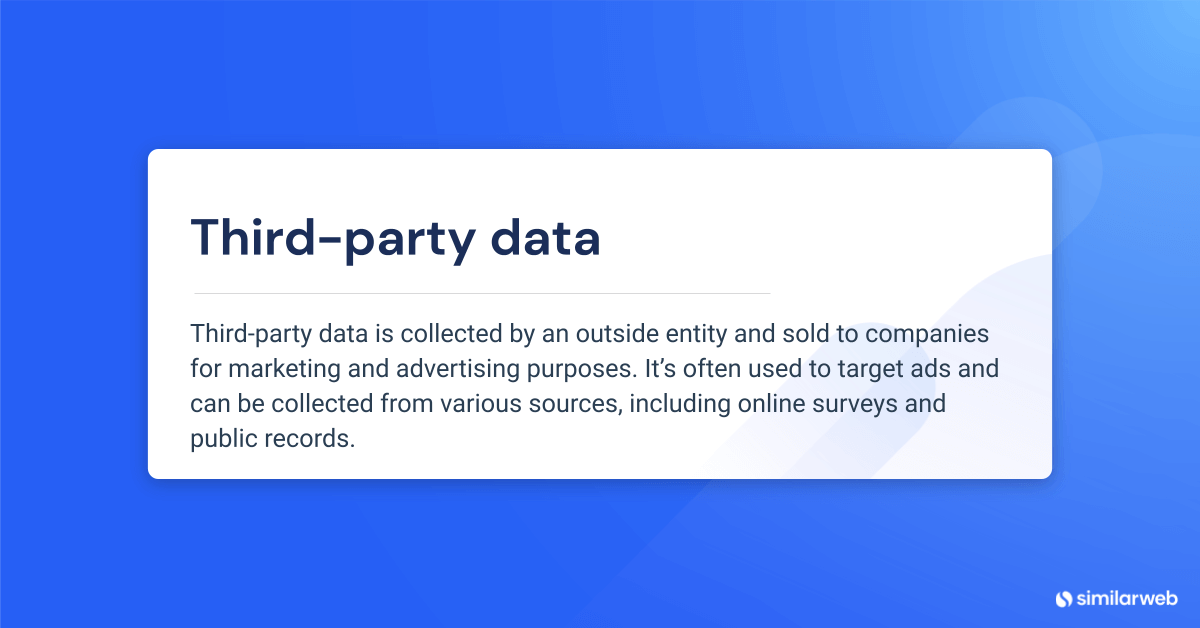
- Third-party web analysis tools
The primary difference between clickstream data on first-party tools and third-party tools lies in the source of the data and the level of control over data collection and analysis.
Using tracking code, first-party tools give you access to how your users interact on your site. Data from various sources enables third-party tools to show you data for competitor sites.
1. First-party tracking tools
First-party clickstream analytics tools, like Hotjar and Amplitude, are analytics platforms that you can use to analyze user interactions on your own site.
To use one of these platforms, you add a tracking code to your site. There are various ways you can do this, including:
- Cookies: Small text files stored on a user’s device that track their activities across a website. They can be used to personalize user experience by tracking user preferences, session data, and interactions.
- Tag management systems: Like Google Tag Manager, can be used to add tracking code to a website in order to gather user data.
- JavaScript tags: Code snippets embedded in web pages that record user actions like clicks, page views, scrolls, and more.
- Mobile app SDKs: Software development kits track user behavior within mobile applications.
These tools send the collected data to analytics platforms, where it’s processed and analyzed to gain insights into user behavior and enhance your marketing strategy.
2. Third-party analytics tools
Third-party tools, like Similarweb, gather large volumes of clickstream data from a number of sources. With third-party tools, you are not limited to your own site. Depending on how comprehensive the data is, you can use third-party analytics tools for a variety of tasks, including:
- Competitor analysis
- Keyword research
- SERP analysis
- Traffic analysis
The most powerful benefit of using a third-party tool is that you can see your data in context. This is absolutely crucial as SEO is competitive by definition, and your site or content needs to outperform your rivals to rank higher.
Additionally, search engines understand that metrics like bounce rate are relative and expect certain content to have high bounce rates. For example, if someone looks up a weather report, they’re unlikely to spend much time on the page or engage further with the site.
Why you should use clickstream data for SEO (and what you’ll miss if you don’t)
The most important thing to focus on when optimizing content for the web is relevance. Simply put, your content must answer the user’s query to have any chance of ranking on the SERPs. Relevance will always be the most important aspect of ranking content, but it’s not the only one.
While SEOs have traditionally relied on Google’s guidance as well as experimentation to understand how to rank content, the leak of 2024 corroborated many long-standing assumptions and practices and opened our eyes to a few we never imagined.
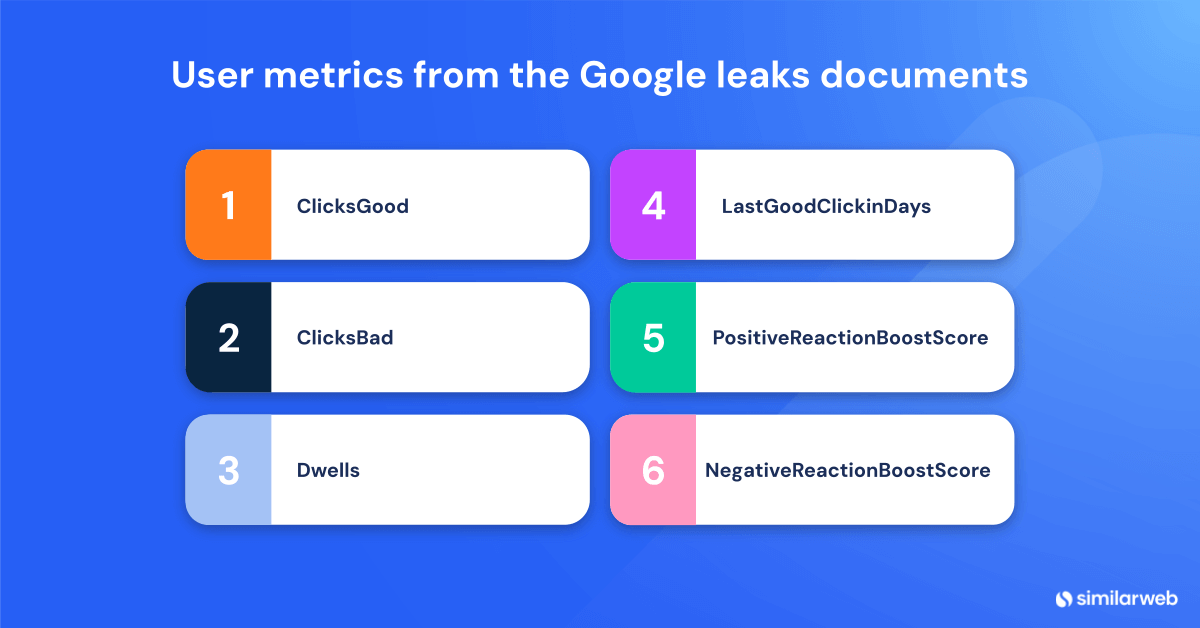
Let’s focus our attention on one aspect of the user metrics that appear in the leak, including:
- ClicksGood: Measures the instances where user clicks represent a positive experience
- ClicksBad: Measures the number of clicks that represent a bad user experience
- Dwells: Measures how much time a user spends on a page after clicking on a search result
- LastGoodClickDateInDays: Indicates the date when the document received the last good click
- PositiveReactionBoostScore: Applied directly to the final ranking score based on positive user reactions
- NegativeReactionBoostScore: Applied directly to the final ranking score based on negative user reactions
Google tracks these metrics through clickstream data it gets from Chrome users. What we can see is that Google uses both quantitative data, such as measuring page clicks, and qualitative data, such as measuring user satisfaction metrics.
The key takeaway: Tracking your rankings and clicks is just the beginning. User satisfaction metrics should also be a part of what SEO teams take into consideration when looking to rank content. The best way to measure user engagement is by looking at clickstream analytics data.
Using clickstream data for SEO: How to fill in gaps in your tracking
In this section, we’ll show you some SEO metrics gleaned from clickstream data that can directly affect your SEO performance based on the user metrics found in the Google leaks. We’ll start with some big-picture SERP metrics and work our way down to a detailed view of how users interact with elements on each page on your site. It’s time to roll up your sleeves and get into the specifics.
1. User clicks on Google organic results
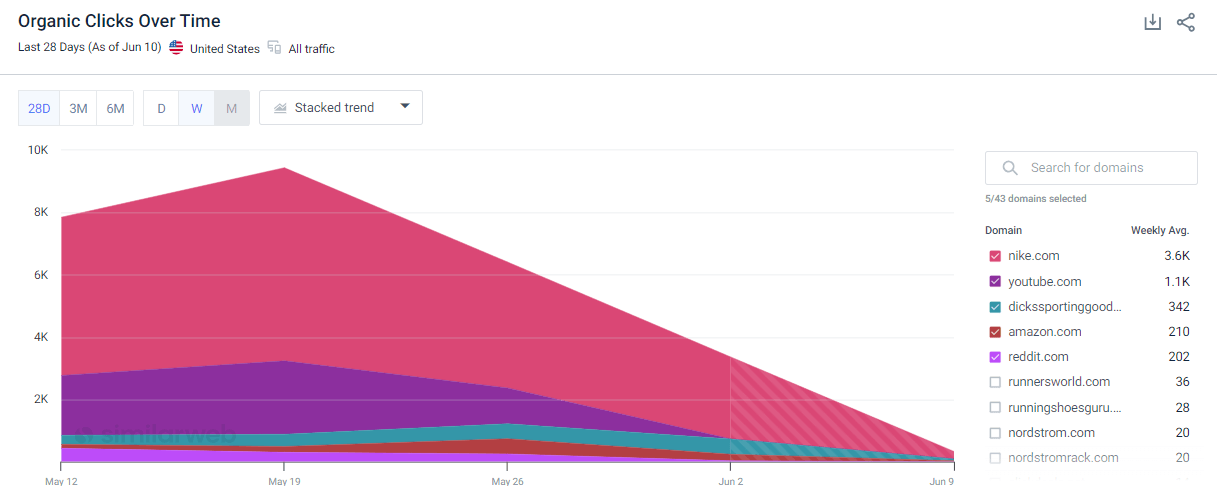
If Google uses click data on the SERPs to rank content, you should pay attention to it. By looking at where the clicks go on the top-ranking content, you can find some clear, actionable insights to rank your own content. Since Google doesn’t publish this data, you might be wondering where you can find these insights for yourself. Look no further than the Similarweb Keyword Analysis tool. It uses clickstream data to measure where real users are clicking.
For example, looking at how the commercial keyword ‘nike pegasus 40’ performed over the last 28 days, we noticed that although nike.com got the lion’s share of the clicks at 3.6K, YouTube came in second with a substantial 1.1K clicks, while reddit.com got a surprising 202 clicks. The clicks indicate that even if this is a commercial keyword, a substantial number of users are still evaluating the product by looking for reviews.
The key takeaway: By understanding where real users are clicking, you can get insight into:
- How to get more clicks by satisfying user intent
- The type of answers users are looking for, whether it is commercial intent or informational intent, such as product reviews
- Which media users are looking for, such as video or traditional web content
- What page titles and descriptions are getting the most clicks
2. Site-wide engagement metrics
Optimizing how users are clicking on your results in the SERPs is just the first step. Since Google tracks on-page user metrics, the next step is to see how sticky your site content really is. Now, before you look at this on a page-by-page level, it’s crucial to first see your site-wide metrics together with other sites in your niche, as Google understands that user metrics will differ from niche to niche.
Here is where third-party tools shine as they allow you to compare your site with that of your competitors, showing you how well your users perceive your site relative to others in the same industry.
By looking at these metrics, you can quickly see which sites performed the best. By analyzing sites with strong engagement, you can find actionable insights into how to make your site more sticky.
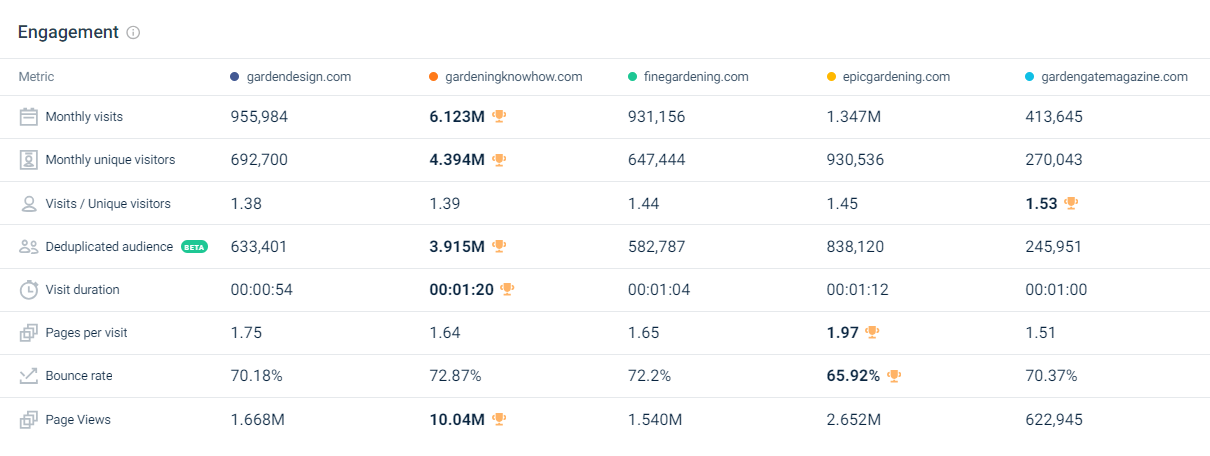
For instance, looking at the engagement metrics for the gardening site gardendesign.com and four of its competitors, we noticed that gardeningknowhow.com has the highest visit duration, while epicgardening.com has the highest Pages Per Visit and the lowest Bounce Rate, indicating that users are highly engaged on these sites.
The key takeaways: Use site-wide competitor engagement metrics to:
- Benchmark for user engagement metrics from within your niche
- Discover actionable user data by analyzing sites with the highest engagement in your niche
3. On-page user metrics
Once you’ve examined your site as a whole, it’s time to go super granular and examine user metrics on a page-by-page level. Web analytics tools like Hotjar and Microsoft Clarity will give you granular traffic analysis so that you can see where your users are clicking and where they get stuck and bounce. This will enable you to optimize your site content on a page-by-page basis.
You can also use first-party tools to map your user journeys across your site, giving you the ability to improve customer journey mapping. This will help you to find crucial touchpoints in how users interact with your site content, as well as find sticking points where users drop off.
Clickstream data for SEO: Filling the gaps in your SEO strategy
Google, as a company, knows that if it plays the long game by providing its users with a stellar user experience, they will keep coming back to its platform. This approach has made it into almost every aspect of Google’s algorithms.
This means SEOs must consider entire user journeys when optimizing websites and web content. Relying on rank-tracking tools alone will not provide the full picture needed to optimize every aspect of the user’s journey, making clickstream data an important part of every SEO’s toolkit.
To achieve this, you need access to accurate, up-to-date user data that provides detailed insights into the user journey. Similarweb is the ultimate tool for this and more!
FAQs
What is an example of clickstream data?
Clickstream data tracks the sequence of pages or screens visited, links clicked, actions taken, and other behavioral data points on a site or app. For example, if a user visits an ecommerce site, searches for a product, adds it to the cart, and completes the purchase, their clickstream data would capture this entire journey.
How do you use clickstream data for SEO?
Clickstream data can be used for SEO by analyzing user behavior patterns to understand search intent, identify popular and underperforming content, and optimize user flows. By visualizing typical visitor paths from organic search, you can tailor content, enhance user experiences, and better align with how users navigate your site, ultimately improving your SEO performance.
The #1 keyword research tool
Give it a try or talk to our marketing team — don’t worry, it’s free!
