


From Clicks to Clout: Mastering Social Media Reporting [+Template]
![From Clicks to Clout: Mastering Social Media Reporting [+Template]](https://www.similarweb.com/blog/wp-content/uploads/2021/08/social-media-reporting-header-768x456.png)
There are over 4.66 billion active internet users worldwide every single day. That’s 59.5% of the global population.
Social media plays a huge role in online activity, with 500 million tweets being sent every day. With all that data, it’s no surprise that digital marketers can struggle to sift through the noise when working on their social media reports.
How can you be sure you’re presenting useful information, rather than overwhelming your clients with an avalanche of figures and data that they can’t possibly process?
That’s where analytics for agencies come in. Effective social media analytics tools provide you with everything you need to gather actionable information and present it in a clear and compelling way for your clients.
Let’s explore how to create a social media marketing report that helps your clients stay #trending.
What is a social media report?
A social media report analyzes your marketing activities, brings together relevant findings, and presents them to your client in a concise and easy-to-digest format. It’s an important part of any social media marketing strategy, as it’s used to tweak campaigns, make decisions about future spending, and track just how effective your work actually is.
Social media marketing continues to be big business. Facebook alone brought in $27.2 billion in ad revenue in the fourth quarter of 2020, and over 86% of marketers in the U.S. use social media as part of their advertising portfolios. That means the competition has never been fiercer, so effectively presenting your successes to clients is an essential part of building a long-lasting relationship. If anything, how you communicate the wins or losses is even more important than the results themselves.
Social media reporting also helps you to identify gaps and weaknesses in your current social media strategy, letting you reallocate resources or make tweaks to your planning as the campaign develops. With proper website analytics data backing up your efforts, your clients will see the benefits you’re delivering for their business front and center.
“86% of marketers in the U.S. consider social media a key component of their digital marketing strategy.”
Creating a social media report
The secret to an effective social media report is planning. If you set clear goals and expectations with your client from the start, you’re much more likely to have an easy path to reporting back on your work.
After that, your focus should be on clarity: avoiding information overload and honing in on useful data and actionable insights that can be taken forward into a coherent strategy. It’s important to create a logical structure that tells a clear and meaningful story.
Here’s how it’s done:
Step 1: Set clear goals
Before launching any successful social media marketing campaign, you’re likely to assess your client’s current activities and work together on creating a series of goals and objectives for the campaign. You’ll then set key performance indicators (KPIs) that measure these objectives so that there’s a tangible metric to evaluate your work against.
Effective KPIs may focus on the total number of followers, impressions, mentions, a specific click-through rate (CTR), average session duration, or social media-based digital marketing metrics. Before you get into those, it’s worth restating your overall goals at the top of the report so that your client has your pre-agreed objectives firmly in mind.
Step 2: Consider your reporting frequency
The frequency of your social media reporting affects what you should include, and depends largely on the purpose of your report. If you’re helping your client plan their social media scheduling then a monthly report might be the best bet. It can help you identify the best times of day, week, and month to share content with their audience for the greatest engagement, and in turn, increase impact and maximize return on investment (ROI).
Quarterly reports may help assess the effectiveness of your digital strategy and are most likely to be requested by senior management interested in seeing performance numbers, planning future campaigns and spending, and measuring your success.
Meanwhile, weekly reports can help you stay on track of posts that go viral, and are particularly helpful for a more reactive social media marketing campaign with built-in community management.
Step 3: Identify your audience
Next, work out who your report is for: will it be read by the client’s marketing team, data analysts, vice president, CMO, CEO, or board members? Considering what information each stakeholder is looking for is key, based on the decisions they’ll be making. Keep it targeted to the right audience and demographics, and remember the rule of thumb that the higher up the client’s management structure your report goes, the more concise it needs to be.
Step 4: Gather your data
At last, it’s time to collect your social media metrics. To avoid data overload it’s important to focus on insights that will add value and meaning to your reporting. Using automated social media reporting tools will save you from manually collecting information from across different insights and analytics platforms.
Here are 5 automated reporting tools to help you do that:
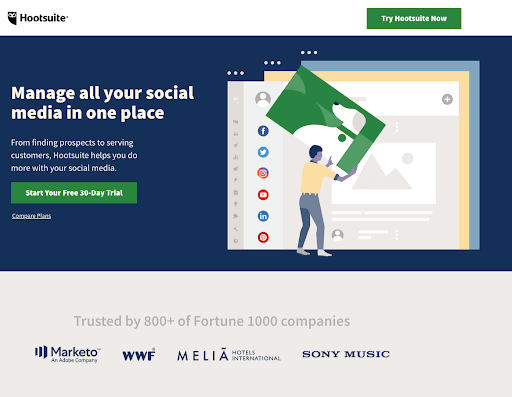
Looking for more tools to complement your marketing efforts? Check out our list of must-use agency tools.
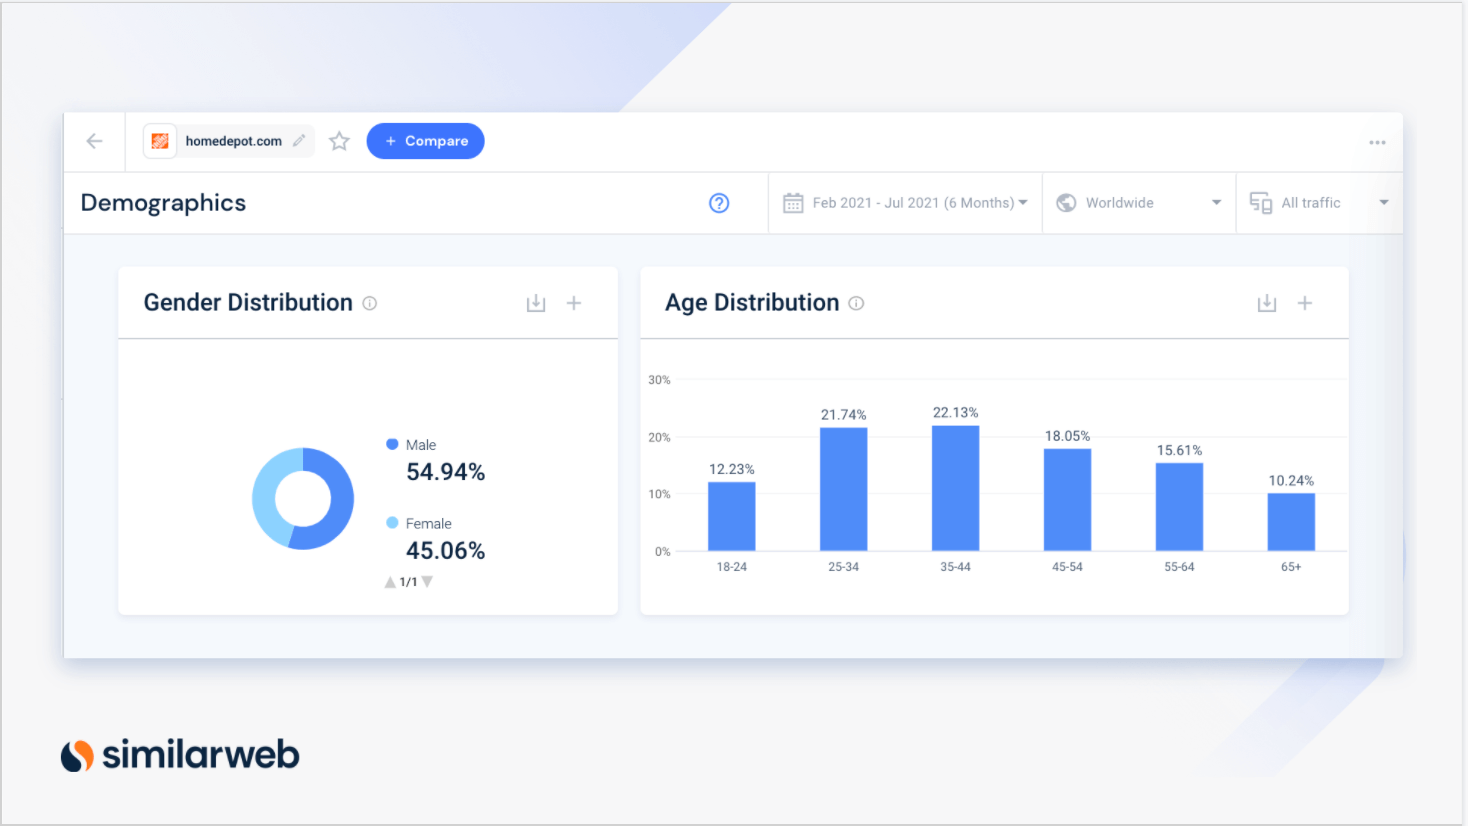
As you explore the data, make sure to look through the available filters (such as country, demographics, platform, mobile vs. desktop device, or time period). You might discover consumer trends that you may otherwise have missed, and find ways of targeting your campaign even more tactically. If, for example, you realize that 65% of your client’s traffic is originating from Australia or Germany, you can tweak the timing of your campaigns to match that time zone and appeal directly to that audience.

Ready-to-use social media report template
Key steps to take:
- Introduce the topic
No social media marketing report is complete without a quick and concise introduction outlining the campaign’s goals, strategy, and most important KPIs or metrics. - Include headline metrics
Next, show off your biggest successes with a quick-glance snapshot of your campaign’s social media performance. The focus here should be on high-level metrics such as total followers, engagement rate, and click-through rates.

- Dive into the numbers
This is your chance to track the trends you’re observing over the course of your campaign. This might mean benchmarking your metrics against previous results or from before you started working for your client. Remember, this isn’t an excuse to drop in every metric you can get your hands on. Keep it targeted, concise, and actionable. Commonly featured figures might include shares, likes, clicks, followers, conversion rate, lead generation rate, the share of voice, sentiment, and top-performing posts. - Other key activities
Next up, outline any additional work you undertook in the reporting period that might not appear in the figures, such as expanding your pool of influencers for influencer marketing and influencer affiliate, undertaking data-driven research, or conducting buyer persona interviews. This section is your chance to share all the extra successes you’ve delivered for your client, no matter what form those take. - Analysis and recommendations
Data is only useful when it’s interpreted and applied in practice, so pull together your insights and observations based on the trends detailed in the report. Should you tweak or refocus the campaign? Are there additional benefits that could be delivered for an increase in marketing spend? What does the future look like for the campaign and your client’s business? The more context and analysis you can provide along with the figures, the more effectively you’ll communicate your value to the client.
Not all KPIs are made equal: Here are the most important
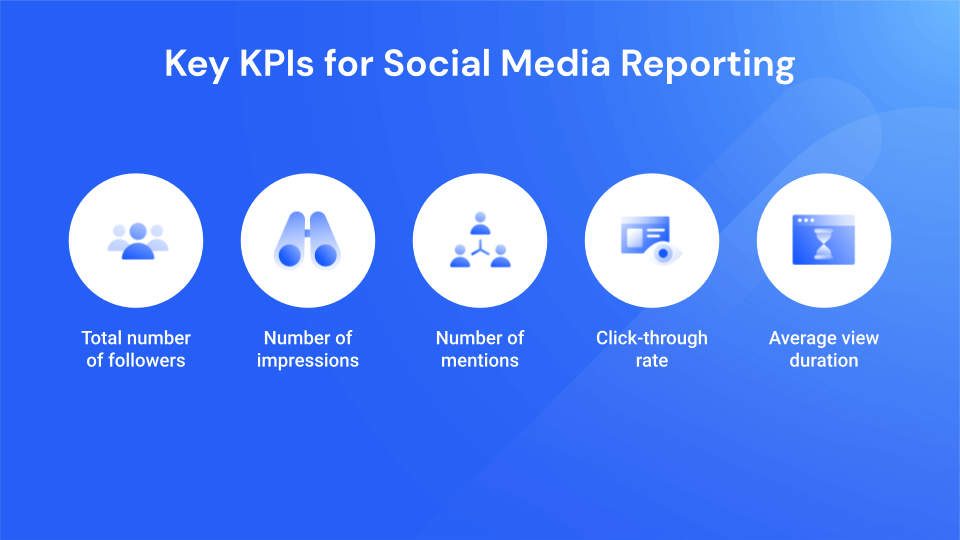
Your social media analytics report should include the most important KPIs and metrics that your client is interested in. Here are the heavy hitters, which are likely to be important regardless of the specific purpose of your report:
1. Total number of followers: Metrics don’t get simpler than this one, which simply tracks the number of followers on your client’s social media accounts.
2. Impressions: Although they’re calculated slightly differently across social media platforms, impressions (or ‘reach’) counts the number of times your client’s posts have been viewed. Depending on the scale of your campaign, it can be helpful to break this down by individual platforms, campaigns, or even specific posts.
3. Mentions: Social media marketing is all about generating a conversation around your client’s brand. By making a splash, potential customers will talk about the client’s product or service, sharing it with others and significantly maximizing the effectiveness of the campaign. Tracking the number of times the brand or campaign is discussed via a mentions metric is indispensable.
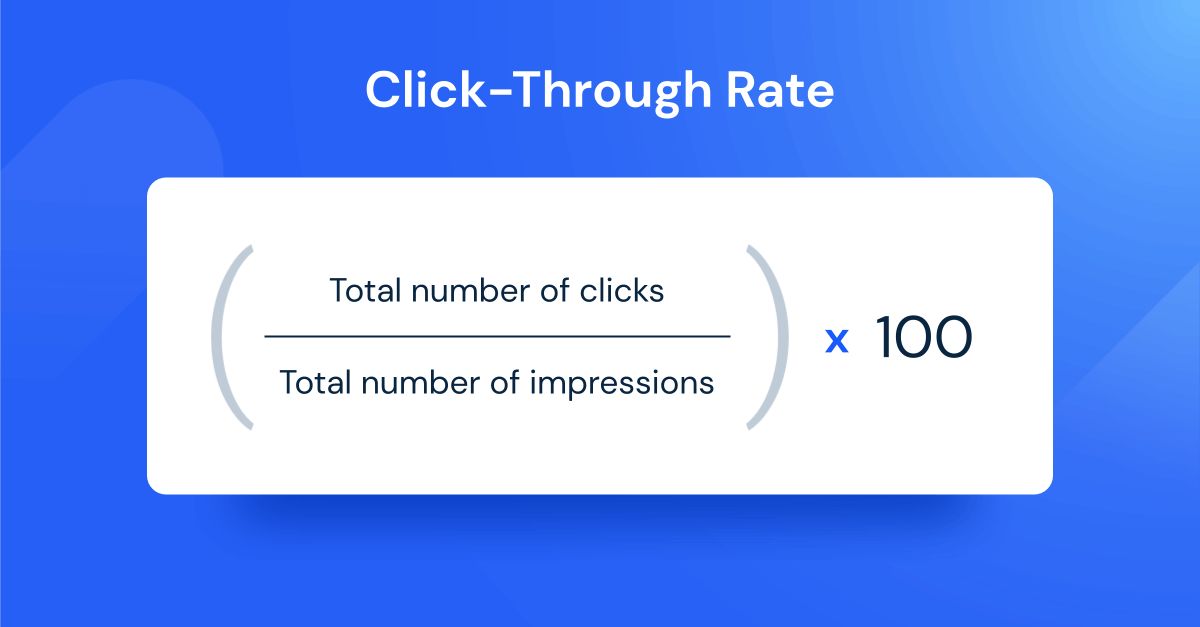
4. Click-through rate: For a social media campaign intended to drive traffic to your client’s website or a specific promotional landing page, the amount of traffic generated is clearly an important indicator of success. Assessing the relative CTR performance of different messaging and periods of engagement across your content marketing strategy can help shape future planning.
5. Average view duration: While impressions give you a raw figure of views, this doesn’t include any data on the quality of these views. This is where average view duration comes in, giving your client an idea of just how effective each piece of content is at holding their prospects’ attention.
How to create a professional report with Similarweb
There’s no escaping the sheer volume of data that social media marketing generates. It can quickly become overwhelming for digital marketers, let alone for clients who may not be as technically savvy as you are. That’s why how you go about doing your social media reporting is so important. Make sure you present clear, ready-to-use information in a visually engaging way.
Similarweb lets you do just that, pulling together the data you need from across platforms and analytics dashboards in real-time. By presenting all your findings in one place, it becomes significantly easier to draw together the conclusions, insights, and strategic assessments that will lift a campaign and deliver the revenue and engagement boost your client is after.
With insights into how different social media sites are performing, who is winning the most traffic, and what kind of user demographics they’re attracting, brands can create an informed strategy and target the most popular and effective channels for their market.
Find out more about how Similarweb’s analytics for agencies can help you deliver more effective reporting with less effort. Book a live demo with one of our experts to learn how you can get the best results for your social media.
Further reading: Build Competitive Analysis Reports Your Management Can Rely On


Related Posts


How to Do A Competitive Analysis: Complete Guide & Free Templates

How to Build an AI Search Intelligence Dashboard for Client Presentations Using Claude and Similarweb MCP

AI Visibility Momentum: The VAMP Framework For Tracking What Visibility Scores Miss

The Dark Funnel Paradox: Why Your Best B2B Leads Are Invisible (And How to Find Them Anyway)

![GEO Framework For Growth Leaders [+Free Template]](https://www.similarweb.com/blog/wp-content/uploads/2026/02/attachment-growth-leader-geo-decision-framework-768x429.png)
Your full marketing toolkit for a winning strategy
The ultimate solution to help you build the best digital strategy