How to Do a Competitive Landscape Analysis

Imagine this.
You’ve dedicated months to crafting the ideal product, and your marketing is world-class.
However, your competitors are outperforming you.
Believe it or not, this scenario is quite common.
What’s your next move?
Before implementing any major changes, gaining a deep understanding of your competitive landscape is essential.
In this post, we’ll explain what a competitive landscape analysis is and how you can do one to systematically understand your market so that you can leverage your strengths and gain market share.
But first, a few definitions…
What is a competitive landscape?
A competitive landscape refers to the overall structure and dynamics of a market or industry, encompassing key players, their market share, competitive strategies, and external factors. It provides a comprehensive view of the business environment, aiding companies in understanding their position and formulating effective strategies.
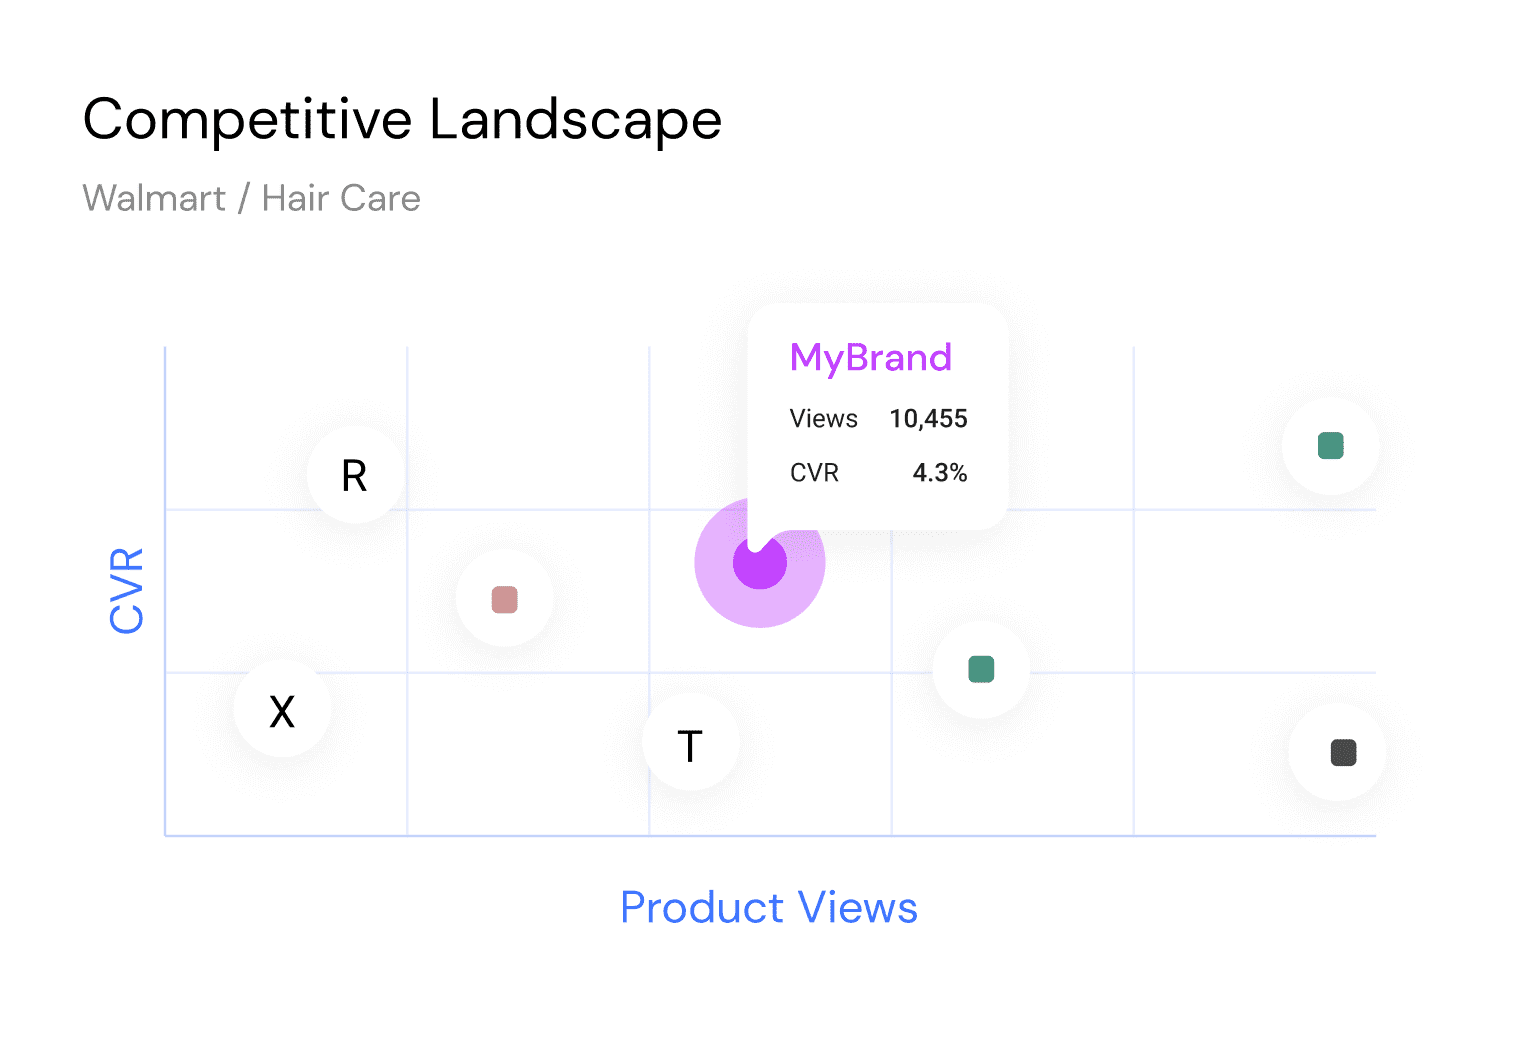
For brands, it means assessing your standing against key competitors in engagement metrics like website traffic, product views, and conversions.
What is a competitive landscape analysis?
Competitive landscape analysis is a strategic evaluation of your business to assess your rivals, market trends, and opportunities. It identifies your strengths, weaknesses, and market positioning to enhance decision-making and gain a competitive edge.
You now understand what it is, now let’s cover why it’s important.
What are the benefits of a competitive landscape analysis?
There are 3 benefits to competitive landscape analysis:
- Understanding your competitors Before you create a business strategy, you must first understand the nature of your competitive market. Because in order to have a winning strategy, you must understand where you intend to go, how you intend to get there, and what might stand in the way. You can only possibly begin to do that if you understand your competitive landscape.
- Informed data-driven decisions: Competitive landscape analysis will help you build a winning strategy and make effective decisions while minimizing risks.
- Audience Insights: Analyzing market dynamics, competitor strategies, and emerging trends will give you a detailed understanding of your audience’s pain points and how businesses help to solve their niggling issues. This insight allows you to cater to customer preferences and strengthen your market position.
How to do a competitive landscape analysis [10 easy steps]
1. Identify your competitors
The first step is to understand who your competitors are. Because there are several types of competitors, when analyzing your competitive landscape, you must decide what types of competitors you want to include in your analysis.
The best way to do this is to use the Similarweb Similar Sites report. What makes this report so powerful is that it doesn’t rely on just one source of data. Instead, it brings you a list of sites that are similar to yours in:
- Content
- Audience
- Keywords
- Referrals
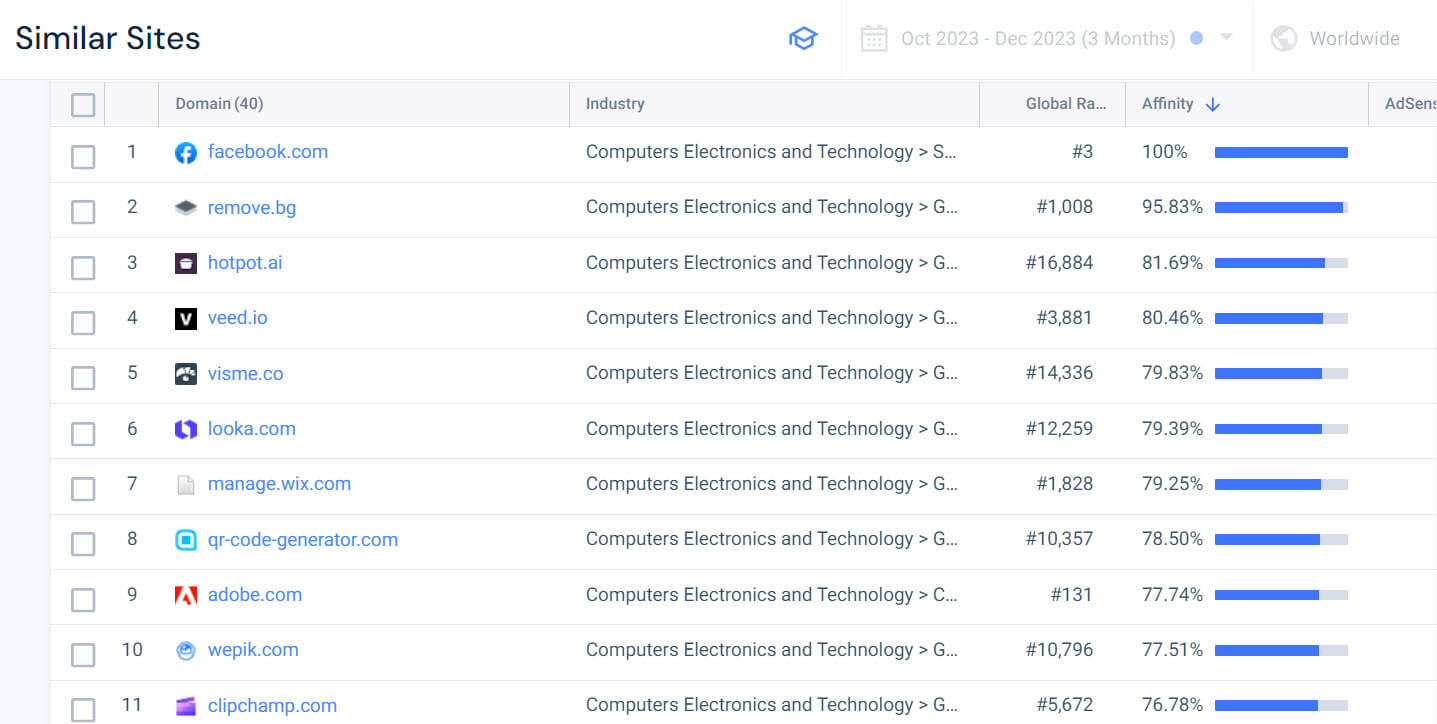
By using a broad set of metrics, you can find a solid list of competitors that are closely related to your business. For instance, below, we’ve dropped canva.com into the Competitive Analysis tool, and we now have a list of sites that share a similar audience.
You can quickly see if a site shares a similar audience to yours by looking at the Affinity score. In the table above, you’ll notice that some of the results are not relevant to Canva. For instance:
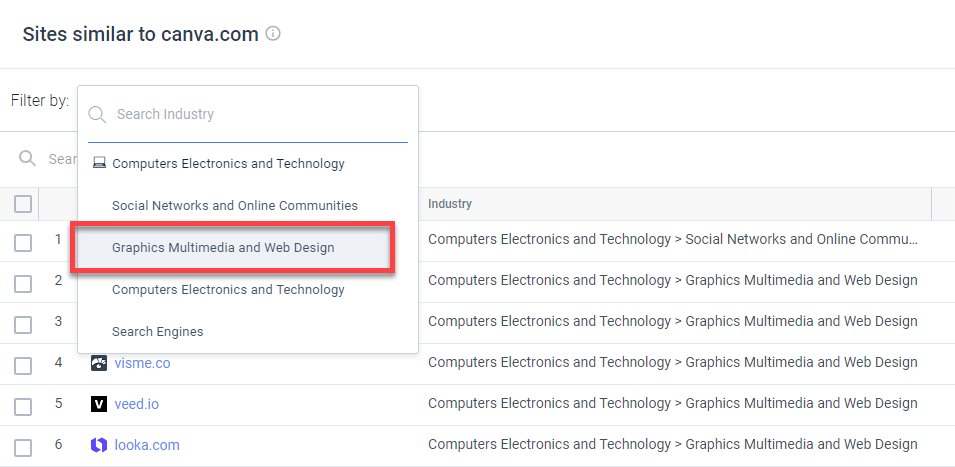
You can easily filter these results by industry. For instance, Facebook and Instagram are both social networks while Canva is in the Graphics Multimedia and Web Design niche.
To deal with this, use the Industry filter to ensure that all the results are in your industry.
2. Swot analysis
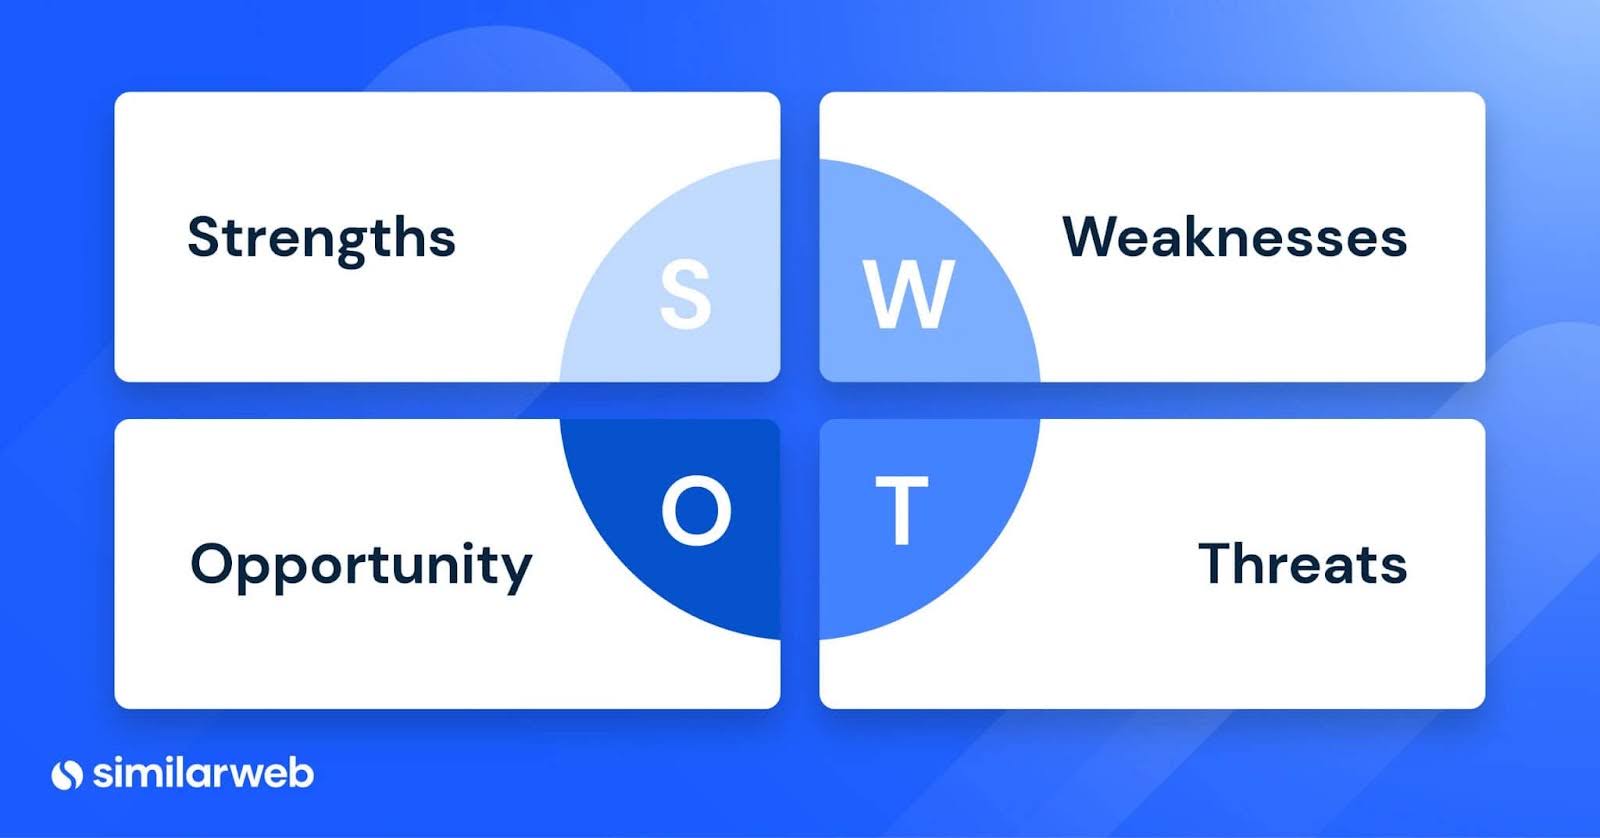
After identifying your competitors in the competitive landscape, it’s time for a SWOT analysis. SWOT analysis is a strategic planning technique that helps you evaluate your business’s internal Strengths (S) and Weaknesses (W), along with its external Opportunities (O) and Threats (T). By analyzing these factors, you’ll gain insights to double down on your strengths, address weaknesses, seize opportunities, and mitigate threats by facilitating informed decision-making and effective strategic planning.
Think of SWOT analysis as your high-level view of how your business compares to your competitors. This understanding will help you plan your marketing strategy moving forward.
To get started, break out your whiteboard, piece of paper, or anything you can write on. Break it up into four quadrants, including:
- Strengths
- Weaknesses
- Opportunities
- Threats
Strengths and Weaknesses represent internal factors that affect your business, and Opportunities and Threats represent external factors.
In general, when starting your SWOT analysis, you should start with the external factors. (Opportunities and Threats.) These are factors that affect all businesses in your market. By starting there, you’ll understand the arena in which your business is playing.
Understanding your competitive environment first will give context to your strengths and weaknesses. Context that will help you find insights to build a winning strategy.
Uncover new opportunities
List out all of the opportunities in your market that your business can benefit from.
Here are some questions to get you started:
- Are there emerging trends that you can leverage to your advantage?
- How are customer preferences evolving, and how can you align with them?
- How can you adopt or integrate new technologies to improve your products or services?
- What are your competitors doing well, and how can you learn from them?
- What are the unmet needs or pain points of your target customers?
- How can you enhance your products or services to better meet customer expectations?
Identify your threats
It’s now time to find out how competitors are stealing your market share. Threats could come from direct and indirect competitors, but they could also come from changes in your industry, such as new entrants or customer preferences.
Here are some questions to get you started:
- How might internal issues, such as a lack of skilled workforce or poor management, pose threats?
- Are new competitors entering the market, and what strengths do they bring?
- How are competitors adapting to changing market conditions?
- How susceptible are you to economic downturns or changes in consumer spending habits?
- What external factors might affect market stability?
Analyze your strengths
Now that you’ve looked at the external factors that affect your company, it’s time to look inward at your strengths.
Here are some questions to help you get started:
- What are the key capabilities and skills that set your business apart from others?
- What unique resources or expertise do you possess?
- Do you have strong brand loyalty, and what factors contribute to it?
- Are there unique selling points that resonate with your target audience?
- Do you have a strong and loyal customer base, and what strategies foster customer loyalty?
- Do you have a talented and motivated workforce, and how does it contribute to our success?
Pinpoint your weaknesses
This stage is important because if you are honest with your weaknesses, you just might be able to turn them into opportunities.
Here are some questions to inspire you:
- What are the key operational inefficiencies or bottlenecks in your processes?
- Are there financial limitations or constraints that hinder your ability to invest or expand?
- Are you overly reliant on a specific revenue stream, making us vulnerable to economic shifts?
- Are there gaps in your market coverage or untapped customer segments?
- Are you falling behind in terms of technology adoption within your industry?
- Are there negative perceptions or misconceptions about your brand in the market?
You now have a big-picture framework of your market and how your business fits in. It’s now time to take a deep dive into some valuable competitor data.
3. Competitor research
In this section, we’ll show you how to gain competitor insights based on digital data signals. The best way to do this is with the Similarweb Website Performance tool. Once you’ve found your competitors, it’s time to compare them side by side.
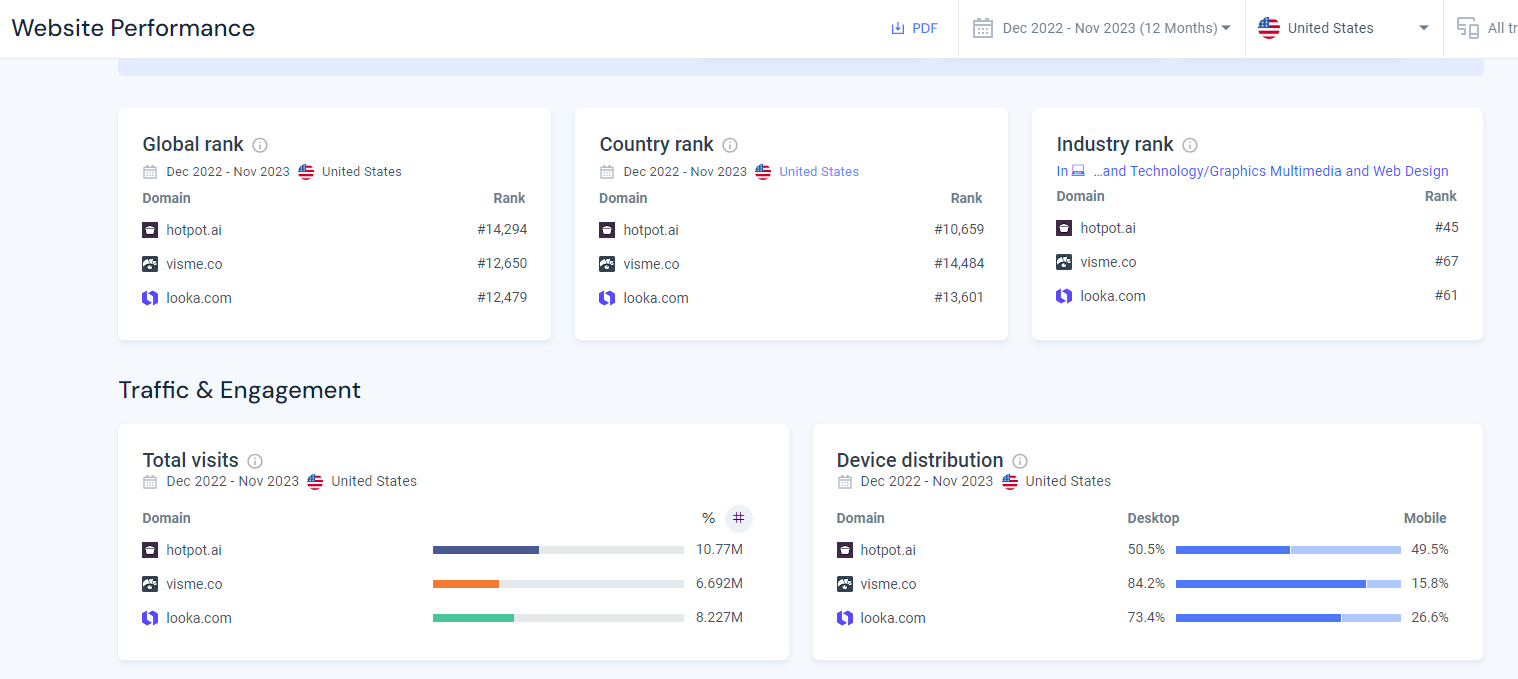
Below, we are comparing the performance of three AI image generators:
As you can see, Hotpot is getting more site visits than its competitors. Let’s evaluate how big a win it really is and try to figure out why and how you can use that information in your marketing strategy.
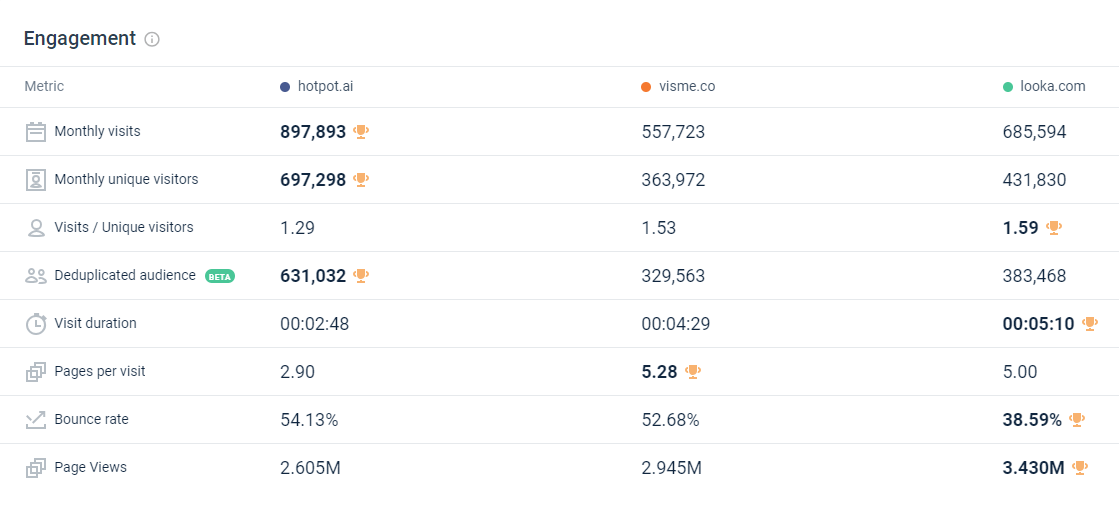
Looking at their engagement metrics, we can see that Hotpot is outpacing its competitors by bringing more Unique Visitors to their site. This means they have a better traffic strategy than the other competitors.
But what’s interesting is that Looka is more successful than the other competitors in bringing Visits/Unique Visitors. More of their visitors are coming back to the site. We also see that their Bounce Rate is substantially lower, and they get far more Page Views than their competitors.
This means that while Hotpot attracts more traffic, Looka is able to retain them. Hotpot should consider examining Looka’s visitor engagement strategies, as traffic holds value only when it translates into paying customers. Otherwise, it’s just a vanity metric.
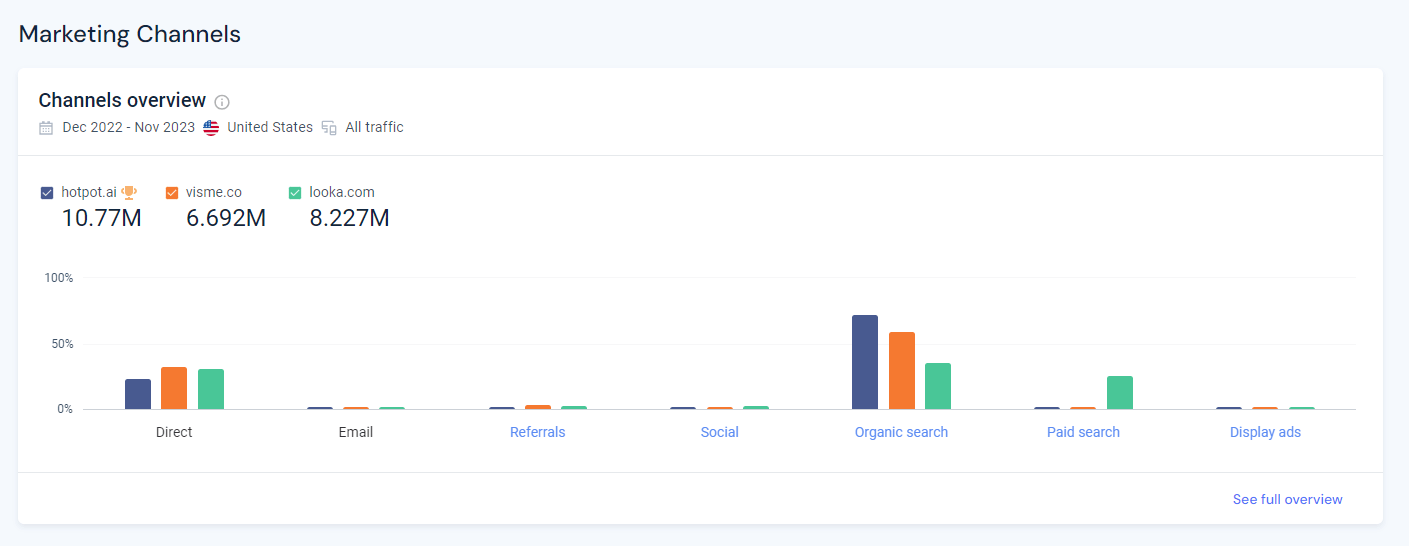
Now, let’s move on to their Marketing Channels.
Above, you see that Hotpot is generating its traffic with SEO. This is clearly the strongest aspect of their marketing and they could outpace their competitors if they scale their organic search efforts.
On the other hand, Hotpot is seeing fewer Direct visits. This might be a sign that they have weaker brand recognition, which is something to address if they don’t want to be left behind.
We also see that Looka is leveraging Paid Search far more than its competitors. This might be an easy win for Hotpot as they are not focusing on paid acquisition.
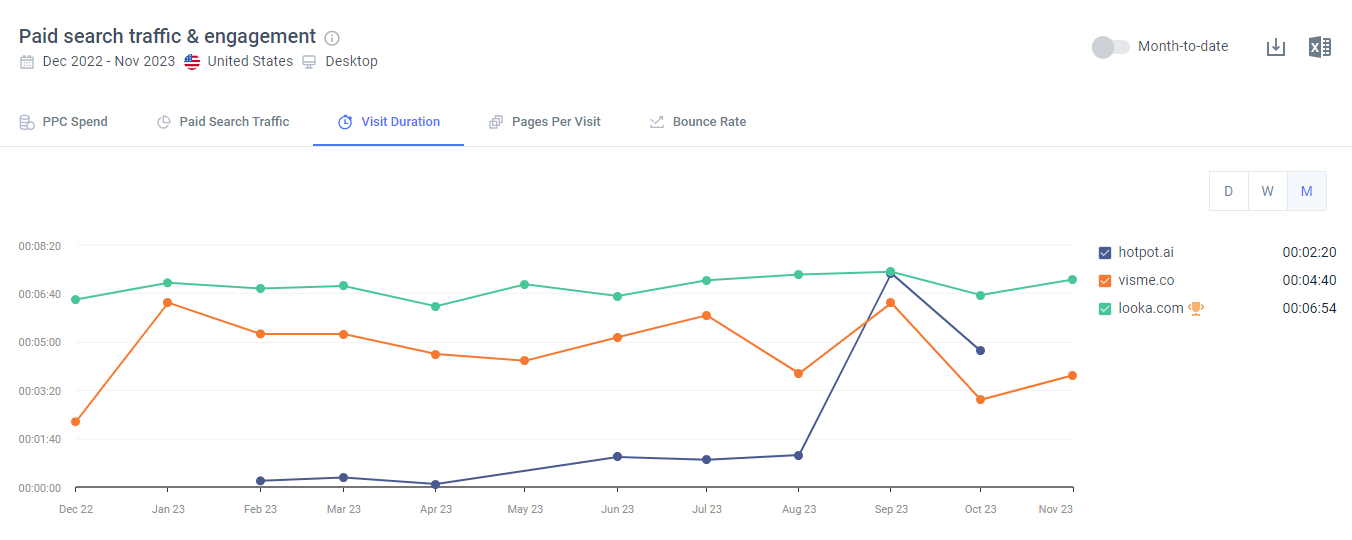
What’s more, looking at the Paid Search Visit Duration, Looka is not only bringing more paid traffic than their competitors, but they are also able to keep them on their site longer. This might be a place for Hotpot to improve. They can do this by analyzing Looka’s ads and landing pages as well as looking at their Conversion Rate Optimization (CRO) and site structure.
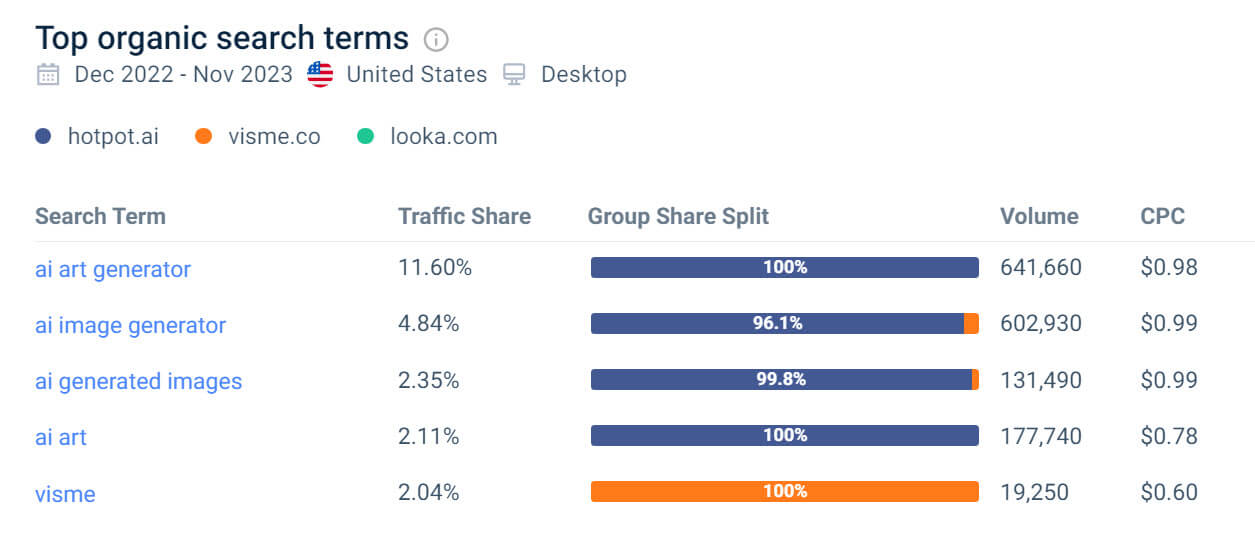
Now, on to the top organic search terms.
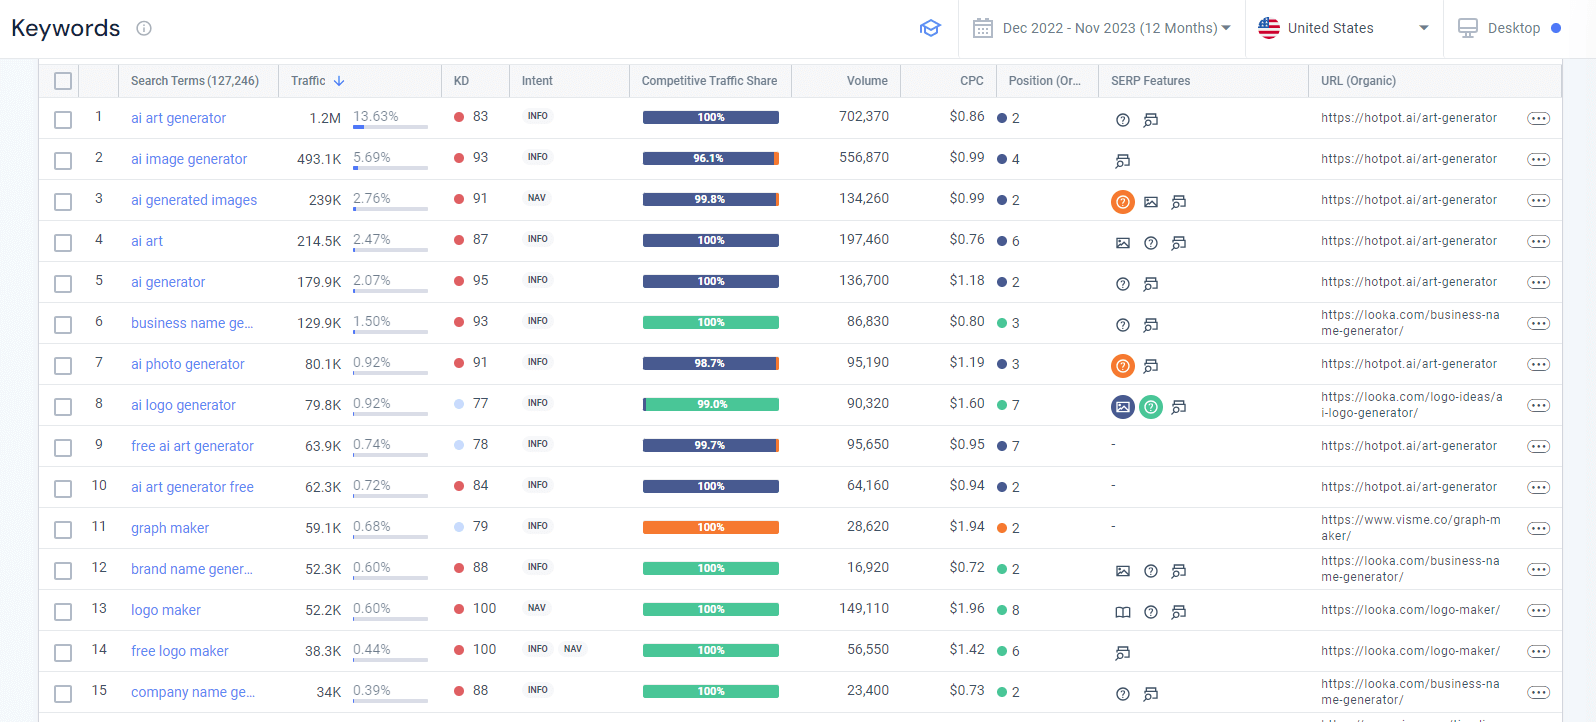
As you can see, Hotpot is winning on non-branded terms. Taking a wider look at the non-branded keywords, we see that Hotpot is winning on AI image generation keywords, and Looka is winning on AI logo and business name generator keywords.
We now have some actionable insights into how Hotpot can increase its market share. And believe me, we are just scratching the surface.
4. Strategic group analysis
Strategic group analysis is a way to understand your competitive environment. It involves grouping companies within an industry based on similarities in:
- Product
- Target market
- Strategy
- Market positioning
- And more
An industry can consist of one or more strategic groups. By identifying these strategic groups, you can gain a nuanced understanding of the competitive landscape, enabling you to make more informed business decisions and fine-tune your own strategies.
5. Market mapping
Market mapping is a way to visually arrange all the companies in an industry on a map that represents how they compete with one another with the goal of spotting gaps in the market. A gap in the market is simply a group of potential customers whose pain points are not being addressed by the businesses in your market.
Once you’ve found a gap in the market, you can:
- Launch a new product
- Increase your market share
- Reposition your current offering
To get started, plot your industry competitors onto a graph with two different variables. For instance, when looking at products, you might plot price and quality.
Once you map out your competitors on this graph, you can quickly see which competitors are offering low-priced, low-quality products and who are offering high-priced, high-quality products.
With this you can also look for any gaps there are in the market. Are there any high-quality, low-priced products or low-quality, high-priced products?
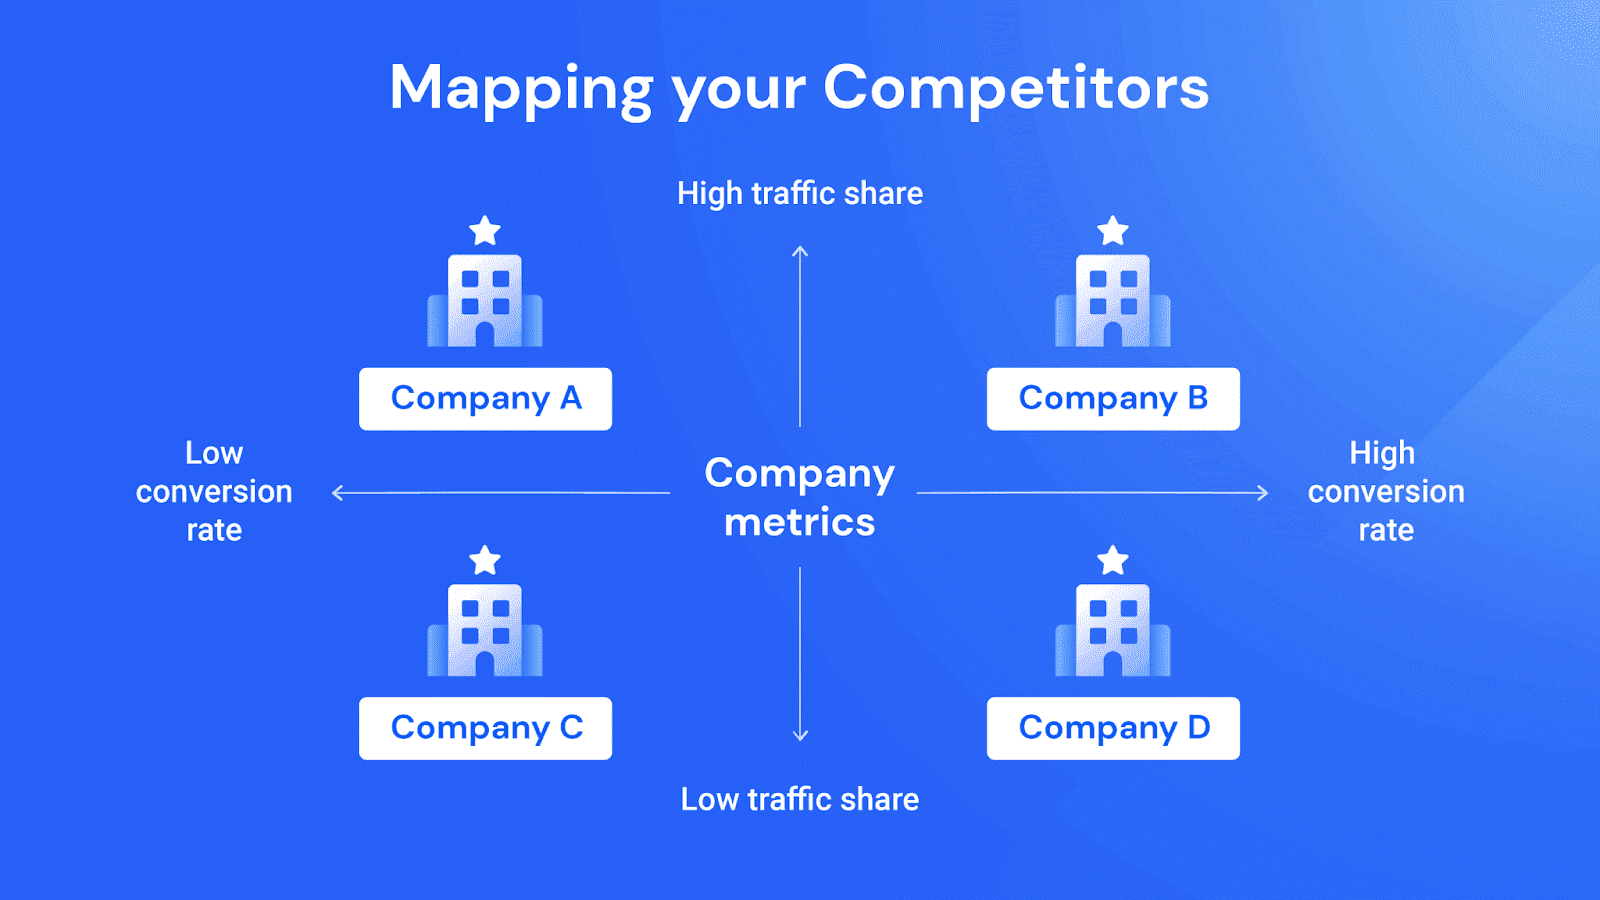
For instance, if you were trying to understand how successful your competitors’ marketing efforts are, you might plot Traffic Share against Conversion Rate.
Let’s take a data-based approach to market maps with the Similarweb Players report.
Competitive landscape analysis example with Similarweb
This report evaluates the industry’s leading digital competitors using predefined metrics. You can assess them across four tabs:
- Audience Growth
- Brand Strength
- Cost Efficiency
- Loyalty & Retention
For example, below, we are analyzing the audience growth of top sites in the Animation and Comics industry.
As you can see mangadex.org, 9anime.to, mangago.me, and bilibili.com are all in the Emerging Players quadrant. This means they occupy a relatively small audience size but have a large growth rate.
Comicbook.com, on the other hand, has found itself in the Stagnating Players quadrant as it occupies a substantial market share but shows a below-average growth rate.
6. BCG Matrix
The Boston Consulting Group (BCG) Matrix or Growth-Share Metrix is a tool that helps a company understand the value of its products or services. This is done by graphically plotting its products and services on a four-square matrix, with the y-axis representing the rate of market growth while the x-axis represents the company’s market share.
This competitive matrix aims to evaluate its products to understand what to invest in further or what to discontinue.
Each of the four quadrants represents a different type of business:
Dogs
These businesses have a small market share and small growth. In other words, the company literally works like a dog. Because they have minimal growth, Dogs (or Pets) are not a good place to invest.
Cash Cows
Cash Cows have a large market share with small market growth. This means you will get large returns for little investment, and you can milk a cash cow for all it’s worth.
Stars
Stars show a large market share and also ongoing growth. These businesses attract investment and can gain market share in a growing market.
Question Marks
Question Marks have little market share, but they are gaining market share. This means with the right investment, Question Marks can become Cash Cows or even Stars.
7. Perceptual mapping
Perceptual mapping is a visual way to represent how your target audience perceives your brand in relation to your competitors. This is plotted on a graph that represents two criteria that are relevant to your target audience.
To get started, choose two important factors to your customers and plot your businesses and your competitors on that graph. This analysis aims to get a high-level understanding of how your prospects view your business in relation to your competitors. This will help you spot gaps in the market and find hidden opportunities.
Here are some factors that customers might be interested in.
- Price Range: High-end vs. budget-friendly options.
- Product Quality: Premium quality vs. basic quality.
- Brand Reputation: Well-established brands vs. new or niche brands.
- Convenience: Ease of use, accessibility, and availability.
- Design and Aesthetics: Stylish and trendy vs. classic and functional.
- User Experience: Intuitive interfaces and user-friendly experiences vs. complex setups.
8. Porter’s Five Forces
Competitive Analysis is complex. To deal with these complexities, Porter’s Five Forces identifies five competitive forces that shape any industry.
How do you evaluate how successful a business is? We might think it’s the biggest business, but in reality, the most successful business is the most profitable one.
Profitability is defined by five competitive forces:
- Competition in the industry
- Threat of new entrants
- Bargaining power of suppliers
- Bargaining power of new buyers
- Threat of substitutes
9. Audience analysis
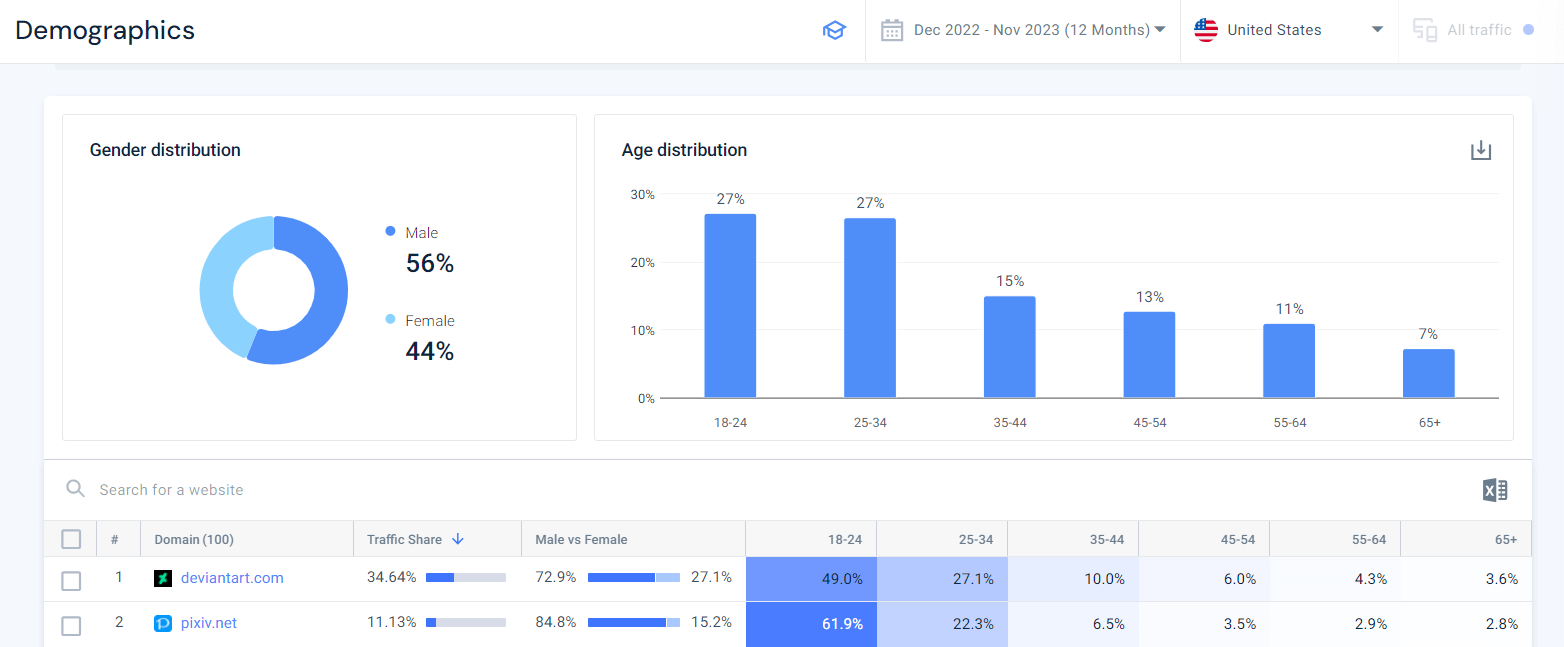
Understanding your audience is a crucial part of competitive landscape analysis because not every marketing message works for every audience. An easy way to do this is through the Similarweb Market Analysis Demographics report.
This tool is designed to give you a big-picture snapshot of entire markets. By looking at the Demographics report, you’ll have quick access to key metrics.
Above, you can see demographic metrics for the Visual Arts and Design market. In general, the market slightly leans towards a male audience. In terms of age, the biggest audience is between 18 and 34.
Another thing to think about is your audience’s location. You can easily find this information in the Geography report.
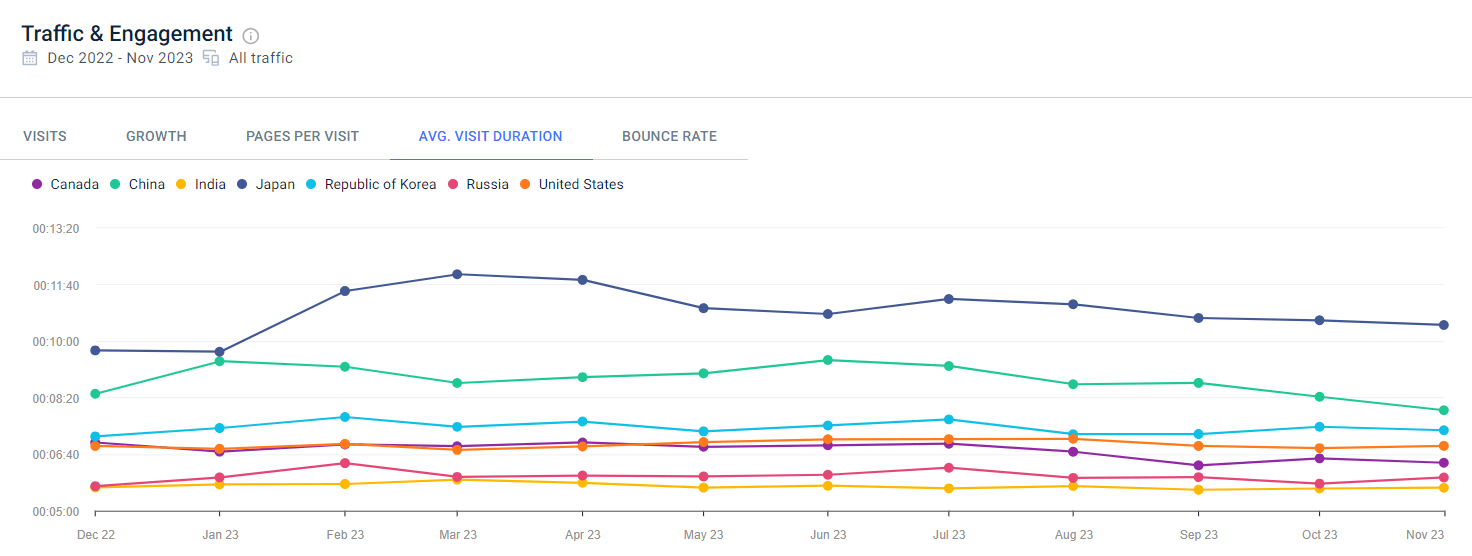
Above, you can see that the Average Visit Duration in Japan is higher than in other locations.
Again, measuring traffic & engagement, we see that Japan is clearly leading the pack.
Another way to look at your audience is by how they interact with sites in your industry.
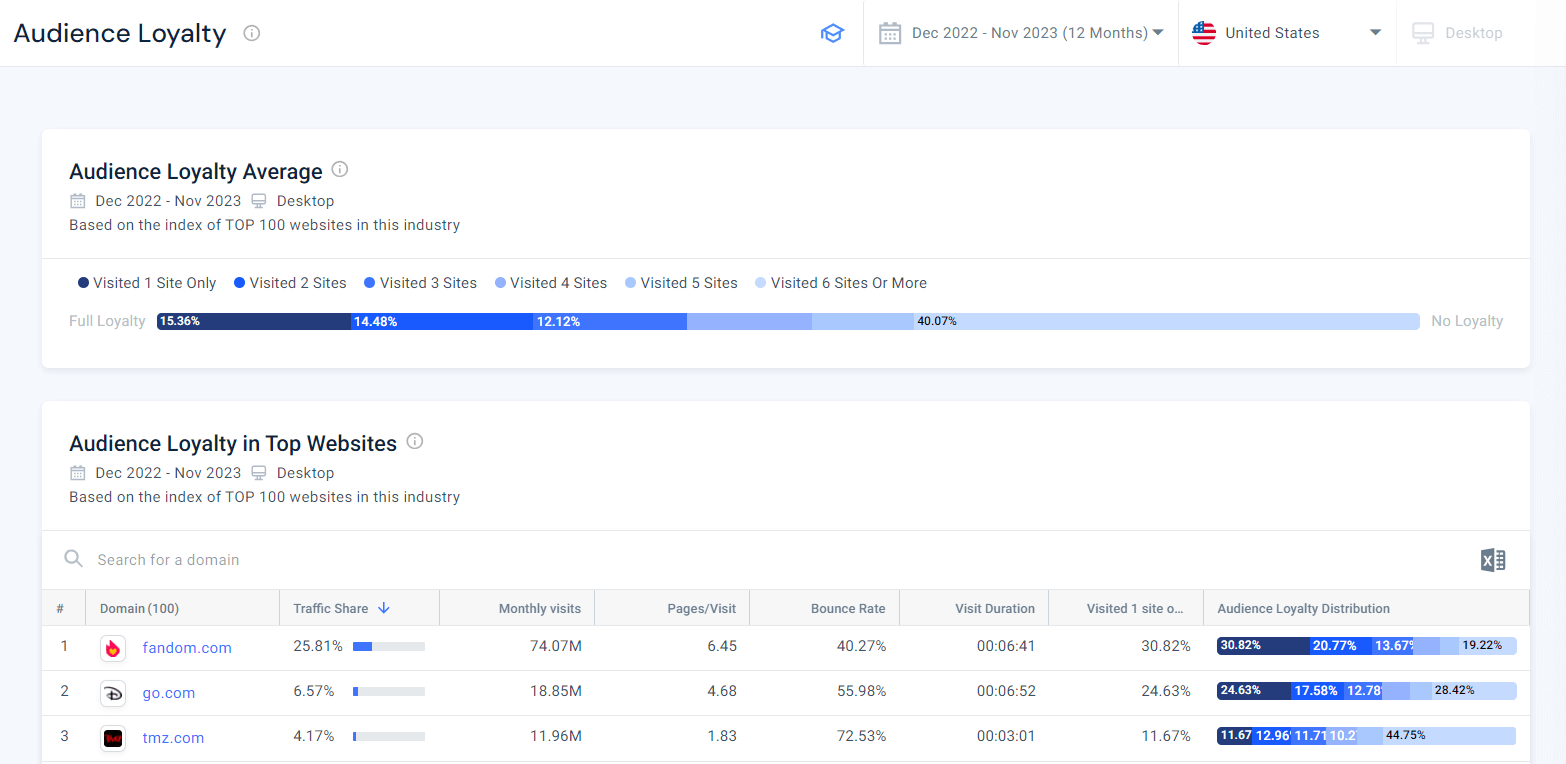
Below, we are looking at the Audience Loyalty Average for the top sites in the Arts and Entertainment industry within the US.
We can see that 15.36% of site visitors only visited one site, while 40.07% of visitors visited six or more sites. This is a useful metric that will give you an industry benchmark of what percentage of your audience should become superfans and what percentage will shop around.
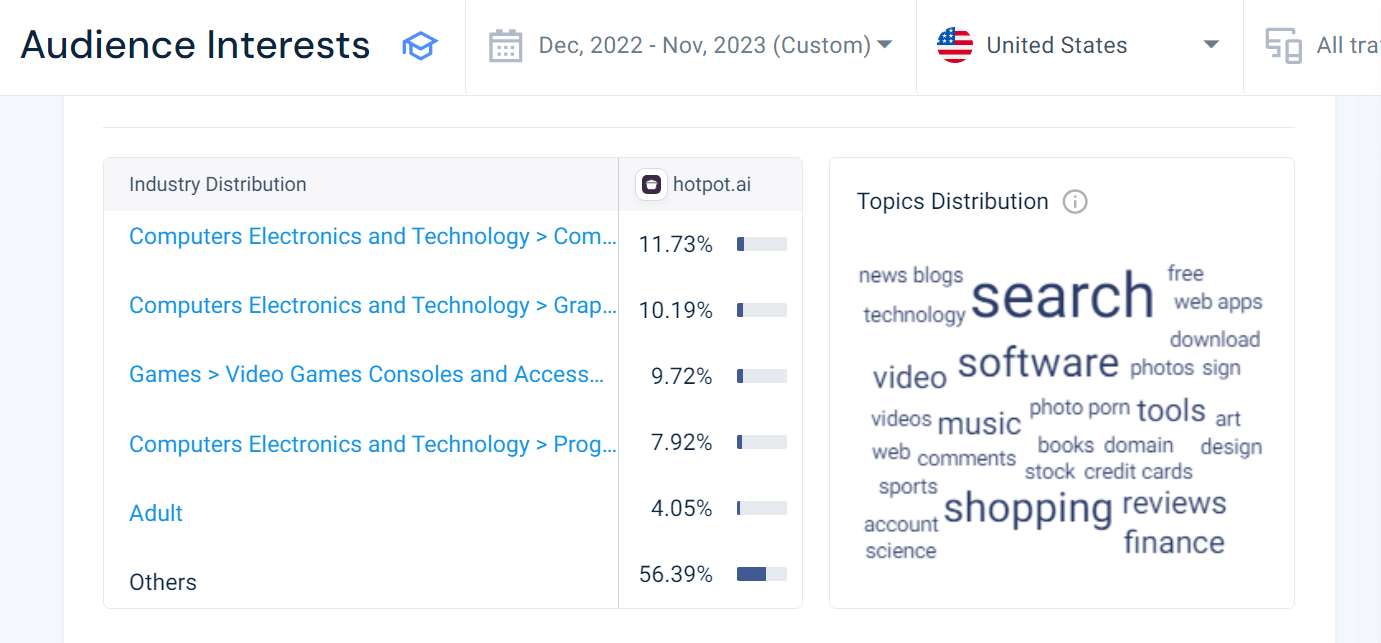
If you want to see your audience interests, drop your competitors into the Similarweb Website Analysis and click on the Audience Interests tab.
Below, you can see the audience interests and Industry Distribution for hotpot.ai.
You’ve seen your audience metrics, it’s now time to look at your competitors’ content.
10. Content analysis
Your competitive landscape analysis won’t be complete without an understanding of the types of content leading sites are producing.
Marketing Channels
Before you get too granular, you should first understand what types of content they are creating. To do this, go to the Marketing Channels report in the Web Category Analysis tool.
Above, you can see the Marketing Channels for the top websites in the Publishing and Printing industry. The biggest channels are Direct (51%), Organic Search (30%), and Paid Search (7%).
This means companies in this market are generally competing in these areas. What’s more, the significant volume of Direct traffic is a sign that the top sites have strong brand recognition.
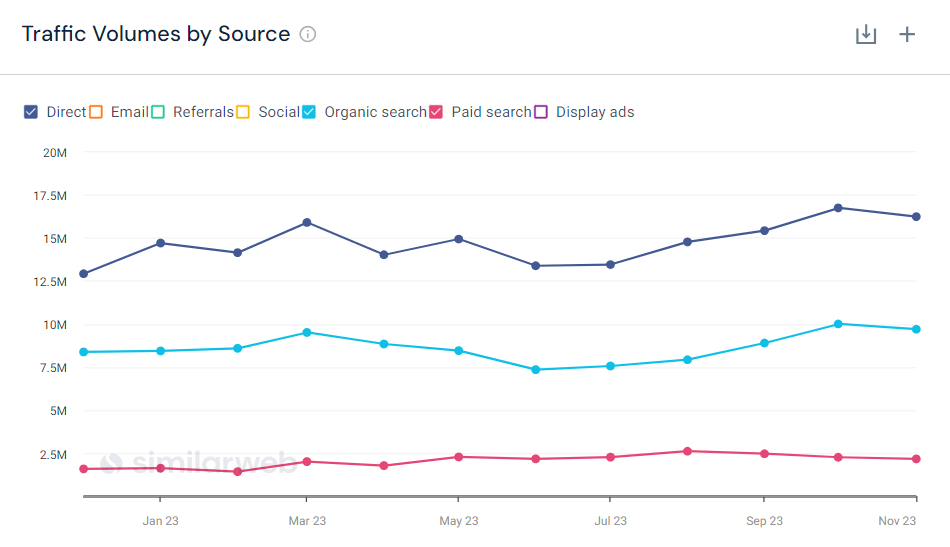
It’s also important to understand how those channels are trending over time.
Above, you can see that Direct, Organic Search, and Paid Search are steadily growing.
Now that you understand what channels are bringing your competitors traffic, it’s time to look at their actual content. The best way to do this is with Similarweb’s Organic Pages report in the Website Analysis tool.
Organic Pages
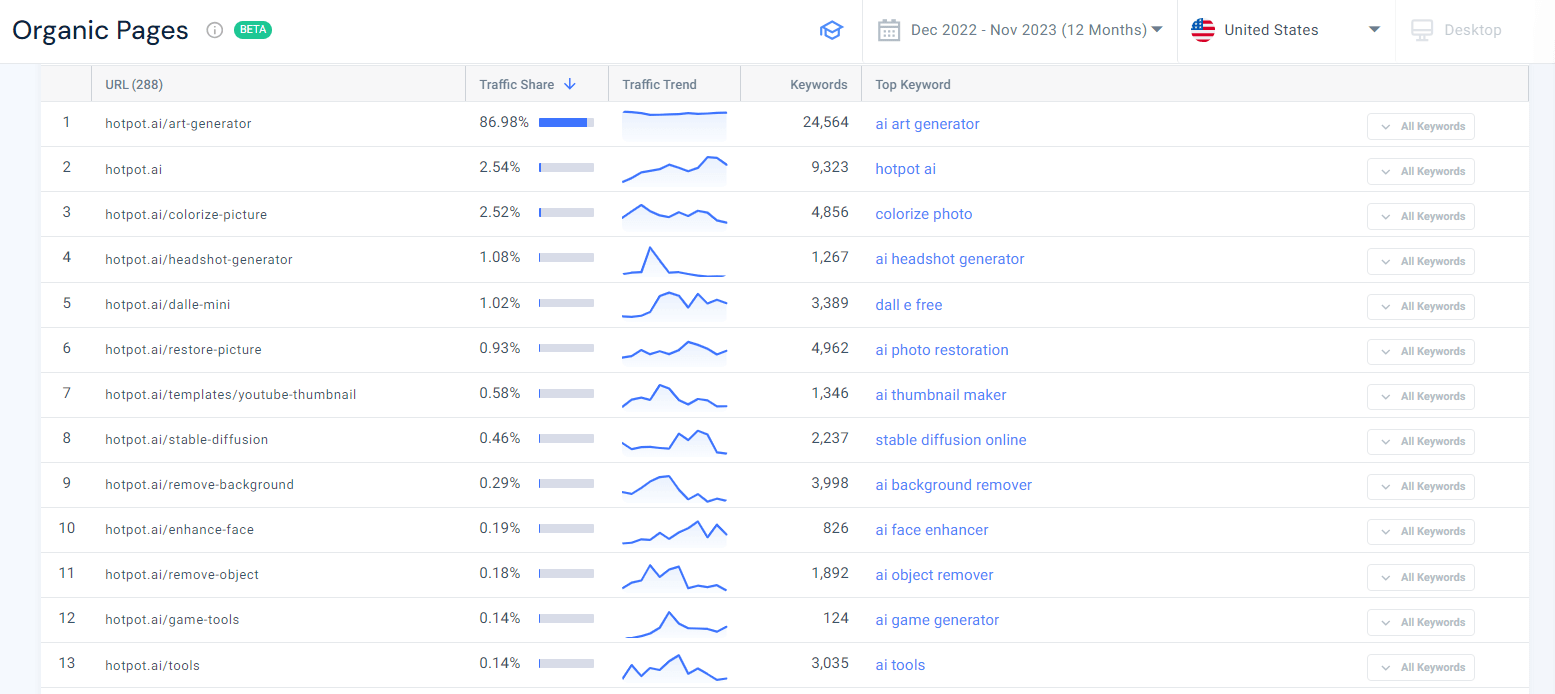
Below we are looking at the organic pages for hotpot.ai.
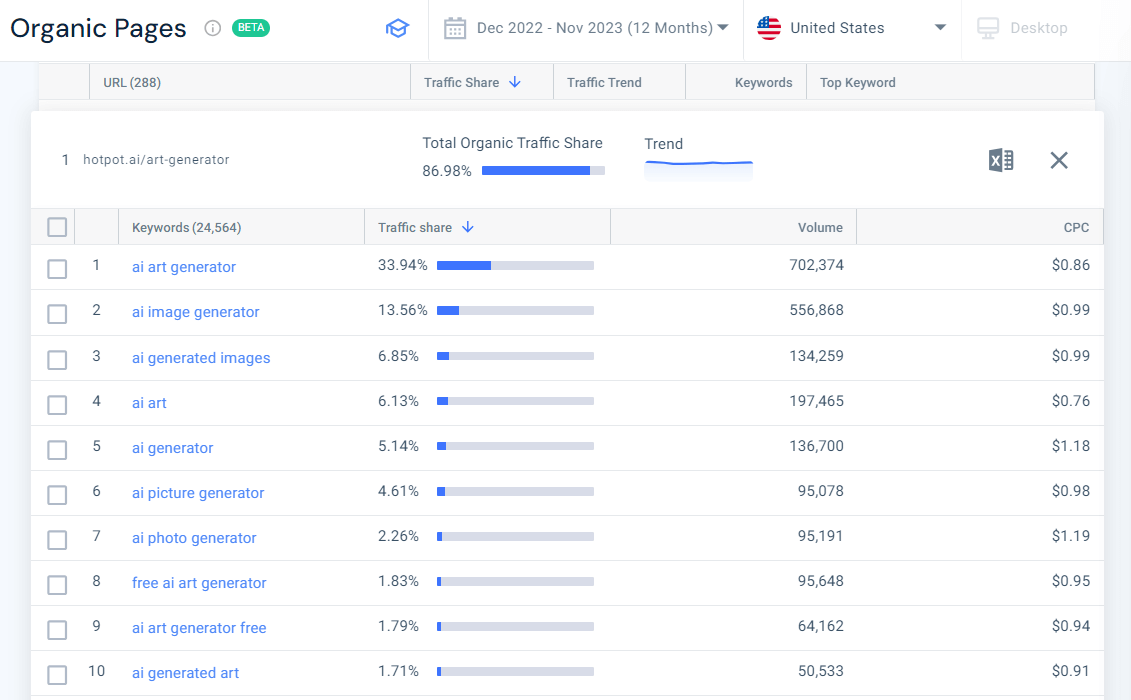
Not surprisingly, hotpot.ai/art-generator is getting 86.98% of all their organic traffic. Looking at the Traffic Trend graph, we see that this page is stable and is ranking on 24,564 keywords.
Do you want to see the keywords the page is ranking on? Just click the All Keywords button in the bottom right corner of the dashboard.
This report will help you dig into your rivals’ top-performing pages.
Paid Search
You’ve seen their Organic Landing Pages. It’s now time to look at their paid content. To see your competitor’s paid ads, go to the Paid Landing Pages Tool. Below, you can see the Paid Landing Pages for looka.com.
You can also see their ad spend, the keywords they are bidding on, and the ads they are displaying on Google.
This will show you the creatives with the greatest Traffic Share and their ad copy. Looking at ad copy is a great way to inspire your own ad copy.
Build your marketing strategy
Once you’ve done your competitive landscape analysis, it’s time to build out your marketing strategy. We’ve shown you a few ways to analyze almost every aspect of your competitive landscape.
Use competitor research, strategic group analysis, and market mapping to get a comprehensive picture of your market. Then, view it through the eyes of your prospects with perceptual mapping.
This analysis will give you a clear picture of where the demand is and how your competitors are serving it. It will also give you an understanding of the gaps in the market.
Before making any strategic decisions, a SWOT analysis will give you clarity on how your unique strengths can turn threats into opportunities.
Once you have that clear, it’s time to think tactically by doing audience and content analysis.
A 30,000-foot view of your market
A thorough Competitive Analysis is a powerful tool for you to navigate your industry’s dynamic landscape effectively.
We’ve covered how you can analyze the strengths, weaknesses, opportunities, and threats of the key market players in your industry. With these insights, you’ll be able to make better-informed strategic decisions.
FAQs
What does competitive landscape mean?
A competitive landscape refers to the overall structure and dynamics of a market or industry, including the various businesses and entities that operate within it. It provides a comprehensive view of the competitive environment, outlining the relationships, interactions, and competitive forces that shape the industry.
How do you do a competitive landscape analysis?
Here’s how to conduct a competitive landscape analysis effectively:
- Define objectives
- Identify key players
- Market share analysis
- Barriers to entry
- Supplier and buyer power
- Substitute products or services
- Regulatory environment
- Technology trends
- SWOT analysis
- Data collection
- Synthesize findings
- Strategic implications
Your full marketing toolkit for a winning strategy
The ultimate solution to help you build the best digital strategy
