Top Tech Stocks and How to Track Their Performance

Meet the Magnificent 7. No, not the cast from the big screen. In our world, it refers to the seven big tech stocks of 2023:
- Apple (AAPL)
- Amazon (AMZN)
- Alphabet (GOOGL)
- Meta Platforms (META)
- Microsoft (MSFT)
- Nvidia (NVDA)
- Tesla (TSLA)
While this list of top technology stocks is made up of the most discussed and well-known stocks in the tech world, the industry encompasses numerous subsectors, including the rapidly evolving Artificial Intelligence (AI). Alternative data provides valuable insights into this dynamic domain.
Before delving into sector and company performance, let’s start at the beginning.
What are technology stocks?
Technology stocks include any business providing a technological product or service encompassing a wide range of subsectors, such as SaaS, Biotech, Fintech, and AI. They also serve as key economic and stock market indicators. The sector includes companies involved in computer operating systems, applications, technology consulting, manufacturing of computer equipment, data storage products, networking products, semiconductors, and components, with the majority based in the US.
Now, the good stuff.
Top tech stocks
At the end of 2023, the NASDAQ was up 43%. The top-performing tech stocks in 2023 vary from list to list and from financial news site to financial news site.
CNBC named META and NVDA as two top contributors to NASDAQ’s rebound. They have spots on Morningstar’s top-performing technology stocks list as well. Both are part of the Magnificent 7 but occupy two different industries. META is, of course, one of the biggest players in social media, and Nvidia is a groundbreaking technology company focused on GPUs and AI.
While both companies are required to release their financials quarterly per SEC regulations, their performance can be tracked and monitored during non-reported periods using Similarweb alternative data.
Inside META
META’s performance can be analyzed across three key metrics: website, app, and ad portal traffic and engagement.
On Similarweb Stock Intelligence, measuring website traffic and engagement is simple, with all of the company’s digital assets aggregated by ticker.
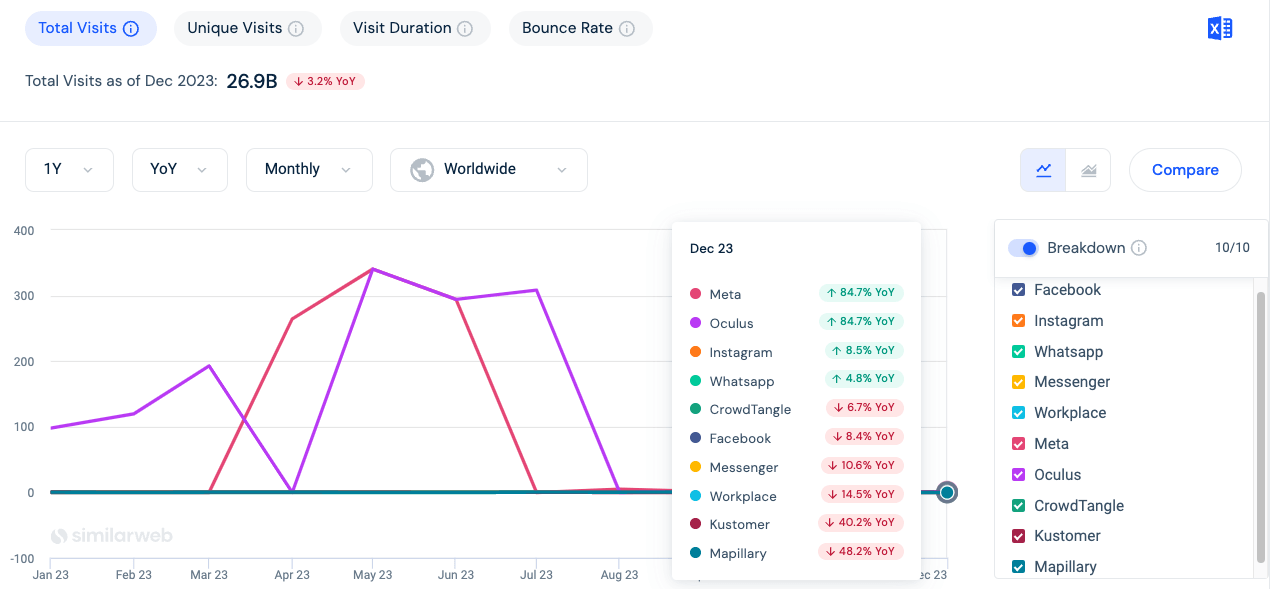
Meta.com, oculus.com, instagram.com, and whatsapp.com contribute to META’s traffic growth, up 84.7%, 84.7%, 8.5%, and 4.8% YoY, respectively. Facebook.com (including the individual country domains), messenger.com, and workplace.com are not faring as well, down 8.4%, 10.6%, and 14.5% YoY, respectively. This has dropped the company’s overall traffic by 3.2% YoY.
App engagement, especially for a social media giant, provides a clearer picture of performance.
On iOS, Instagram takes the majority of the traffic across the social apps, reaching over 97M monthly active users in September 2023 compared to Facebook’s 65M in the same month.
On Android, Facebook has almost double the amount of monthly active users than Instagram. In December 2023, FB had just over 81M monthly active users, compared to 50M on IG. Messenger has significantly more monthly active users in December 2023, with 73.8M on Android and 61.9M on iOS.
For some industry perspective, in that same month, TikTok had 120.7M monthly active users on iOS, but only reached 35.7M on Android.
So, is META cashing in on its captive audience?
Business.facebook.com still receives the lion’s share of the traffic when it comes to the profit side of social media. In March 2023, Facebook’s ad portal, which also serves Instagram, reached 227M visits. Ads.tiktok.com ranked second but only had 6.9M visits in that same month. Bringing up the rear, ads.snapchat.com with 3.2M and ads.pinterest.com with 1.6M visits.
Big brands also utilize the portal for organic posts as well as paid advertising but it’s still a good indicator of company and performance.
Inside NVDA
NVDA is a multifaceted company. Simply looking at overall website traffic will only provide a fraction of the story, but it’s a good place to start.
January saw the most visits to nvidia.com in 2023 globally, with 49.5M. November saw 49.3M visits, and February had 46M.
While the majority of Nvidia’s customers are enterprise corporations (i.e., MSFT, META, GOOGL, CSCO) and are purchasing GPUs and chip systems, the pandemic had a positive impact on the company’s gaming data center and professional visualization market platforms as a result of people working, studying, or playing from home.
Breaking down visits by segment makes it easier to see how engaged consumers are with NVDA.
The shop page has the least amount of traffic for the segments analyzed above, receiving more than 100K visits in 1Q23 but then dropping to 92K in April and 68K in July. However, devices installed with NVDA graphics cards and GPUs can easily be purchased through other retailers.
The page with access to the free drivers (needed to ensure that computer hardware works as intended with the latest software, games, and applications) is a much more active page on the site. In 2023, the page housing the driver downloads saw anywhere between 6.1M and 8.9M visits.
GeForce NOW, NVDA’s 4-year-old cloud gaming platform, also saw annual traffic in the millions. December had the most visits, with 4.9M. However, the membership page saw significantly less traffic in 2023, starting with 1M visits but dropping significantly throughout the rest of the year. July saw only 260K visits to the page. There is a free option where users can access the platform for an hour per day without paying, possibly contributing to the lower traffic rates.
It all comes together on nvidia.com’s login page. Both individual consumers and enterprise customers are regularly accessing their accounts. January saw 39M users access the login page, and December saw 35M. The rest of the year saw between 25M and 31M visits to the login page.
Top Fintech Stocks
Financial technology, or fintech, is used to describe new technology that seeks to improve and automate the delivery and use of financial services for the benefit of businesses and consumers. The subsector is comprised of various companies like Visa and Mastercard, Paypal, Robinhood and Coinbase, Klarna, and Plaid. Some that outperformed in 2023 were Block, Inc. (SQ), Global Payments (GPN), Shift4 Payments Inc. (FOUR), and Affirm (AFRM).
First up is SQ, which saw a 23% stock gain in 2023 (according to Investors Business Daily). SQ is the parent company of Square, a business payments and POS service; Cash App, a financial services platform; and Afterpay (ClearPay in the UK), the Buy Now, Pay Later (BNPL) platform, among others. Each subsidiary can be tracked separately, but Similarweb Stock Intelligence provides a holistic view of company performance.
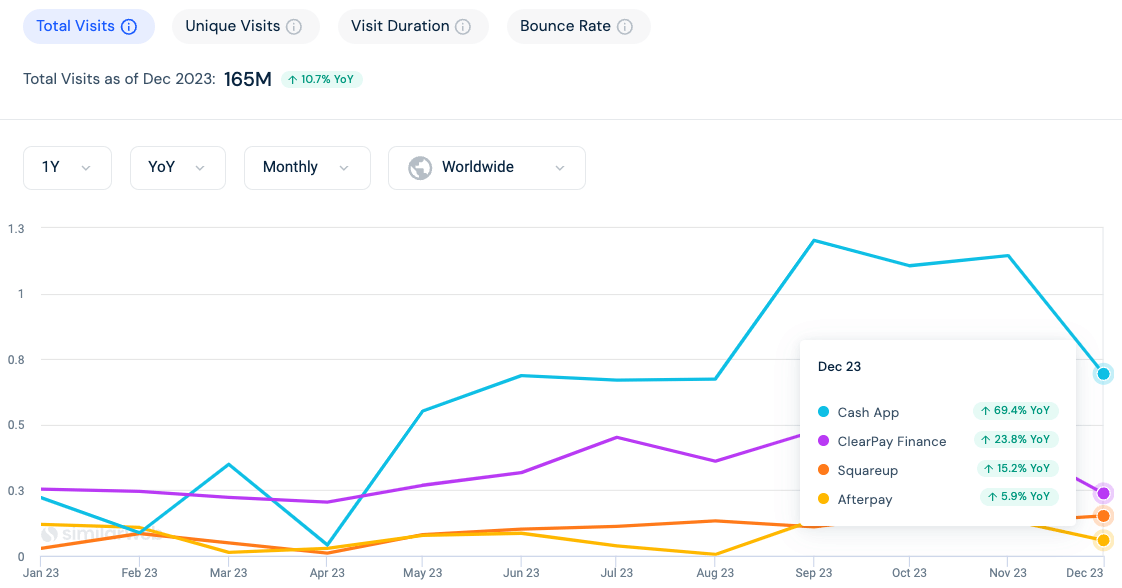
Cash App is currently leading all of SQ’s subsidiaries in YoY growth of its monthly traffic. In 4Q24 alone, the platform saw 102.9% YoY growth in October, 101.1% in November, and 54.8% in December.
While Cash App saw the most significant growth in 2023, Square maintained the highest traffic and engagement numbers.
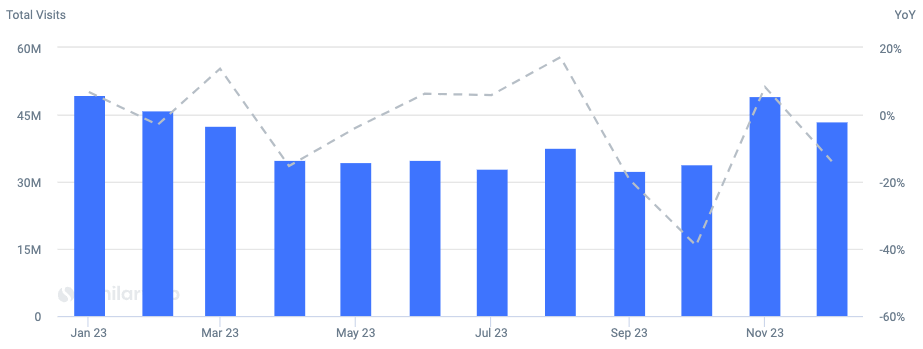
Square’s monthly visits were steady, tracking between 35M and 42M throughout 2023. This traffic includes visits to all digital assets associated with the subsidiary: squareup.cash, squareup.com, square.online, sellercommunity.com, and stitchlab.com. All of SQ’s digital assets combined experienced a 10.7% YoY increase in traffic.
Next up is Affirm. After a rough 2022, AFRM saw a tremendous rebound with stock growth of 408% in 2023 (according to Investors Business Daily), coupled with consistent YoY web traffic and engagement growth.
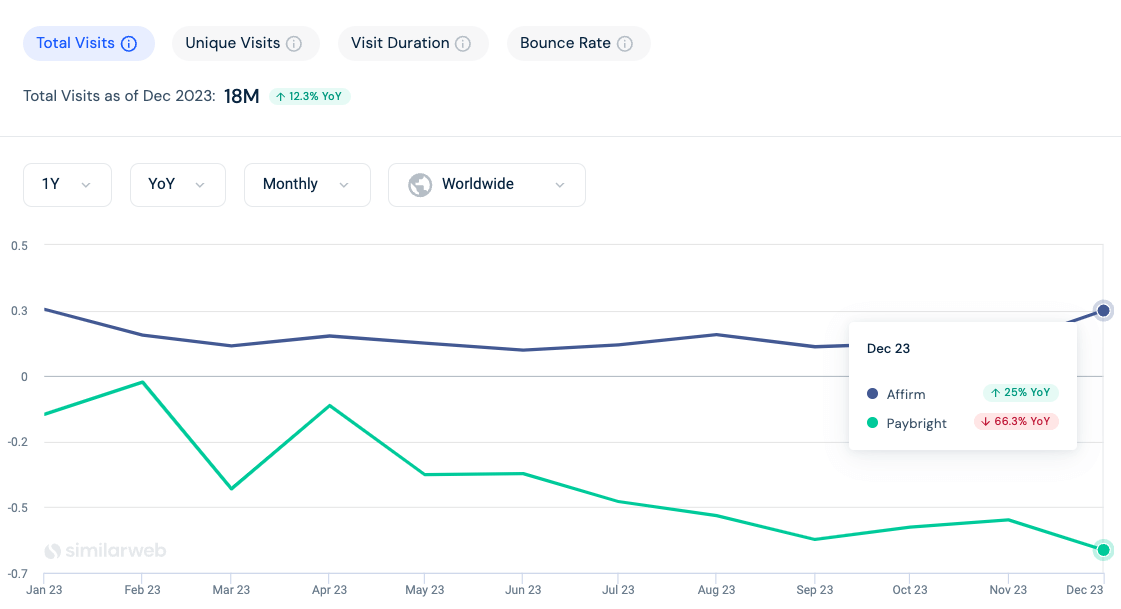
The domains affirm.com and affirm.ca showcase Affirm’s positive traffic growth, up 25% YoY in December 2023. An increase in traffic is expected for affirm.ca as the rebrand of Paybright to Affirm is nearing completion, explaining the continued decline in paybright.com’s traffic, down 66.3% YoY in December.
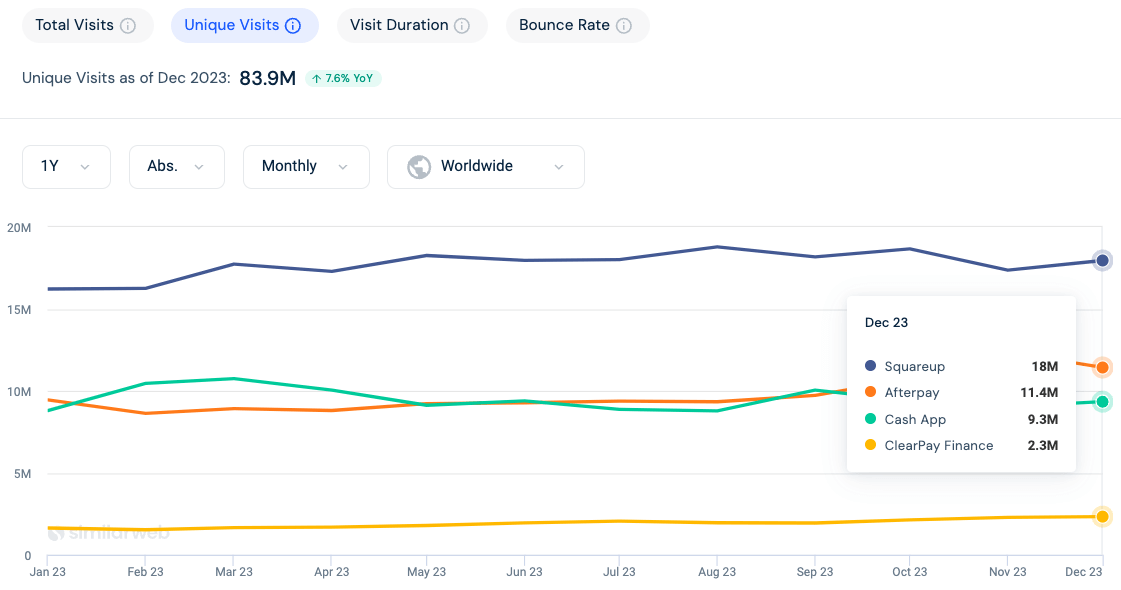
For more clarity, here’s a snippet of the BNPL landscape looking at the top three players in the segment:
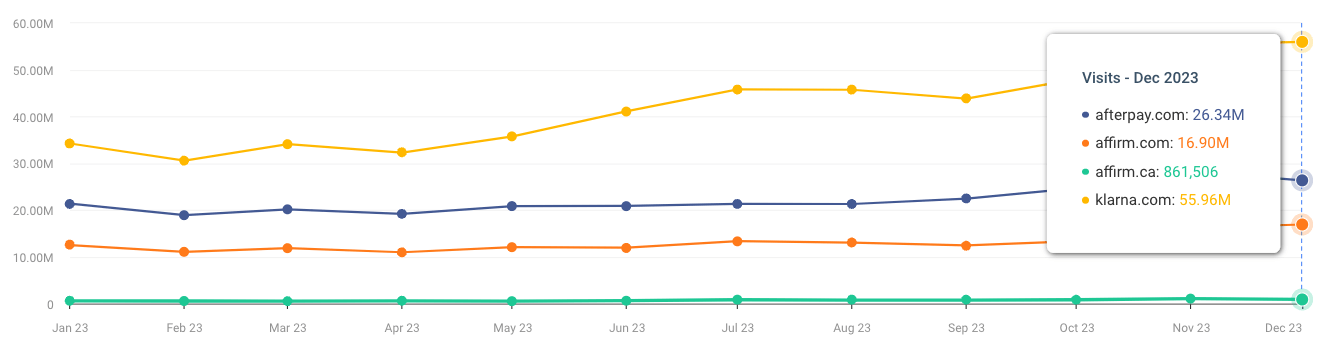
Afterpay, SQ’s BNPL, saw only 5.9% traffic growth YoY compared to AFRM’s 25% in December. But, afterpay.com had 26.3M monthly visits against affirm.com’s 16.9M and affirm.ca’s 890K. Klarna, still a privately held company, saw 55.9M visits to klarna.com in December, dominating the competition.
Top biotech stocks
Nasdaq.com defines the biotech subsector as a dynamic and innovative field that combines biological sciences with technology, encompassing a range of companies focusing on medical research, pharmaceuticals, and genetic engineering. Biotech was catapulted into the limelight during the pandemic and the race to find the first COVID vaccine. It is an interesting mashup of big pharma companies like GSK, Merck, Eli Lilly, Pfizer (the list goes on), and new disruptors and innovators. But when cross-referencing financial media’s top biotech stock lists, it’s not easy to see who’s winning.
With Similarweb alternative data, performance insights can be curated from various metrics. Biotech companies rely heavily on advertising and marketing; analyzing marketing channels provides these insights.
One name that appears on quite a few top-performing biotech stock lists is Regeneron (REGN). The company’s drug Dupixent (in partnership with Sanofi) is a good place to start. While this drug treats multiple conditions, Regeneron focuses on asthma and eczema in its marketing and advertising.
Organic and paid search are the top two marketing channels for Dupixent, with paid bringing in 37.5% of the traffic and organic 35.8%. Direct traffic is responsible for 18.4% of traffic. Both organic and direct search correlate to the significant television ad spend Regeneron allocated for advertising. The majority of a $490M budget, to be specific.
Dupixent’s top competitors are Cibinqo by Pfizer and Rinvoq by AbbVie, and they spend significantly less on advertising and marketing: $150M and $40.6M, respectively.
With the smallest ad spend, Rinvoq still manages to win traffic share in organic, paid search, and display advertising averaging 54.1%, 50.8%, and 53.8%, respectively. But, Dupixent wins the traffic share in the remaining categories. Cibinqo is at the bottom across all marketing channel metrics. Throwing dollars at the wall to see what sticks isn’t necessarily the best strategy, as proven by Rinvoq.
Top AI Tech Stocks
Artificial Intelligence is one of the hottest conversations in the media today. When looking at top AI tech stock lists, the Magnificent 7 makes another appearance, specifically Microsoft, with its $10B investment in OpenAI, as well as Amazon, with a $4B investment into rival Anthropic. Generative AI continues to monopolize the conversation.
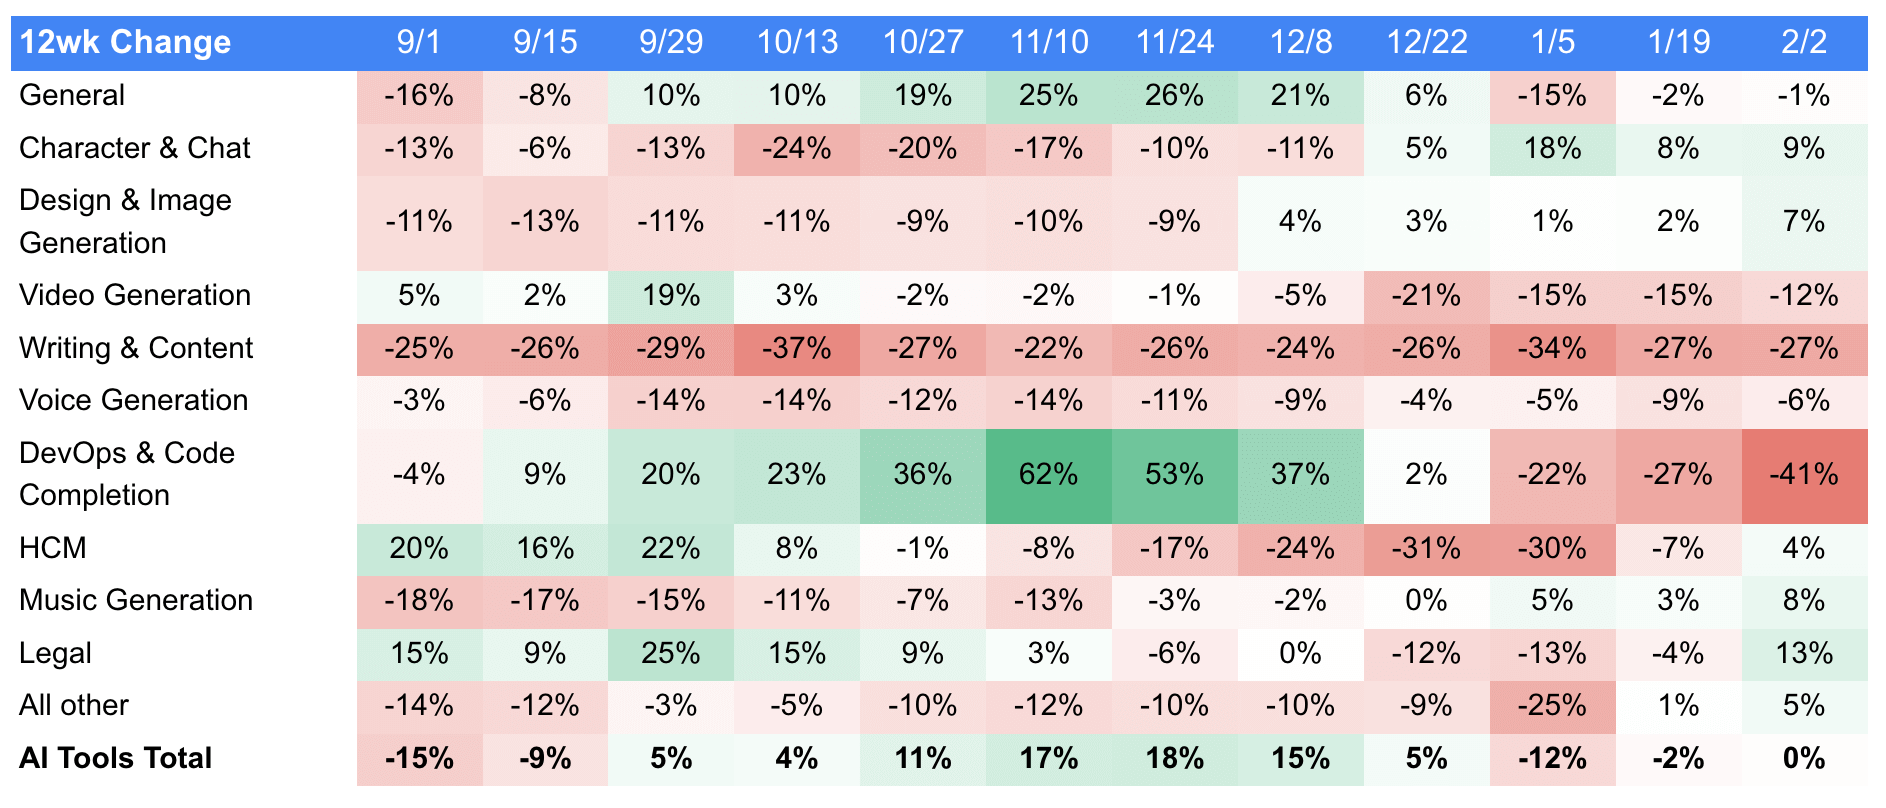
- Traffic to the Writing & Content segment remained steady over the 2-week period ending Feb. 2, 2024, but is down 27% YoY.
- DevOps & Code Completion saw a significant drop over the same 2-week period, down 14%.
- Legal traffic gained 17%, and Design & Image Generation gained 5%.
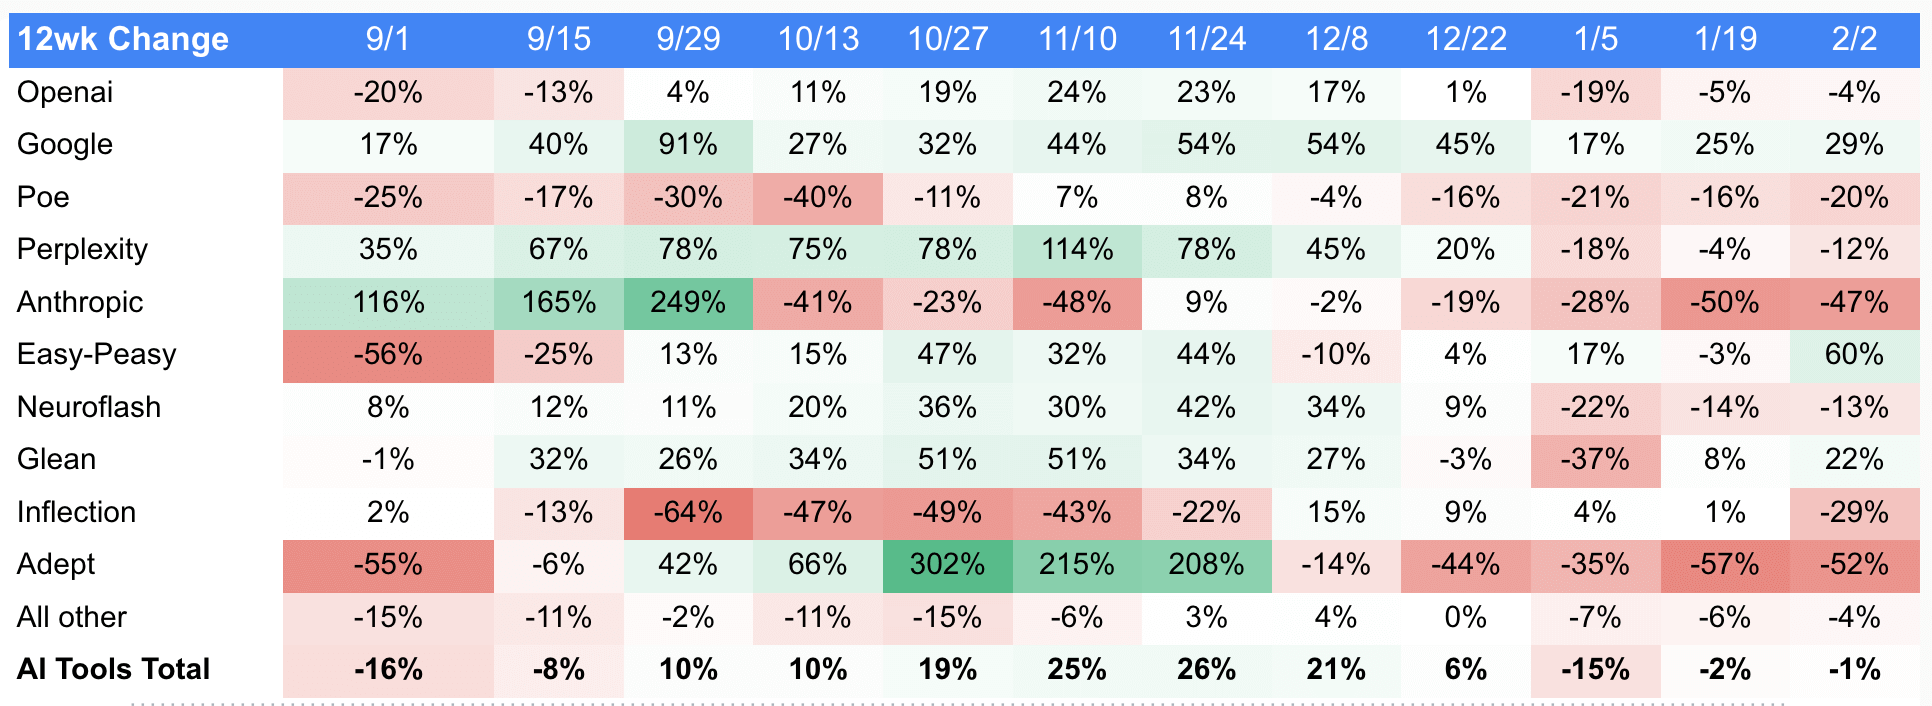
When digging into the traffic numbers of the individual company, the traffic for both OpenAI and Anthropic declined, down 6.6% and 22.8%, respectively, when comparing 4- and 12-week trends.
The top AI tech stocks to watch, along with AMZN and MSFT, include NVDA, Crowdstrike (CRWD), Arista Networks (ANET), and Salesforce (CRM).
Tracking top tech stocks with Similarweb
These insights barely scratch the surface. The technology sector has 789 stocks with a combined market cap of $16.9 trillion and total revenue of approximately $2.9 billion. That’s a lot to keep track of when investing in high-tech sector stocks.
With Similarweb Stock Intelligence, investors get access to global and regional sector intelligence and premium datasets like technographics, subdomains and folders, and conversion analysis data alongside digital traffic and engagement data. This allows them to curate insights and analyses derived from this alternative data source to support and enhance investment strategies around the tech sector.
FAQs
What are tech stocks?
Tech stocks include any business providing a technological product or service encompassing a wide range of subsectors, such as SaaS, Biotech, Fintech, and AI.
What are the top seven tech stocks of 2023?
The Magnificent 7 refers to the top seven tech stocks of 2023 and include:
- Apple (AAPL)
- Amazon (AMZN)
- Alphabet (GOOGL)
- Meta Platforms (META)
- Microsoft (MSFT)
- Nvidia (NVDA)
- Tesla (TSLA)
How can you analyze tech stocks with Similarweb?
You can curate insights and analyses with access to global and regional sector intelligence and premium datasets like technographics, subdomains and folders, and conversion analysis data alongside digital traffic and engagement data.
Related Posts


Invest using the most insightful digital alt data
Leverage data used by 5,000+ companies to improve your strategy