Digital Heat: Is Travel Still Flying?

Following the roll-out of the vaccine against the COVID-19 virus, the initial excitement of post-COVID life appears to be wearing off – slightly. What does that mean for the market? In this month’s Digital Heat we see travel trends start to stabilize following the strong growth in previous months. Read on for a deeper dive into what’s driving these trends as well as other changes in online behavior.
How are we doing this? Digital Heat, an easy-to-use heatmap to help you quickly identify at scale which industries and companies are most impacted by the current economic environment. The report tracks in near real-time year-over-year (YoY) weekly website traffic trends.
Key takeaways
- U.S. sectors with strengthening growth: Media & entertainment
- U.S. sectors with weakening growth: Online retail, travel & leisure, transportation
- U.K. industries with strengthening growth: Airlines, online accommodation
- U.K. industries with weakening growth: Online real estate, fashion, OTAs & metasearch
U.S. macro view: Key changes this month
Over the past couple of months we saw the travel & leisure and transportation sectors start to pick up in terms of their YoY growth. While the traffic growth remains above average this momentum is starting to plateau, and even reverse direction. Meanwhile, YoY growth in traffic to online retail sites, another sector that benefited from the pandemic, is now below average.
Similarweb Sector Heatmap
Weekly Website Visits YoY Heatmap
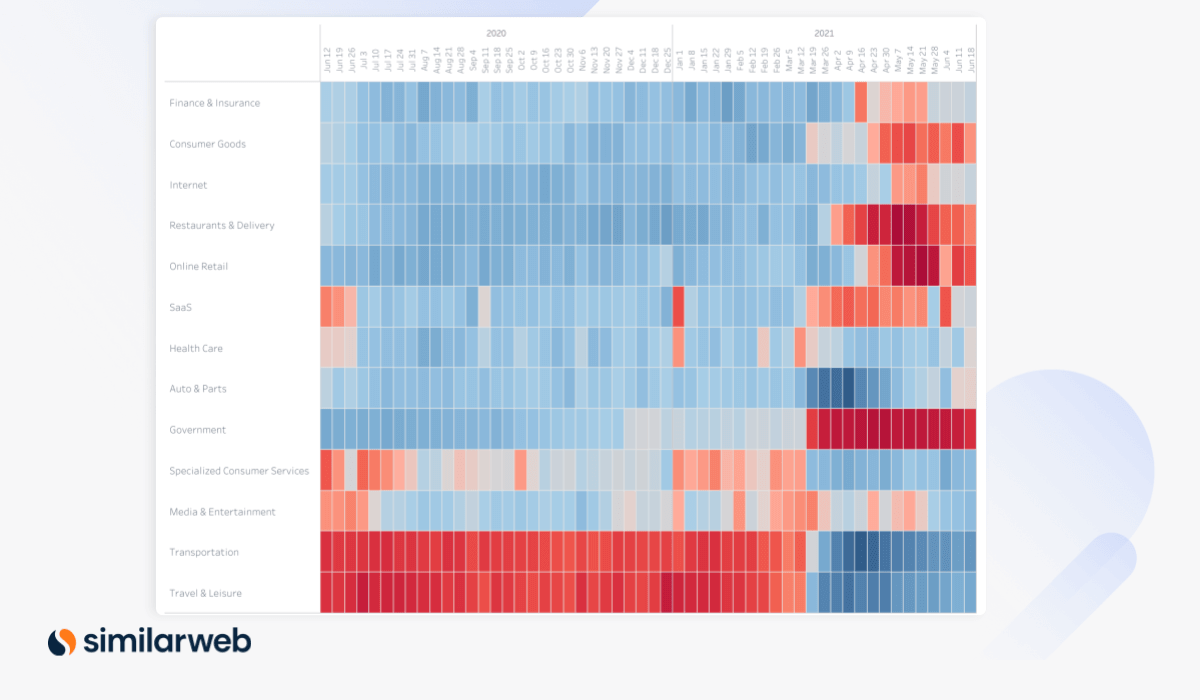
A blue box represents above average growth in visits to sites (or a group of sites)
A red box represents above average decline
U.S. micro view: Travel delays
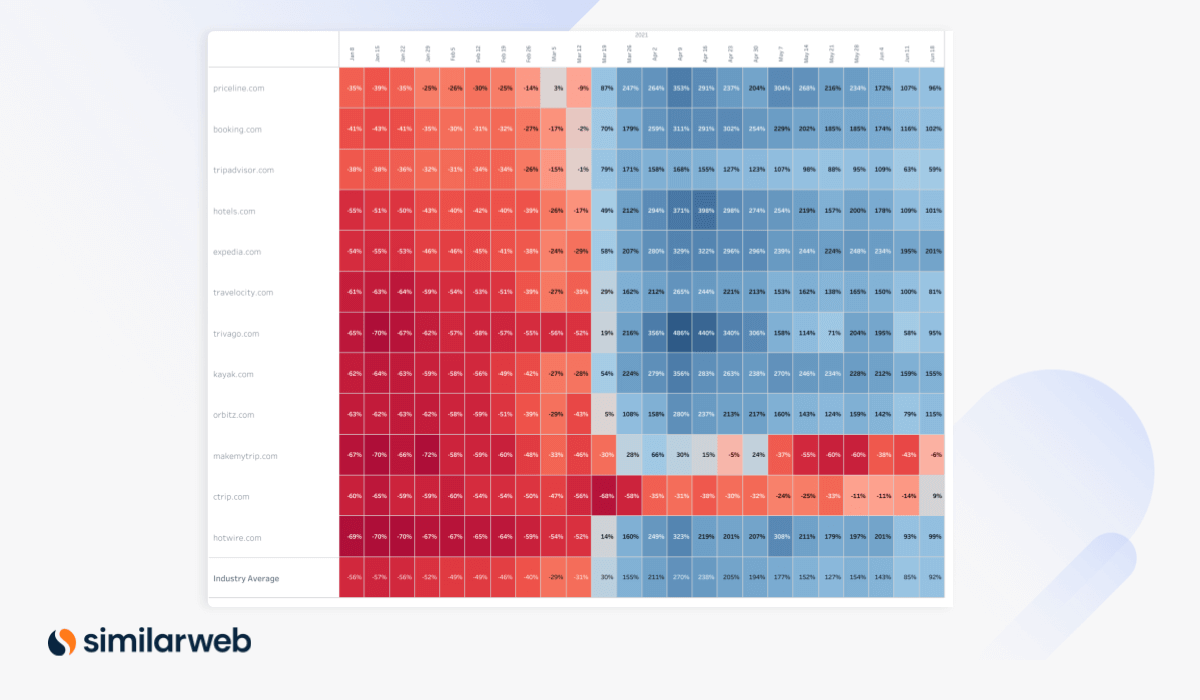
The industry average YoY traffic growth to OTA & metasearch sites peaked at 270% at the beginning of April and has since seen a gradual slowdown. Traffic growth for these sites is still incredibly robust but in the week ending June 18, reached only 92% YoY.
Traffic growth to tripadvisor.com dropped to 59% YoY in the week ending June 18, a 109 percentage point (ppt) drop from its peak at the beginning of April. The site however still maintains the largest share of online market (SoM) at 28.5% although this is decreasing significantly and represents a 7.45 ppt drop YoY.
Meanwhile, expedia.com, has managed to maintain YoY traffic growth at levels greater than 200%. It has also increased its SoM by 6.77 ppt YoY, which now accounts for 21.5%.
Weekly Website Visits YoY Heatmap and Market Share Treemap

U.S. micro view: Online retail slowdown
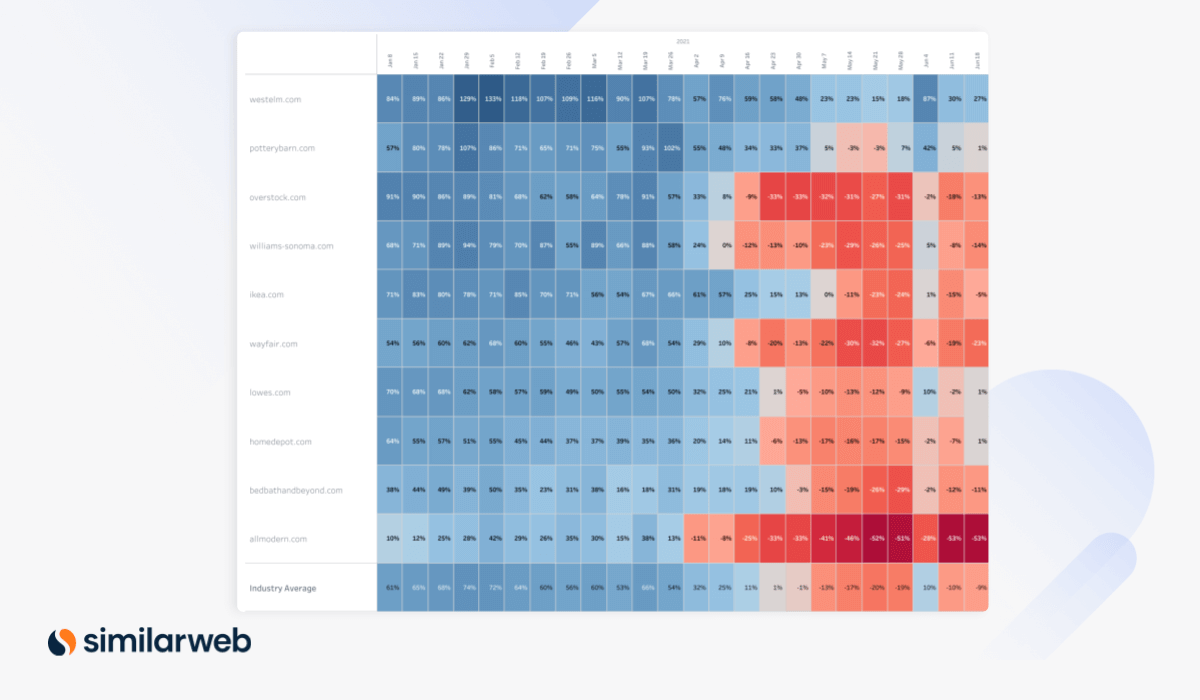
Almost all industries in the online retail sector are seeing below average YoY traffic growth. This is unsurprising given the impressive roll-out of the vaccine in the U.S. and shoppers’ preference for in-store.
While the industry average YoY traffic growth to home improvement sites has been negative for the best part of the past month, the degree of easing growth for many of the big players in this space varies slightly.
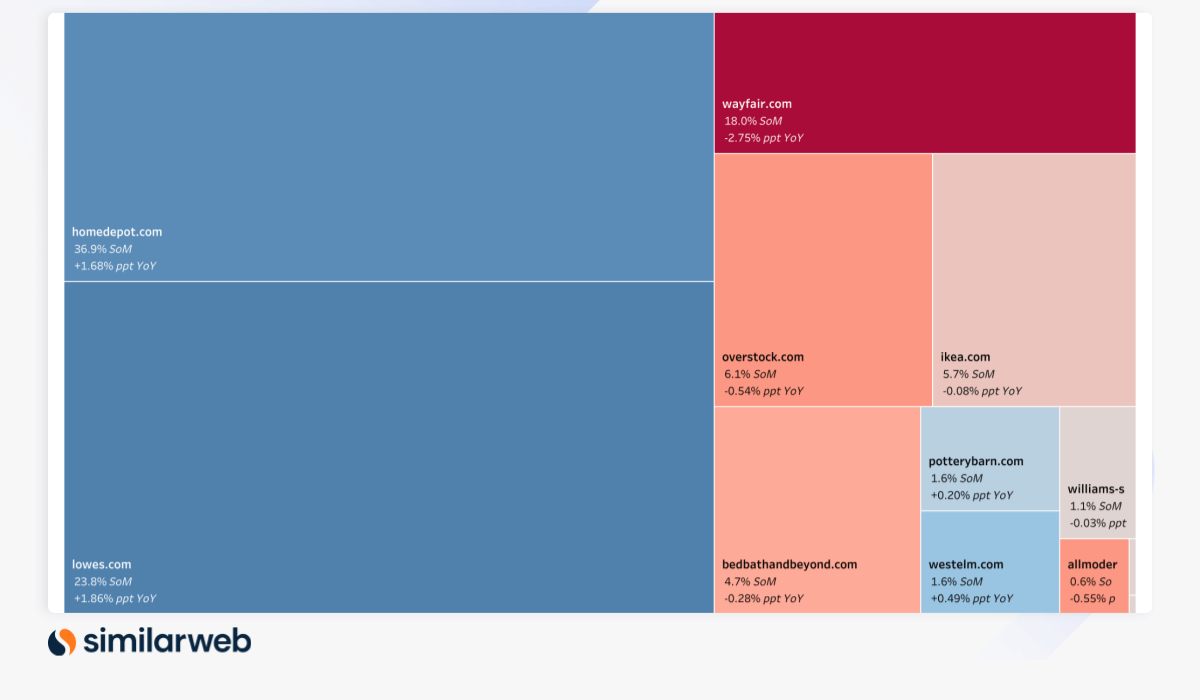
The two biggest names in this space (by SoM), homedepot.com (36.9 SoM) and lowes.com (23.8 SoM) have both seen their SoM grow YoY in June. Although both players experienced negative YoY growth in recent weeks, this has stabilized and was back at 1% for both in the week ending June 18.
The same cannot be said for wayfair.com web traffic, which saw its SoM drop by 2.75 ppt YoY in June to 18%, and is also seeing some of the highest YoY traffic declines in the industry set.
Weekly Website Visits YoY Heatmap and Market Share Treemap
Want to access more industry and company data? Book a demo now.
U.K. macro view: What’s changed?
In the U.K. YoY growth in traffic to online real estate has inflected into below average growth in the past four weeks, and UK eCommerce sites as well as UK fashion sites continue to see weakening YoY traffic growth. OTA & metasearch and UK airlines sites, that inflected to positive in late March/early April, are continuing to experience strong, above average growth.
Similarweb Industry Heatmap
Weekly Website Visits YoY Heatmap
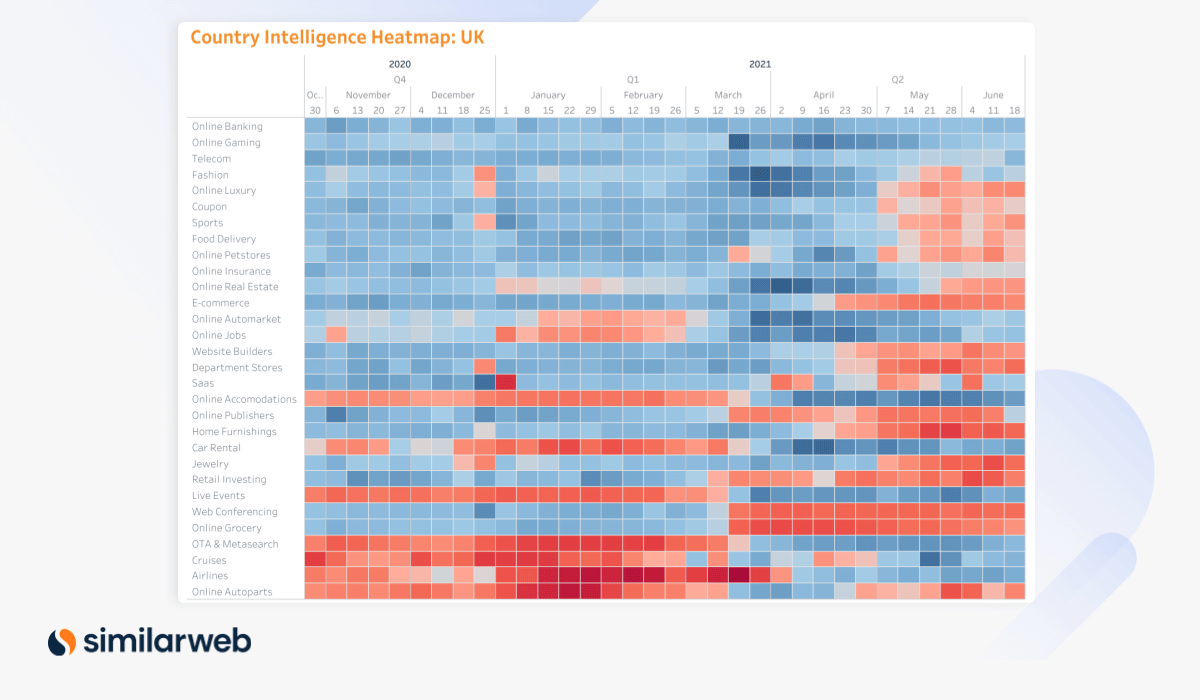 A blue box represents above average growth in visits to sites (or a group of sites)
A red box represents above average decline
U.K. micro view: Is the U.K. real estate market stagnating again?
With the stamp duty holiday in the U.K. coming to an end at the end of June, the industry average YoY traffic growth to online real estate sites has dropped to 9%. This is a stark contrast to the growth levels the industry saw at the end of March/beginning of April, reaching levels of over 200% YoY.
Only one website, zoopla.co.uk, in the set we measured actually saw negative growth, while others just saw growth drop significantly.
Weekly Website Visits YoY Heatmap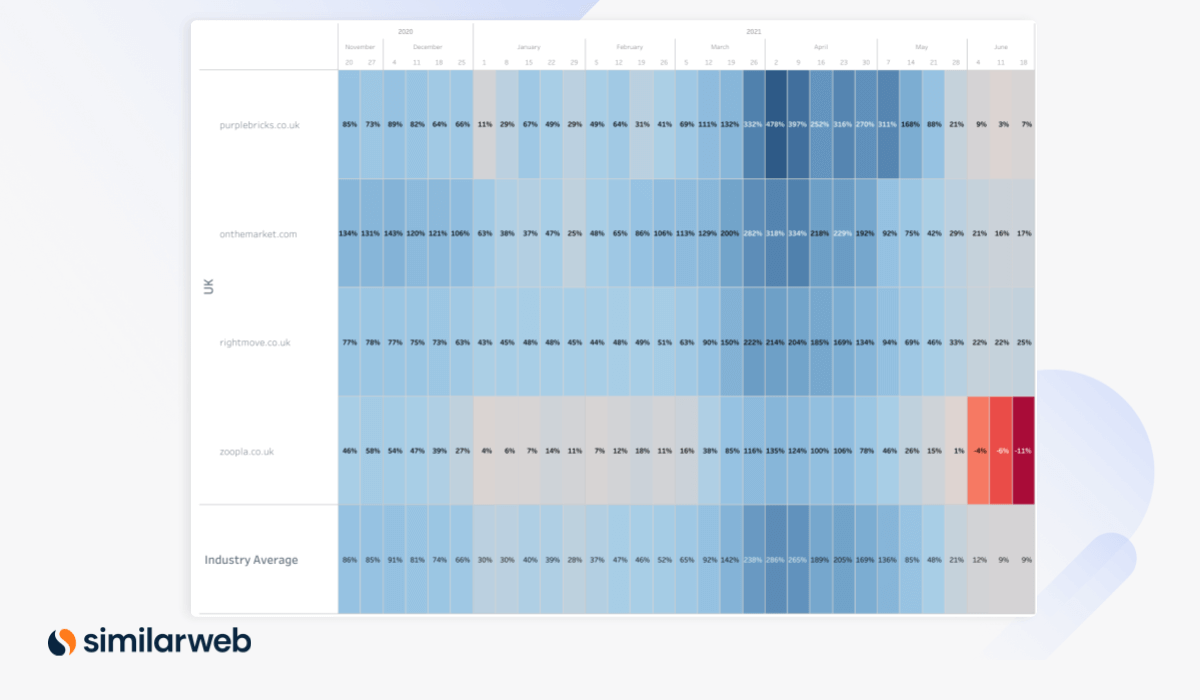
U.K. micro view: Travel slows in the U.K. too
As we saw in the U.S., while YoY traffic growth to OTA & metasearch sites remains strong, the rate of growth has slowed significantly from peak levels earlier this year. The industry average traffic growth to sites in the U.K. dropped to 59% YoY in the week ending June 18, compared to highs of over 100% until as recently as the end of May.
That said, travelodge.co.uk has managed to maintain growth levels at over 300% YoY. In addition, booking.com, hotels.com, and expedia.co.uk are all still seeing YoY traffic growth at over 100% in the U.K.
Driving the slowdown are sites such as onthebeach.co.uk, travelrepublic.co.uk, and loveholidays.com that are all showing significant negative growth.
Weekly Website Visits YoY Heatmap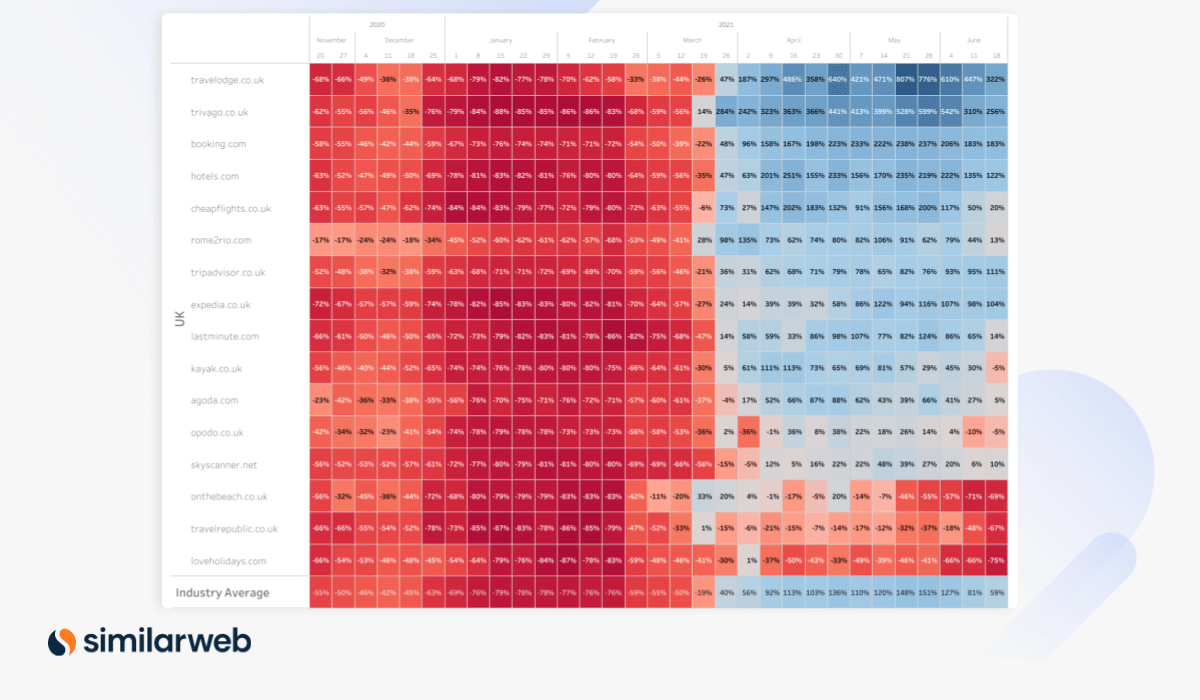

This report contains a select subset of our digital market monitor offerings.
We can also provide sector and industry data for the following countries: U.S., Australia, Brazil, Canada, France, Germany, India, Indonesia, Israel, Japan, Malaysia, New Zealand, and Singapore.
Want to access more industry and company data? Book a demo now.
Appendix: How to read the maps
Cross-Industry Heatmaps
These heatmaps display normalized indices based on statistical factor modeling. These indices summarize the relative performance of either a sector or an industry over time. Blue cells represent an above-average growth rate and red cells represent a below-average decline.
Industry Analysis Heatmap
These heatmaps represent the YoY growth rates of websites within an industry over time. Blue cells represent a high YoY growth rate, and red cells represent a YoY reduction.
Related Posts


Invest using the most insightful digital alt data
Leverage data used by 5,000+ companies to improve your strategy