SaaS Stock Deep Dive: Is the SaaS Top Line Under Threat?

The world is a drastically different place than before the start of the pandemic. Some of the biggest stock winners have been SaaS stocks, which surged in popularity during 2020. But what does 2021 hold for software-as-a-service companies? And how sustainable is SaaS growth on a sector-by-sector basis?
In this article, we use Similarweb’s digital alternative data to take a deep dive into how a changing client concentration might alter the SaaS top-line model and we uncover a few surprising trends.
How we analyzed the data
We aggregated and analyzed website engagement data on over 25 major multi-vertical SaaS platforms, including Zoom, Workday, and Zendesk, to create a SaaS index. Here we use engagement on account domains as a proxy for net revenue retention, which refers to the net expansion of the existing client base minus churn.
We also measured expansion by looking at the total number of unique users per domain, and churn by looking at the number of existing active domains which remain active after 12 months.
*Our SaaS product covers close to 40 companies. We provide custom subdomain data and supplemental EasyPacks. We absorb the data in its semi-structured form, clean it, categorize it and produce a real-world insights package. You can find out more about our SaaS offering here.
Peaking net domain retention
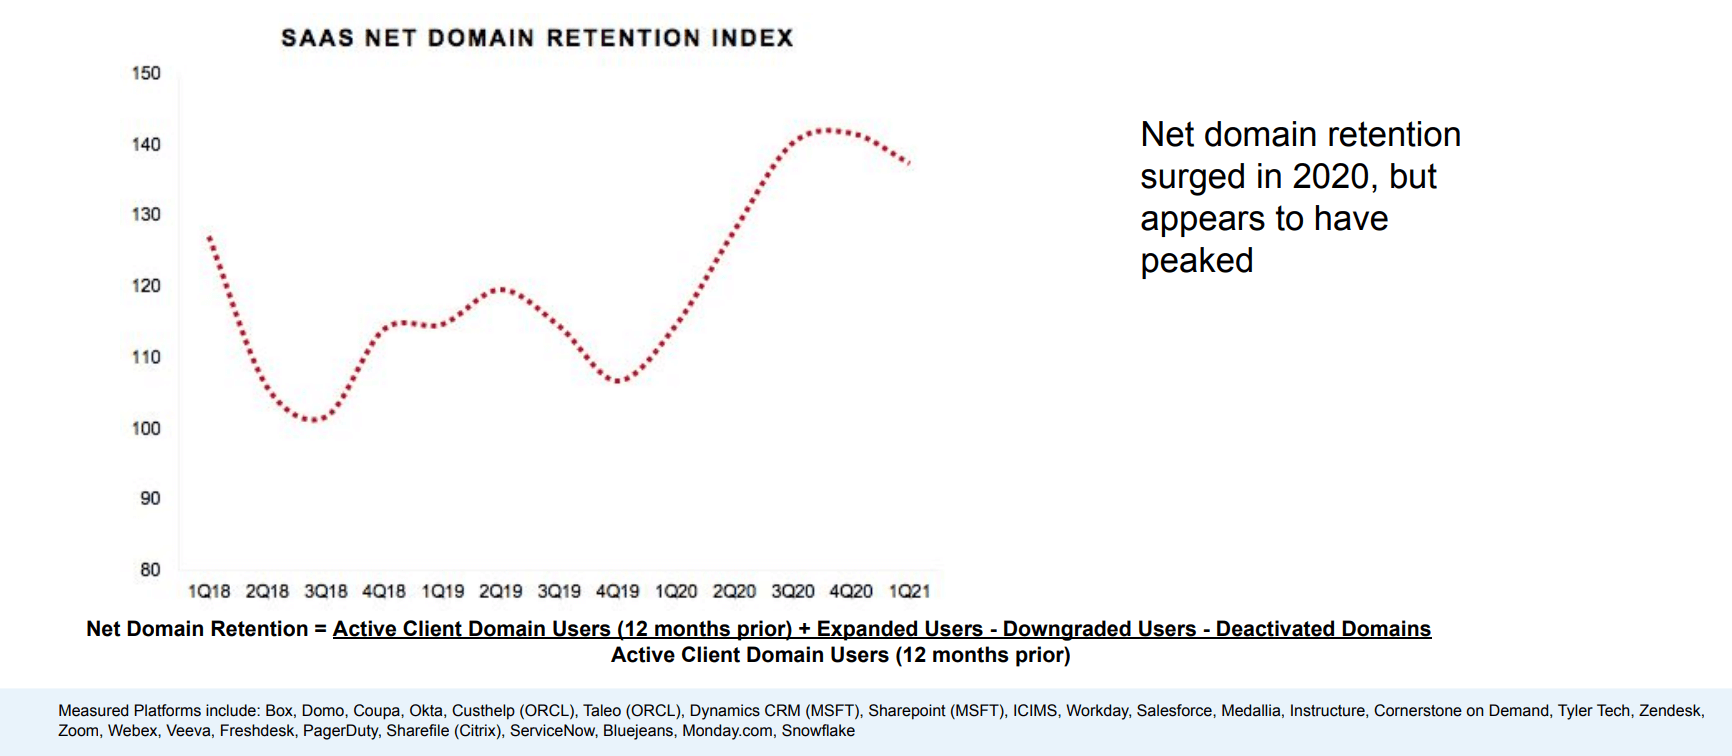
So, what does our data indicate? The net domain retention surged in 2020 (with robust growth for both clients and bookings). The pandemic accelerated the number of clients converting to cloud platforms, while also boosting adoption and usage within organizations that were already clients pre-pandemic. However, as the chart reveals, this trend appears to have peaked.
Shifting SaaS client base
While our SaaS dataset mostly contains public companies, we can also track account level of engagement across both private and public enterprises. This provides invaluable insight into how the total addressable market is shifting. And knowing this provides a better window into the top line of any SaaS company including industry leaders.
Education explosion
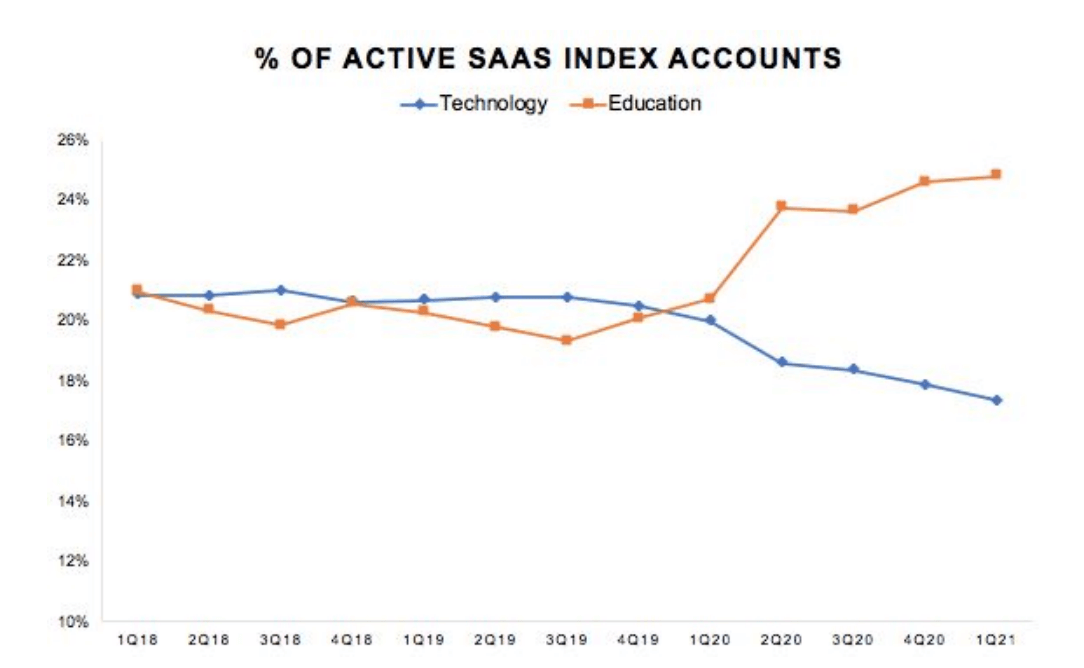
Before the pandemic, technology and education were the two largest sector concentrations across the SaaS industry. Meaning that, on the whole, technology and education were the biggest clients for SaaS companies. They were growing fairly uniformly with the rest of the market. However, these two sectors are now taking quite a different turn.
Most notably, education has seen the biggest increase in concentration among SaaS platforms. This can be seen (as the graph below indicates) in relation to the number of accounts, and even more starkly when it comes to visitor growth or the number of visitors.
Unsurprisingly, one influential factor drove much of this growth. The urgent need for online classes after the pandemic forced schools and universities to move online. However, the key question now is: How much of that client base is going to melt away over the next year as the vaccine does its job and schools return to fully on-site activity?
Education clients were already very large users of SaaS platforms pre-pandemic, especially in relation to learning management and collaboration tools. As a result, there is reason to believe that some of the technology that’s been embedded into the classroom during the pandemic may not ramp down at the same rate it ramped up.
On the flip side, tech companies, which have been early adopters of most SaaS platforms and are a big driver of historical growth, are now a smaller piece of the overall puzzle. Let’s take a closer look:
Improving retention
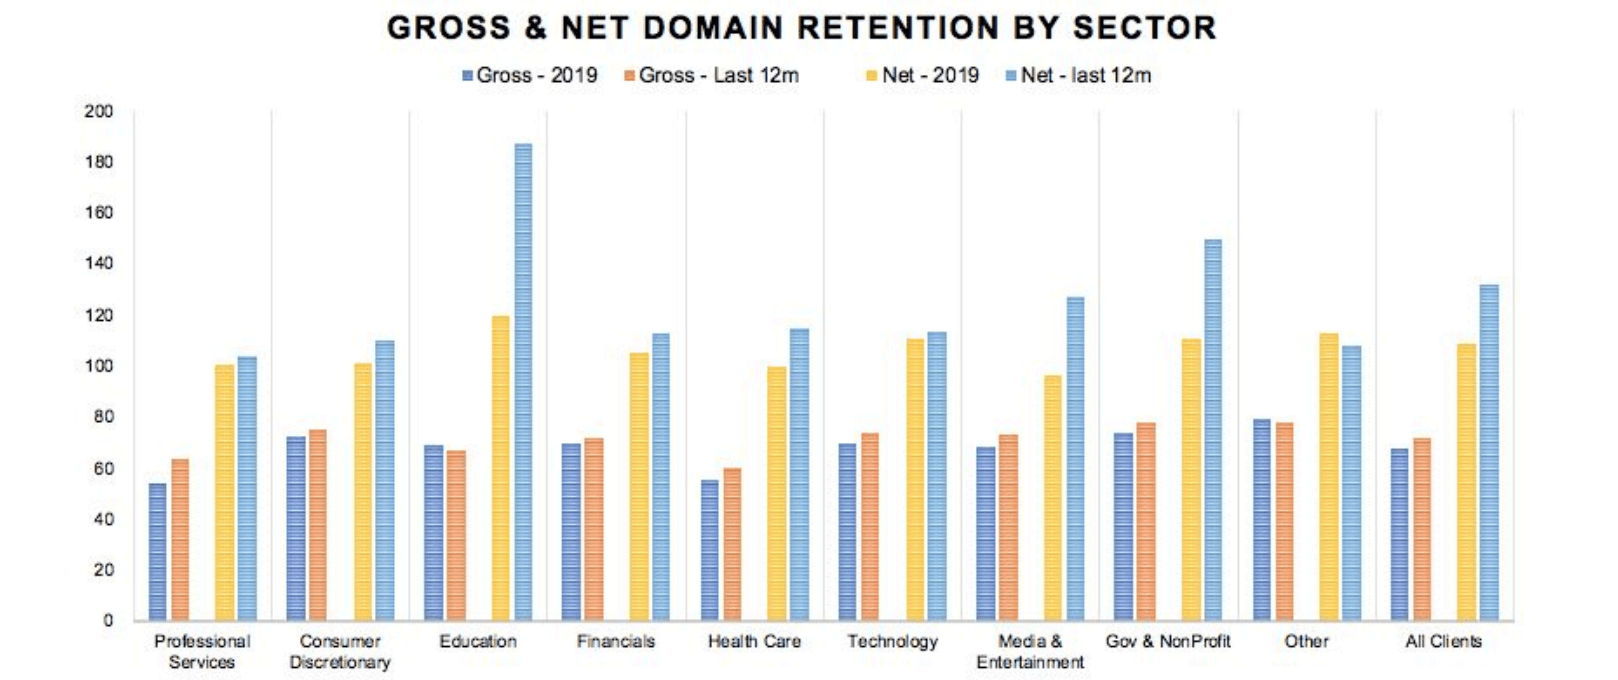
In the pre-pandemic world, education was at the high end of the different sectors in terms of net retention and in the middle in terms of gross retention. This is surprising. You would expect gross retention to be at the high end given the stickiness of the customer base, and net retention to be at the lower end, considering these are universities or school systems with mostly static budgets.
Fast forward to the last 12 months, and net retention surged across the board. But, education’s retention improved considerably more than the benchmark, reflecting the urgency for education providers to move the curriculum online.
Higher vs. lower education
To accurately analyze the education sector, we need to split higher and lower education. And it’s with lower education, specifically K-12 (kindergarten to grade 12) that the data suggests there could be a sustainability issue, particularly in the web conferencing space.
In fact, when we dig further, we see that K-12 schools have a very tough customer history. SaaS companies typically sell to an entire school district, so it’s a potentially massive contract that should become pretty sticky once integrated. However, according to our data, historically that hasn’t been the case. Pre-pandemic, we see that both gross and net retention of K-12 schools is well below the benchmark.
At the other end of the spectrum, we have university and higher education. Before COVID struck, higher education was one of the strongest performing clients with regards to both gross and net retention.
Ranking exposure to education
The pre-pandemic model suggests that higher education institutions have a pattern of integrating SaaS platforms into the curriculum with success and sticking with them. So while SaaS engagement surged to accommodate a scattered student body, it seems relatively likely that these technology integrations will be retained post-pandemic.
On the flip side, just by looking at historical client performance, most of the K-12 could start to roll in the coming months. However this is not entirely negative as many of these K-12 schools received discounts or free access to SaaS platforms during the pandemic. As a result, the impact on the top line is unlikely to be as heavy as the potential benefit to the bottom line.
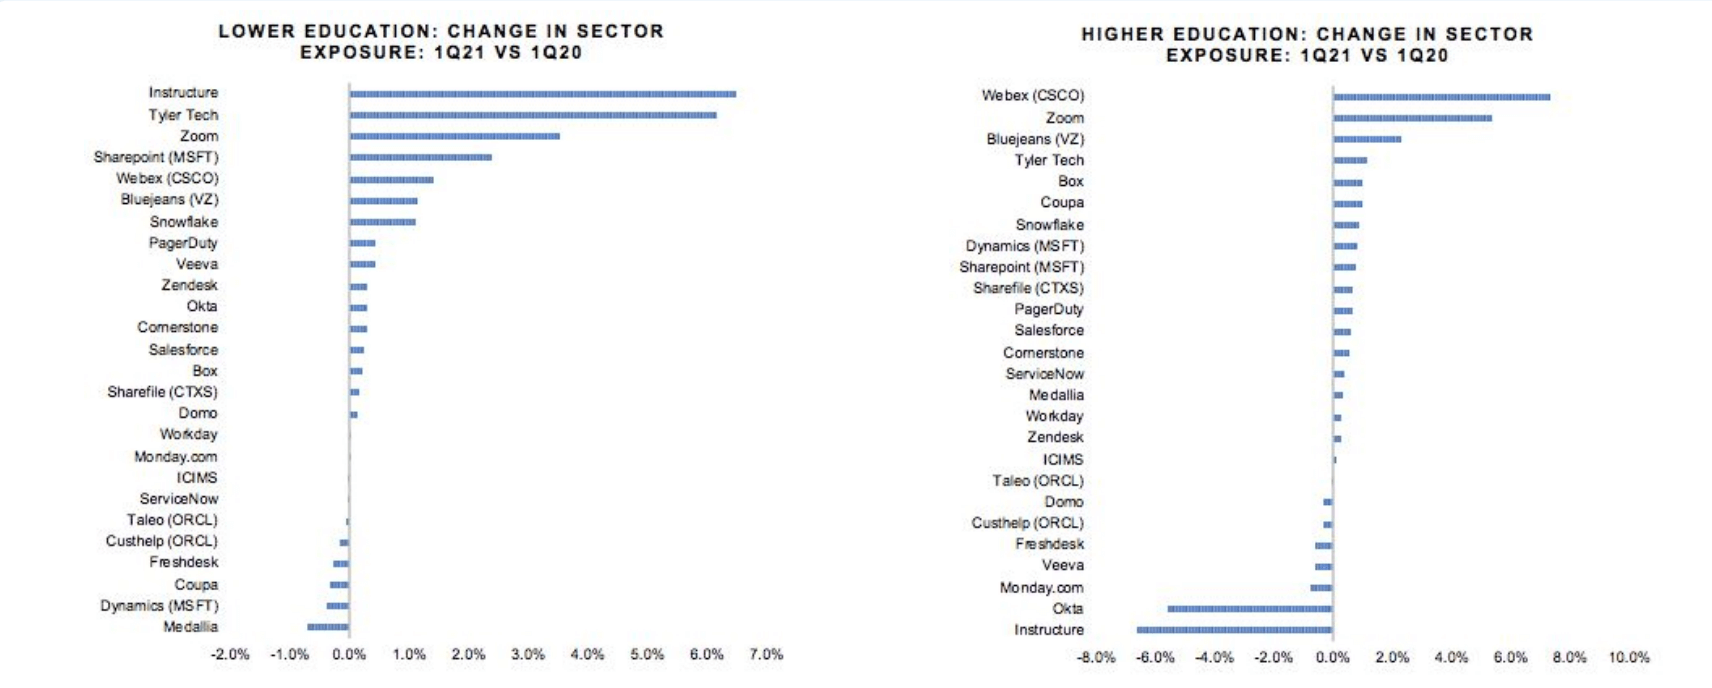
If we rank SaaS stocks’ change in exposure from 1Q20 to 1Q21 to K-12 schools, we can see web conferencing shifted the most during the pandemic. Education tech company Instructure, which is no longer public, added significantly more K-12 schools. And Tyler Technologies, a company that offers public sector software solutions to federal government organizations and school districts, also appears to have pulled in a lot of K-12 contracts.
For higher education, web conferencing also leads the charge, with content sharing tools in the middle-end of the pack. These rankings show how Instructure traded from higher to lower education during the pandemic, while security provider Okta significantly diversified away from education with substantial growth in other sectors.
So if your thesis was that all of the education growth will reverse post-pandemic, you could look at the bottom of this chart for who is the least exposed to that drawdown…
Ranking tech and healthcare
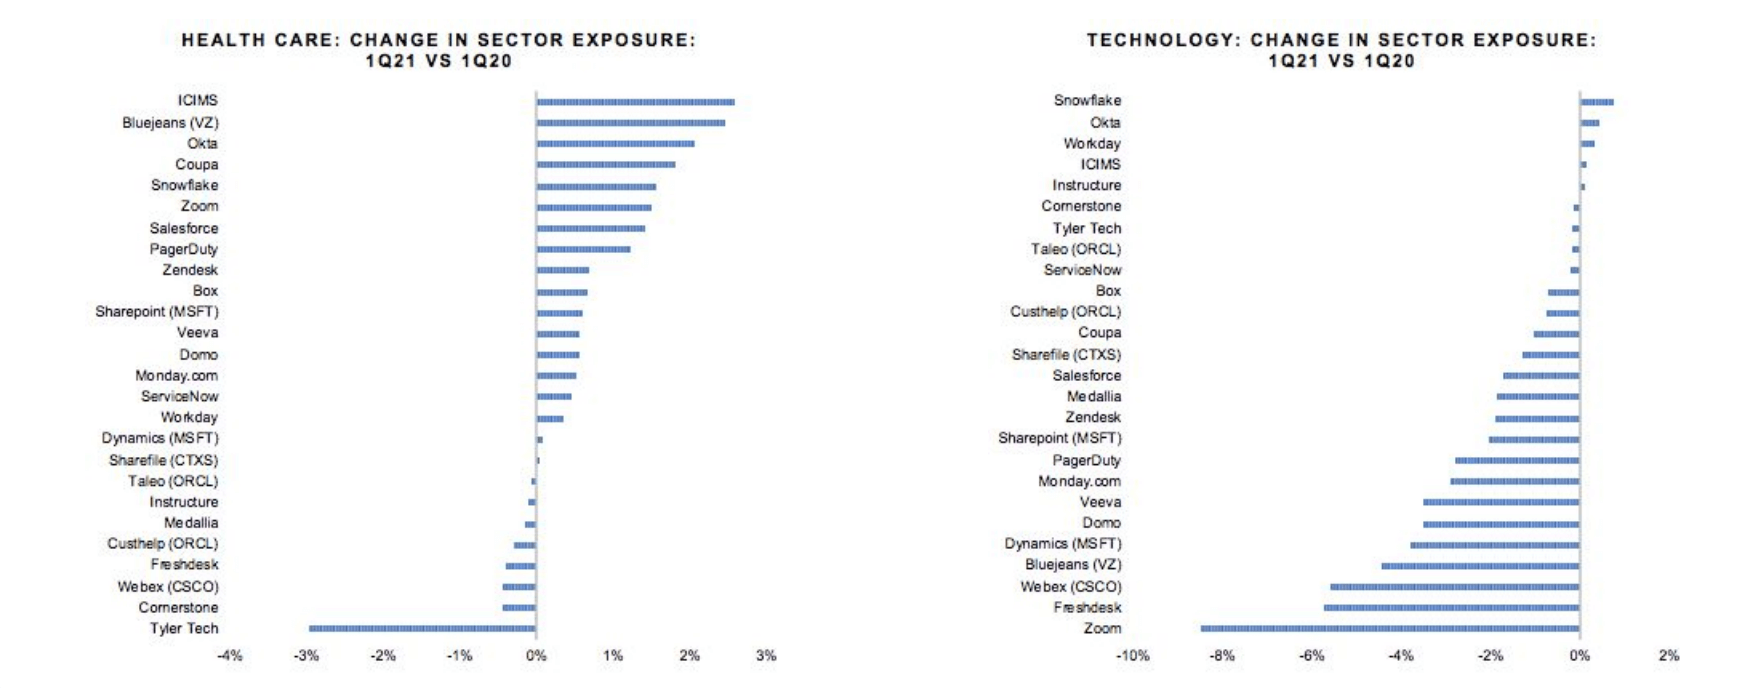
Let’s now consider the two other sectors that drove meaningful changes in client concentration, technology and healthcare. Our data shows that technology declined in the mix while healthcare increased. However, clients in the healthcare sector are actually at higher churn risk, whereas technology is more stable.
During the pandemic, many companies picked up a robust amount of healthcare exposure, including Okta, and as a result, are now significantly less exposed to the tech sector. This includes the web conferencing industry.
Track Okta’s key digital data points here
Ranking high retention sectors
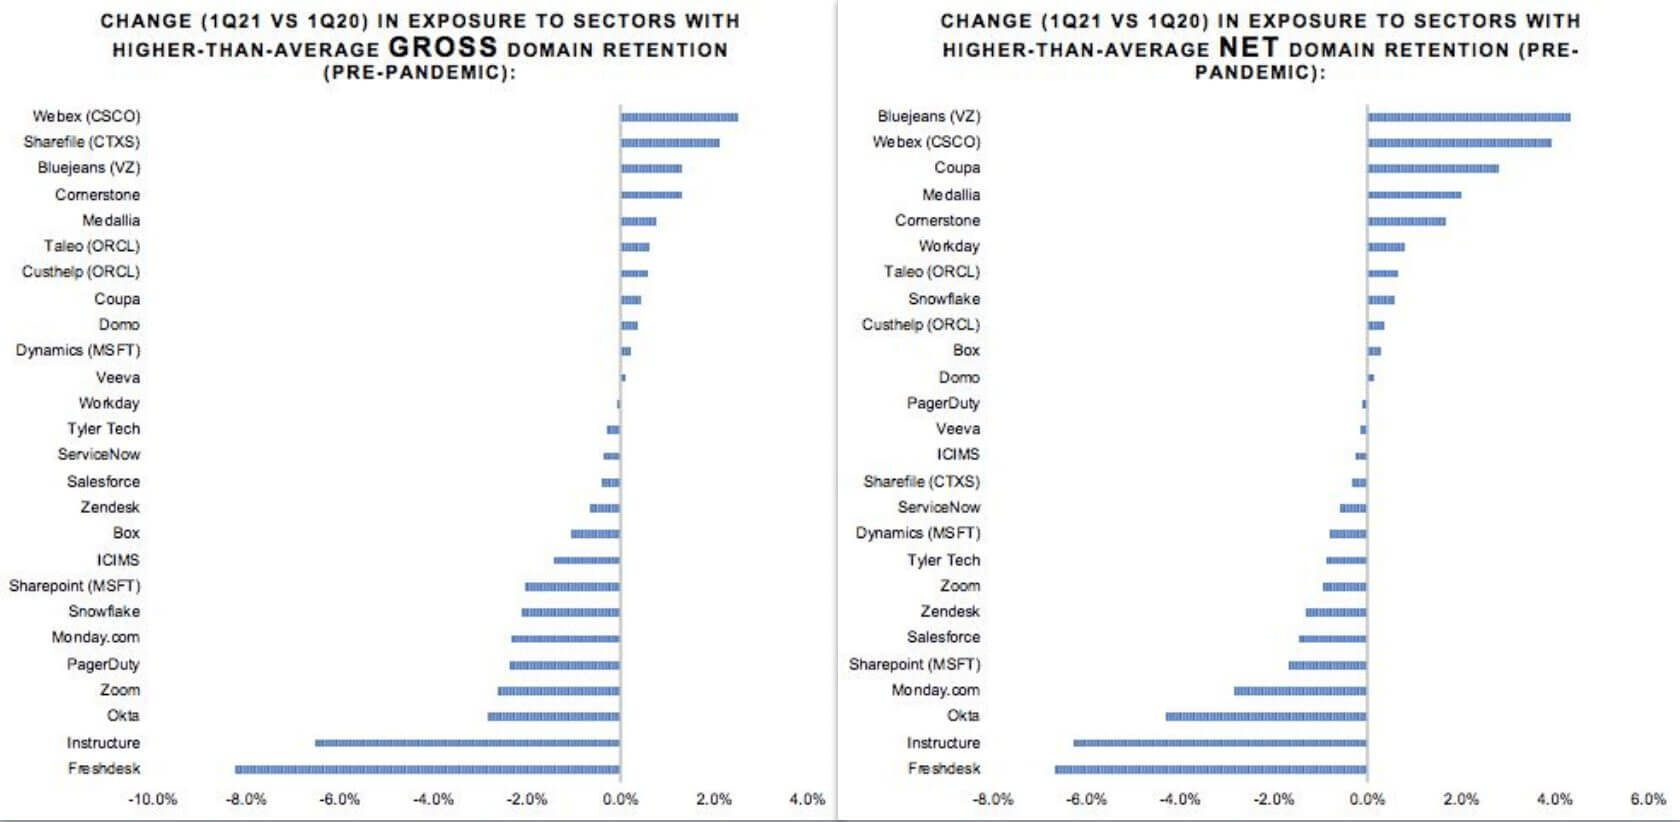
Putting it all together, we created a ranking of the change in exposure year-over-year (YoY) to sectors that, prior to the pandemic, were at the higher end of the scale on gross and net retention.
Judging only on sector statistics pre-pandemic, we can now ask the crucial questions: Did the client base get healthier by those standards? Or did it become more volatile? And what does this mean for annual recurring revenue (ARR)?
Of course, the caveat here is that higher education is part of the group of sectors that had higher than average gross and net retention, so that is one of the reasons web conferencing names fall at the high-end of the scale.
For companies, size matters
Until now we have focused on sectors, due to the headline education shift, but company size, as measured by the number of employees, is also a key factor in gross and net retention.
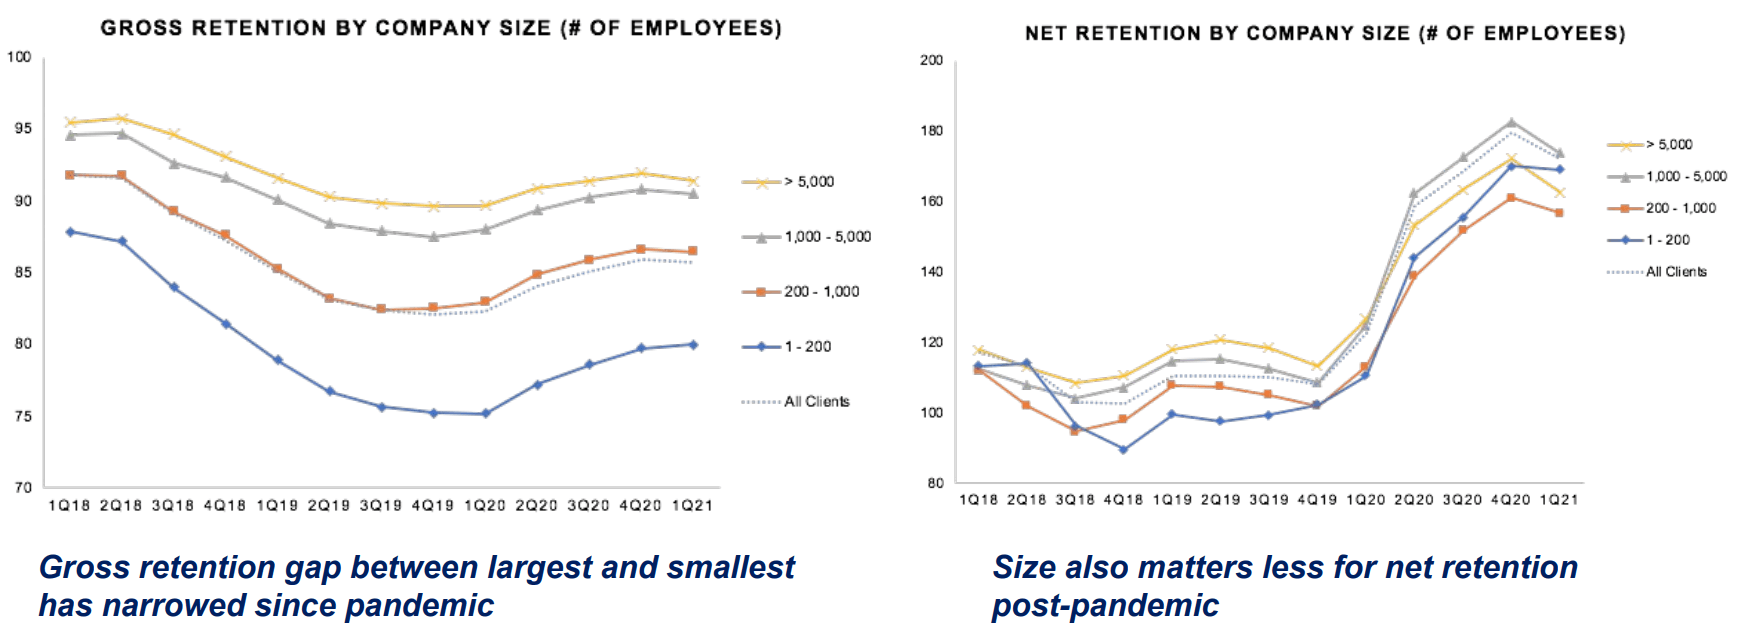
As you would expect, gross retention statistics tend to improve as you move from small and medium-sized businesses (SMBs) to enterprise level.
Notably, the gross retention gap between the largest and smallest companies was wider just before the pandemic in 4Q19. However, for a number of reasons, including government support, that gap has considerably narrowed during the pandemic
Meanwhile, on the net retention chart, you can see a similar stack ranking pre-pandemic where size mattered, and then in pandemic, it became completely jumbled, where mid-range clients between 1-5K outperformed, and more recently, SMB is a close second.
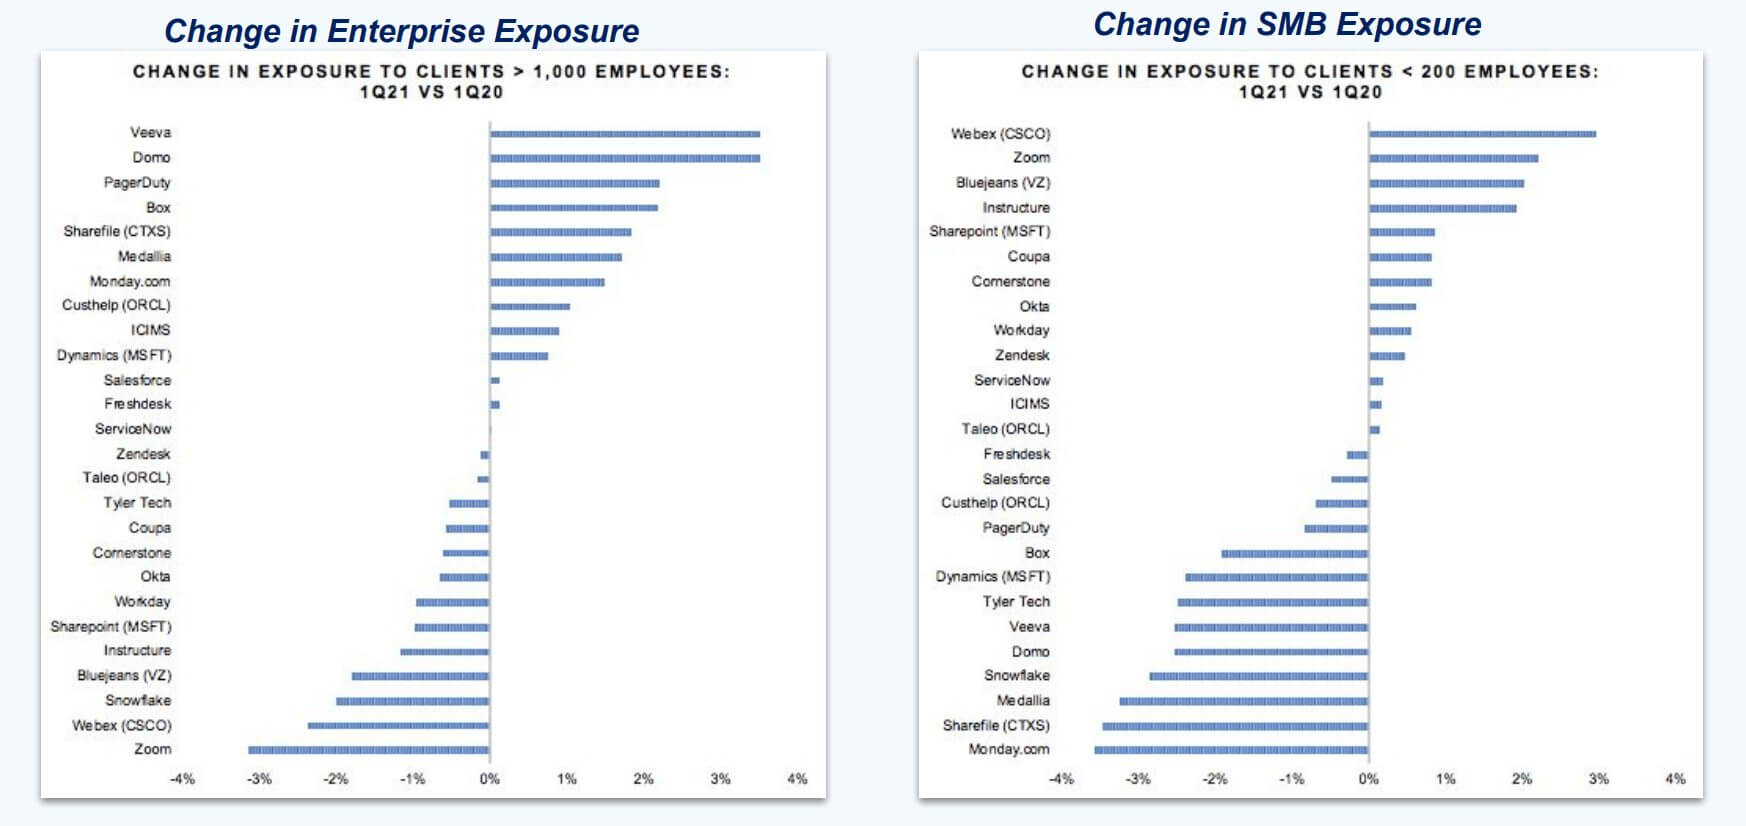
In the chart below, we rank companies by size exposure. As you can see, the performance gaps between SMB and enterprise have blurred, especially with regards to net retention, but clearly, since the height of the lockdowns a higher enterprise mix is still the most favorable scenario.
Note that content sharing systems like Box and collaboration tools monday.com boast a strong number of large clients. Again, going forward, it will be interesting to see whether this is a permanent development.
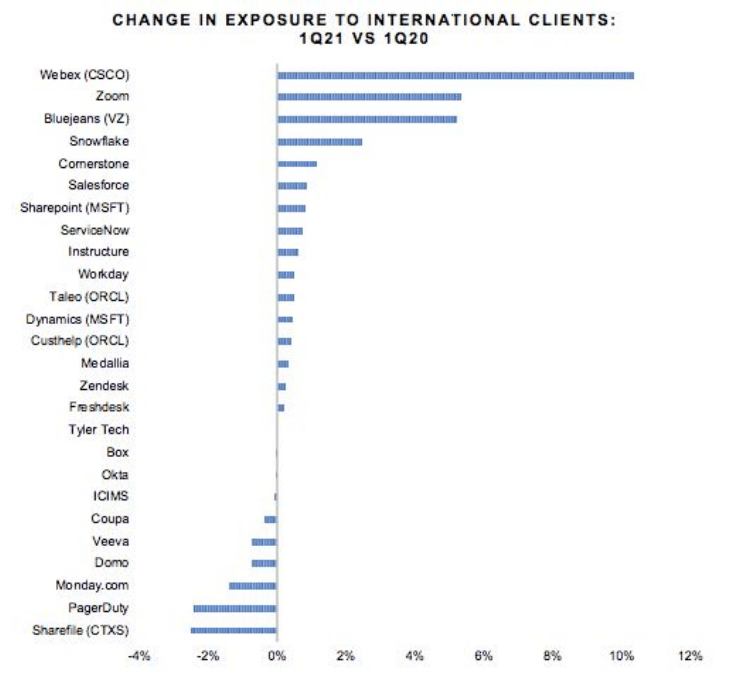
Breaking through geographic boundaries
We tend to think of SaaS platform adoption as mainly concentrated in North America and Western Europe. However, since the pandemic, we have seen very successful international adoption, including in Asia and South America.
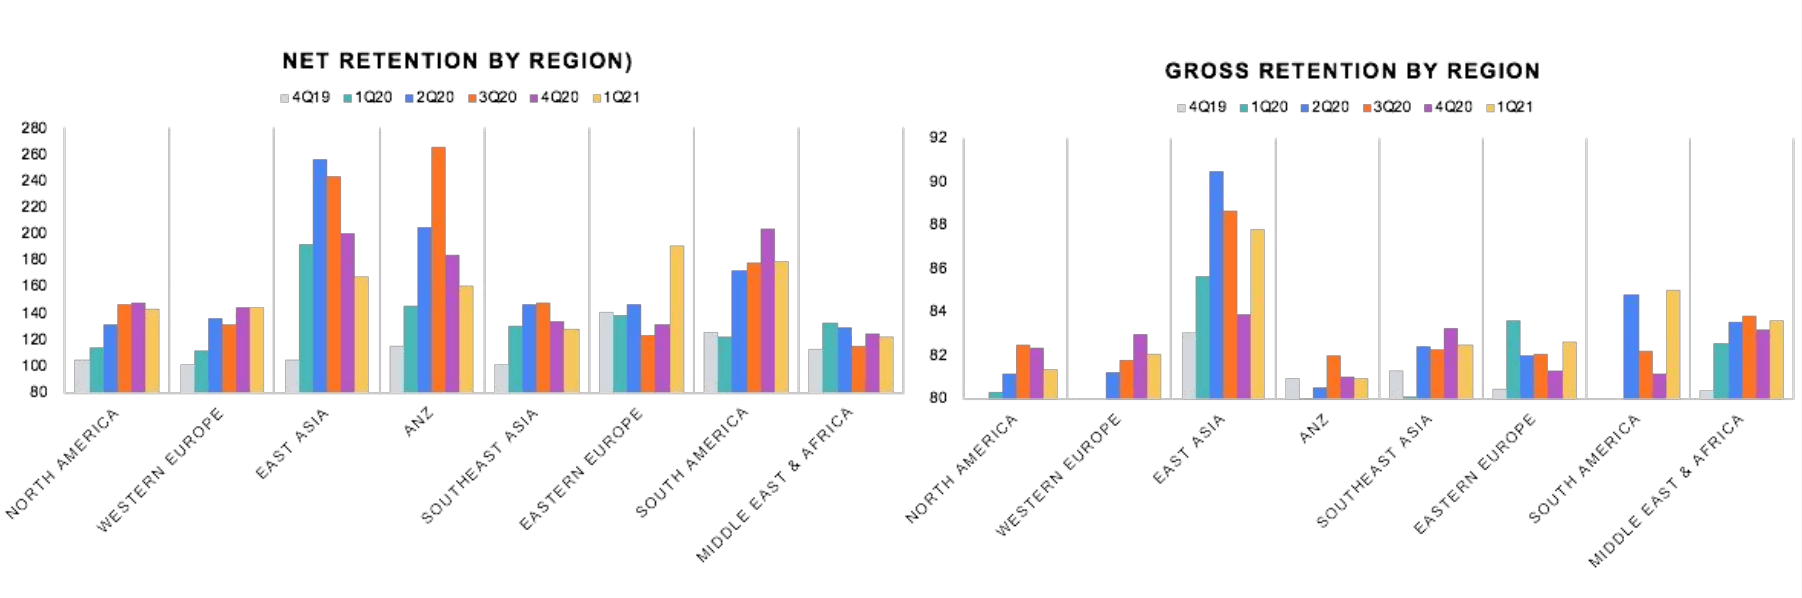
And the path of least resistance has been in web conferencing, which is leading the pack. See below how WebEx is taking the #1 spot vs. Zoom as it has some infrastructure and bundling advantages. Will WebEx manage to retain this lead going forward? Watch this space.
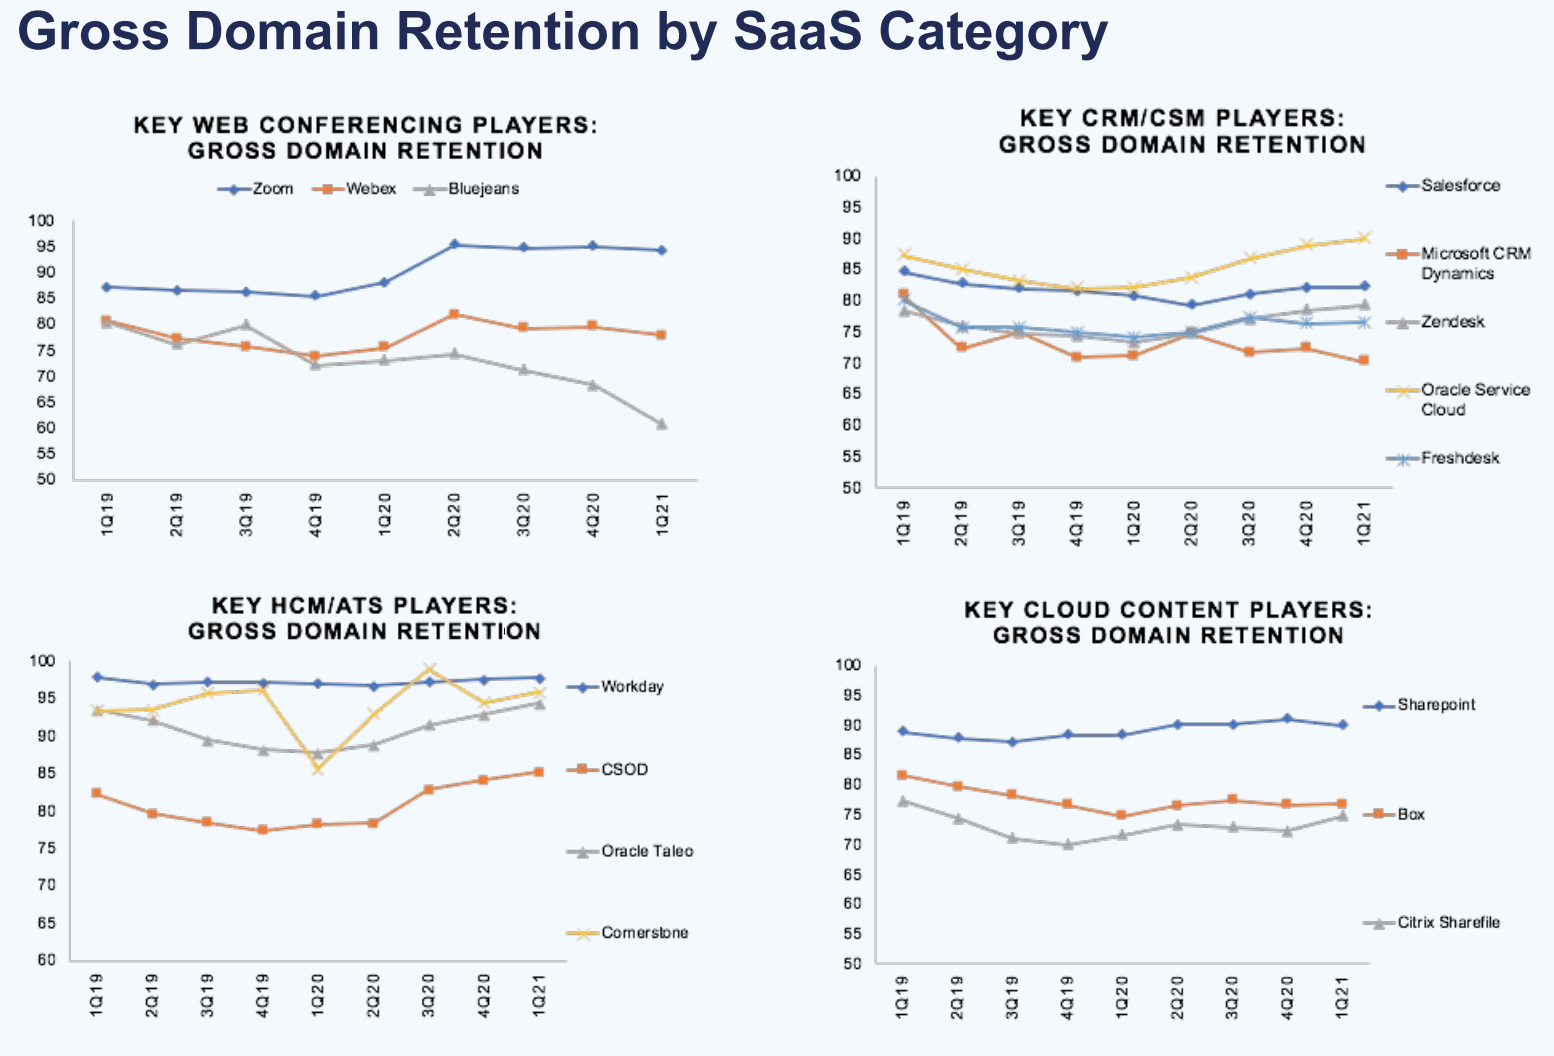
Gross domain retention by SaaS category
Finally let’s look at some of the key players relative to their respective categories, so that performance can be put into context. These categories are fairly broad, but there are nonetheless pretty clear winners. What’s most interesting is that those leadership positions appear to have been cemented by the pandemic.
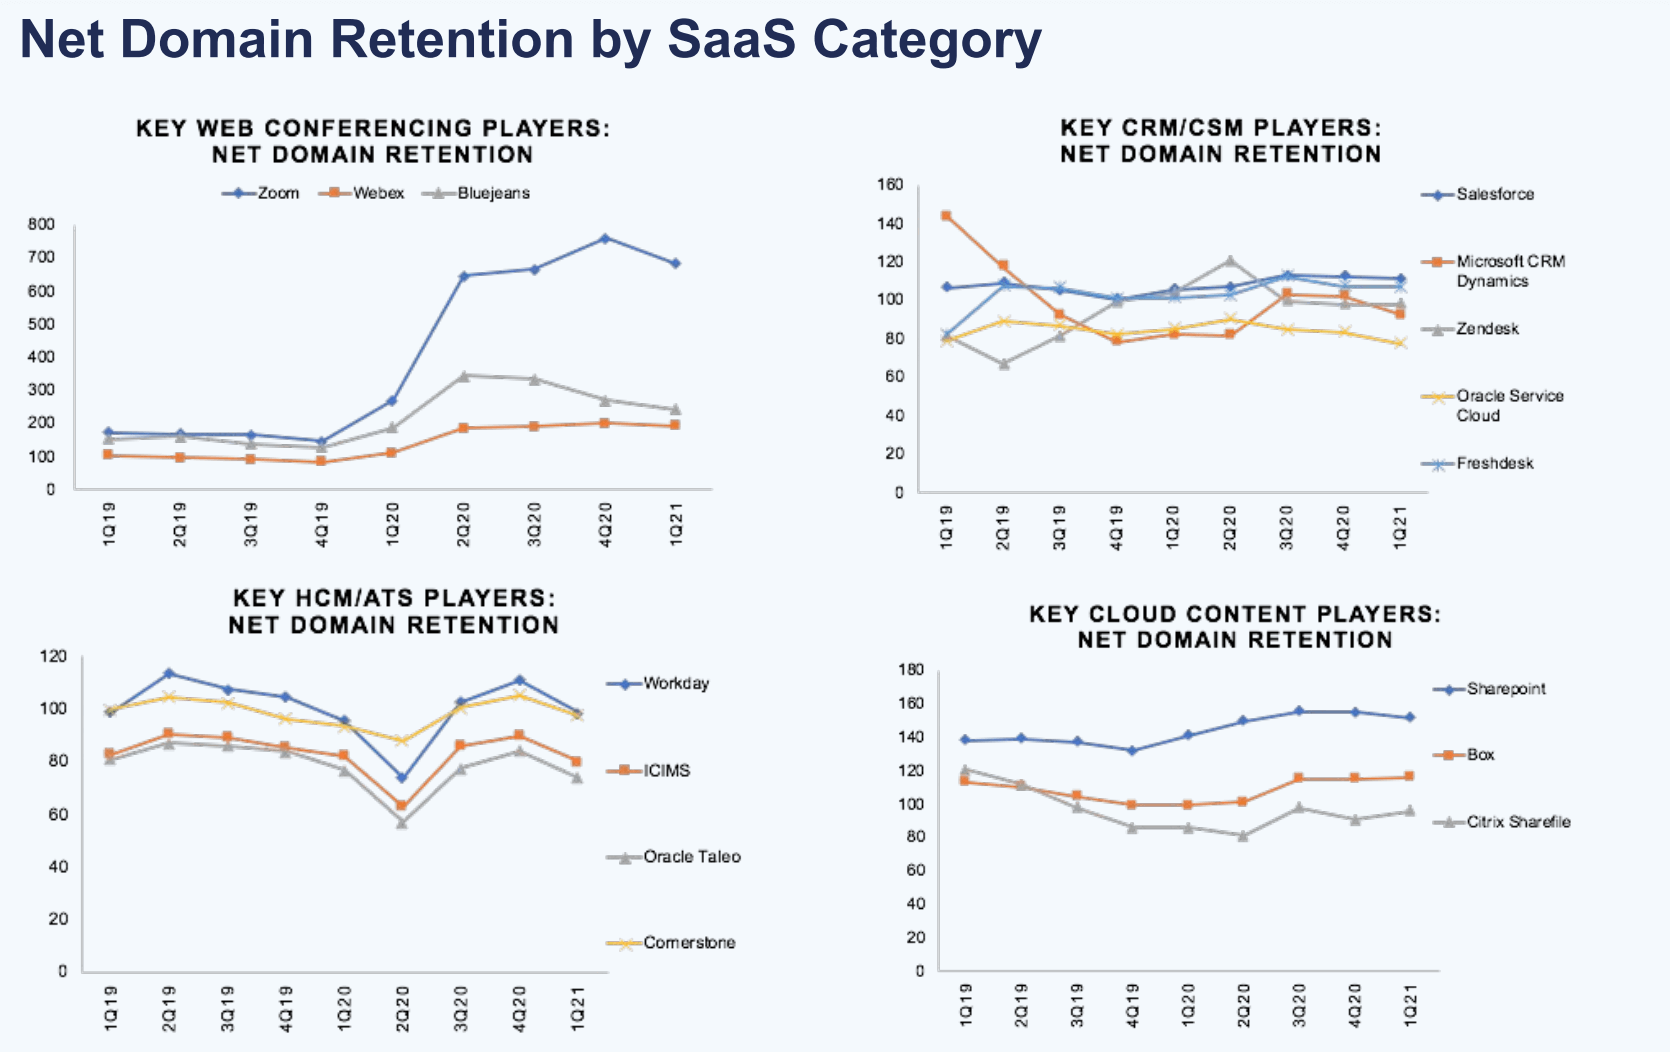
Net domain retention by SaaS category
If we consider the relative players on a net retention basis rather than a gross retention basis, those performance gaps widen in some categories and shrink and almost flip in others. So for web conferencing and cloud content, the gaps between the leaders remained relatively clear and wide.
However, for CRM tools and service management, where Salesforce leads, as well as human capital management, where Workday is on top, there’s a notably tighter range.
SaaS Stocks: Key takeaways
- Net domain retention appears to have peaked in Q4.
- Education sector concentration has surged, across the board.
- Despite sustainability concerns, higher education makes for strong SaaS clients whereas K-12 schools are high churn risk.
- The benefits of a larger company size have faded recently, but this is unlikely to last.
- International SaaS adoption is surging, and the pandemic land grab sets up web conferencing for success.
This is just a taste of what we have to offer. Find out more about our trusted digital data SaaS stock insights in a live demo.


Related Posts


Invest using the most insightful digital alt data
Leverage data used by 5,000+ companies to improve your strategy