


Alternative Data Meaning: How Investors Use Non-Traditional Signals To Generate Alpha

TL;DR: Alternative data is non-financial intelligence gathered from sources like web traffic, credit card transactions, geolocation, and social sentiment. Institutional investors use it to surface early performance signals, validate management claims, and generate alpha before quarterly earnings are released.
You’re analyzing a SaaS company ahead of earnings. The CFO says customer growth is “strong.” The 10-Q shows revenue up 12% year over year. But you need conviction, not just management’s narrative.
So you pull the company’s subdomain data. New enterprise client subdomains are up 34% quarter-over-quarter. Unique visits to the pricing page spiked 41% in the last 30 days. Paid search spend on competitor keywords doubled. The data tells you what the earnings call won’t: this company is accelerating, and the Street doesn’t know it yet.
That’s the alternative data meaning in practice: non-financial signals that let you see around corners.
This article defines alternative data, breaks down the four core data types used by institutional investors, and shows how to integrate them into public- and private-market workflows. You’ll see working examples with real companies, a step-by-step implementation framework, and the data quality checks that separate signal from noise.
What is alternative data?
In the context of institutional investing, alternative data refers to any non-financial data set gathered from outside traditional sources like SEC filings, earnings calls, and analyst reports. It includes credit card transactions, web traffic, geolocation signals, social sentiment, and satellite imagery, among others.
The term “alternative” is relative. What counts as alternative today may become standard tomorrow. But the defining characteristic remains: these data sets provide real-time or near-real-time visibility into company performance before it surfaces in quarterly financial statements.
According to EY’s Global Hedge Fund and Investor Survey, 78% of funds now use or expect to use alternative data, up from 52% in 2016. The shift reflects a structural change: in markets where information asymmetry drives alpha, the investors who see performance signals first win.
The four core alternative data types
Alternative data isn’t a single category. It’s a taxonomy of signal types, each with distinct collection methods, latency profiles, and use cases. The four most widely adopted data types by institutional investors are transactional data, web and app traffic (including AI traffic) data, social sentiment data, and geolocation data.
| Data type | Update frequency | Best for | Key limitation |
| Transactional | 7-14 day lag | Revenue estimation, same-store sales | Misses cash, B2B, subscriptions |
| Web/app traffic | Daily (2-3 day lag) | Digital demand signals, conversion trends | Requires panel modeling for accuracy |
| Social sentiment | Real-time | Brand health, crisis detection | Noisy; bots and astroturfing distort signals |
| Geolocation | Daily | Foot traffic, store performance | Privacy regulated, opt-in only |
1. Transactional data
Transactional data captures consumer purchases at the point of sale: credit card swipes, debit transactions, and email receipts. Aggregated and anonymized, this data allows investors to estimate sales velocity, average transaction value, and customer retention for any company that processes card payments.
Providers like Facteus, FableData, and Measurable AI aggregate transaction data from bank partnerships, receipt-scraping apps, and merchant acquirers. The data typically arrives with a 7 to 14-day lag, making it useful for validating quarterly revenue trends or detecting mid-quarter inflection points.
Use case: A hedge fund tracking a retail chain can compare same-store sales growth across geographies, identify which product categories are accelerating, and estimate total revenue, all from aggregated card transaction data, weeks before the earnings release.
Limitation: Transaction data doesn’t capture cash purchases, B2B sales, or subscription renewals. It’s a proxy, not a census.
2. Web and app traffic data
Web and app traffic data measures digital engagement: visits, unique visitors, page views, session duration, conversion events. For any company with a digital footprint, this data provides a real-time view of consumer interest, brand strength, and sales funnel performance.
Similarweb aggregates traffic data from a global panel of millions of devices, direct measurement integrations, and ISP partnerships. The data updates daily, allowing investors to track companies’ performance at weekly or monthly granularity.
Use case: An investor analyzing a direct-to-consumer mattress company can track total visits, unique visitors, the mix of paid vs. organic traffic, and conversion rates on product pages. If unique visits to the checkout page spike 28% month-over-month while the company’s paid search spend holds flat, that’s an organic demand signal: evidence of brand momentum that won’t show up in a 10-Q for 60 days.
Advantage: Web traffic data is non-invasive, globally scalable, and captures the full customer journey from awareness to conversion. It’s the only alternative data type that works equally well for public, private, and pre-revenue startups.
3. Social sentiment
Social sentiment data aggregates mentions, comments, reviews, and engagement metrics from social media platforms (X, Reddit, Instagram, TikTok), review sites (Trustpilot, G2, Glassdoor), AI engines, and news outlets. Natural language processing models classify sentiment as positive, neutral, or negative and extract themes (product quality, customer service, pricing complaints).
Use case: A long/short equity fund monitoring a consumer electronics company sees a 340% spike in negative sentiment on Reddit and X following a product launch. Sentiment analysis reveals recurring complaints about battery life and overheating. The fund uses this as an early warning signal to reduce exposure before the company issues a recall two weeks later.
Limitation: Sentiment data is noisy. Bots, astroturfing, and coordinated campaigns can distort signals. Effective use requires filtering for verified accounts, weighting by follower count, and cross-referencing with other data sources.
4. Geolocation data
Geolocation data tracks physical movement via GPS signals from mobile devices. Aggregated and anonymized, it measures foot traffic to brick-and-mortar locations: retail stores, restaurants, warehouses, and office buildings. Satellite imagery provides a complementary signal by capturing parking lot occupancy, construction activity, and inventory levels at distribution centers.
Providers like Placer.ai, Zartico, and BigDataCloud aggregate location data from mobile apps that users have opted in to share.
Compliance note: Geolocation data is subject to strict privacy regulations (GDPR in Europe, CCPA in California). Reputable providers anonymize and aggregate data to ensure compliance, but investors must verify that data sourcing meets regulatory standards before use.
How public market investors use alternative data
Public market investors (hedge funds, long-only asset managers, quantitative funds) use alternative data to answer a single question: Is this company performing better or worse than the market expects?
The workflow breaks into three use cases: nowcasting quarterly performance, validating management guidance, and detecting inflection points.
Nowcasting quarterly performance
Nowcasting is the practice of estimating current-quarter financial results before they’re reported. Alternative data makes this possible by providing real-time proxies for revenue, customer growth, and operating leverage.
Example (illustrative): A hedge fund covers a publicly traded SaaS company with a $4 billion market cap. The company reports quarterly earnings in 30 days. The fund pulls subdomain data from Similarweb, showing total active customer subdomains grew 8.2% quarter-over-quarter, vs. 6.1% in the prior quarter. Web traffic data show that unique visits to the company’s pricing page increased by 19% quarter-over-quarter.
The fund combines these signals into a nowcast model. Subdomain growth suggests customer acquisition is accelerating. Pricing page traffic and stable conversion rates suggest strong demand. Sales hiring suggests management expects sustained growth.
The fund’s nowcast: revenue will beat consensus by 3-5%. The company reports revenue 4.1% above consensus. The stock rallies 12% post-earnings.
Validating management guidance
Management teams have an incentive to manage expectations. Alternative data allows investors to verify whether management’s narrative matches operational reality.
Example (illustrative): A consumer goods company’s CFO says on the Q2 earnings call that “brand momentum remains strong” and reiterates full-year guidance. But web traffic data shows that unique visits to the company’s e-commerce site declined 6% quarter-over-quarter, and paid search spend increased 22% while traffic held flat: a sign of rising customer acquisition costs and weakening organic demand.
The investor uses this data to challenge the guidance. Three weeks later, the company pre-announces a revenue miss and cuts full-year guidance by 8%. The investor, who had reduced exposure based on the traffic data, avoids the drawdown.
Detecting inflection points
Inflection points, moments when a company’s growth trajectory changes direction, are the highest-value signals in public markets. Alternative data surfaces these inflections before they appear in earnings forecasts.
Example (illustrative): A quantitative fund tracks web traffic for 500 e-commerce companies. In March 2026, the fund’s algorithm flags a 41% month-over-month spike in unique visits to an online furniture retailer’s product pages. Social sentiment data shows a viral TikTok campaign. Transaction data shows the average order value increased 12% month-over-month.
The fund initiates a position. Two months later, the company reports Q1 revenue 18% above consensus.
A word of caution: Alternative data can also produce false positives. A spike in web traffic might reflect a PR crisis rather than organic demand. Several hedge funds have over-indexed to social sentiment signals during meme-stock volatility, amplifying losses rather than generating alpha. The signal-to-noise ratio requires rigorous backtesting before integration into live trading models.
To understand how top hedge funds use alternative data while managing these risks, see our companion analysis.
How private market investors use alternative data
Private equity firms, venture capital funds, and investment banks face a different challenge: the companies they analyze don’t report earnings, don’t file with the SEC, and often don’t share detailed financials until late in the diligence process. Alternative data fills the information gap. For more on how firms integrate these signals into deal workflows, see our private equity data analytics case study.
Due diligence: validating the investment thesis
Example (illustrative): A private equity firm is evaluating a $300 million acquisition of a B2B SaaS company. Management claims the company has 1,200 enterprise customers and a 15% annual churn rate. The firm pulls subdomain data from Similarweb. The data shows 1,089 active subdomains in the current quarter, down from 1,143 in the prior quarter: a 4.7% quarterly decline. Annualized, that’s an 18% churn rate, not 15%.
The firm uses this data to renegotiate the purchase price downward by $22 million.
Sourcing: identifying investment opportunities
Example (illustrative): A venture firm tracks web traffic for 2,000 private SaaS companies. In January 2026, the firm’s algorithm flags a payroll software startup with 340% year-over-year growth in unique visits and a 2.8% conversion rate on its pricing page. The firm leads a $40 million Series B at a $200 million pre-money valuation.
Eighteen months later, a strategic acquirer buys the company for $1.1 billion.
Portfolio company growth: optimizing performance
Private equity firms don’t just buy companies; they operate them. Alternative data helps portfolio company management teams optimize marketing spend, identify underperforming geographies, and benchmark against competitors.
Data quality and compliance: the due diligence investors must perform on their data
Alternative data is only valuable if it’s accurate, representative, and legally compliant. Investors who skip data quality checks risk building models on flawed inputs, or worse, violating securities regulations.
The three data quality checks every investor must run:
1. Sample size and coverage
A data set is only as good as its sample. Web traffic data derived from a panel of 10,000 devices will produce noisy estimates for small websites. Ask the data provider: What is the sample size? What percentage of total activity does the sample represent? How is the sample weighted to reflect the broader population?
Similarweb’s panel includes hundreds of millions of devices globally, combined with direct measurement integrations and ISP partnerships, providing statistically representative coverage across geographies, device types, and user demographics.
2. Latency and update frequency.
Alternative data loses value as it ages. Transaction data with a 30-day lag is useless for nowcasting. Ask the provider: How often is the data updated? What is the lag between the event and when it appears in the data feed?
Similarweb web traffic data updates daily with a 2 to 3 day lag for most metrics, giving investors weekly and even intra-week visibility into performance shifts.
3. Methodology transparency.
Opaque methodologies are a red flag. If a provider can’t explain how data is collected, aggregated, and normalized, the data is unverifiable. Request a methodology document. Verify that the provider discloses data sources, sample construction, weighting schemes, and any adjustments made to raw data.
Similarweb publishes a detailed methodology whitepaper covering its multi-source data collection, panel calibration, and statistical modeling approach, available to clients and prospects on request.
Compliance: navigating the regulatory landscape
Alternative data sits at the intersection of securities law, privacy law, and data protection regulations. Investors must ensure compliance with:
Regulation Fair Disclosure (Reg FD): U.S. securities law prohibits companies from selectively disclosing material non-public information. Alternative data is permissible under Reg FD because it is derived from publicly observable activity rather than insider tips.
Material Non-Public Information (MNPI) rules: Investors cannot trade on information obtained through illegal means. Reputable alternative data providers contractually warrant that their data is legally sourced.
Privacy regulations (GDPR, CCPA): Geolocation, transaction, and social sentiment data often contain personal information. Providers must anonymize and aggregate data. Investors should verify that providers have data processing agreements in place and conduct regular compliance audits.
The AID framework: a step-by-step workflow for integrating alternative data
Integrating alternative data into an investment process isn’t a one-time project. It’s a workflow that requires alignment across research, data engineering, and portfolio management teams. The AID framework (Acquire, Integrate, Decide) provides a structured approach.
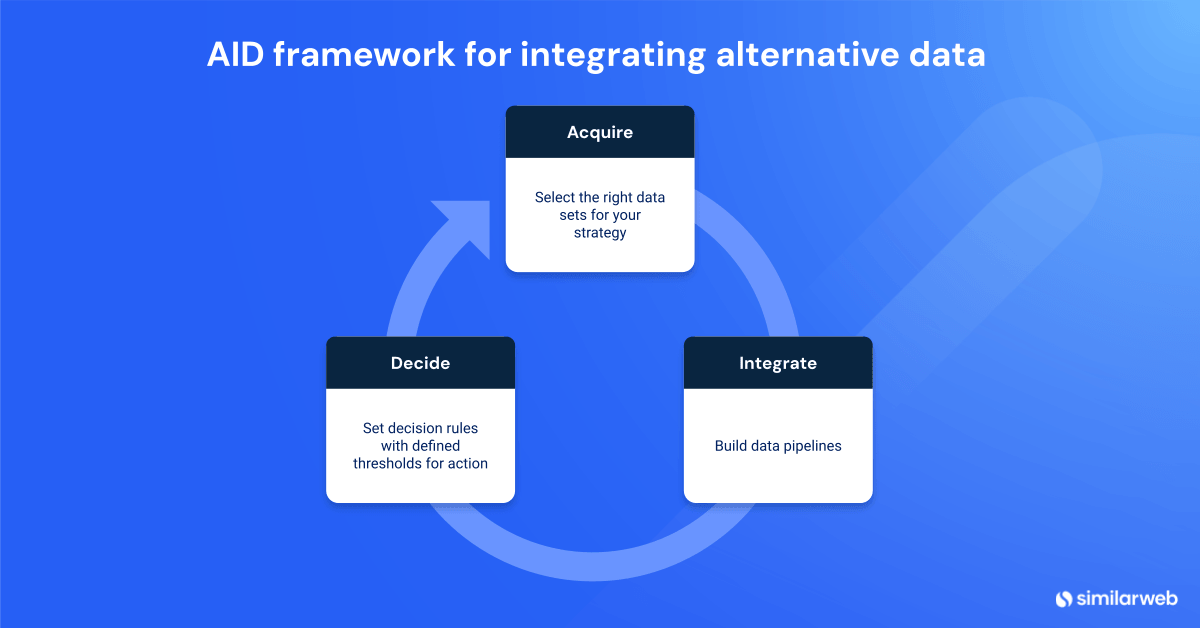
Step 1: Acquire
Select the right data sets for your strategy. Define your investment thesis: what question are you trying to answer? Map the thesis to data types. Evaluate 3 to 5 providers per data type. Request sample data sets, run backtests, and compare coverage, latency, and cost. Negotiate data licensing agreements.
Step 2: Integrate
Build data pipelines using ETL tools to ingest alternative data feeds into your data warehouse. Normalize raw metrics into comparable metrics (year-over-year growth rates, market share percentages, z-scores). Integrate with fundamental models, combining alternative data signals with traditional financial data. Backtest signals before using them in live trading.
Step 3: Decide
Use data to inform investment decisions, not automate them. Set decision rules with defined action thresholds. Monitor signals in real time using dashboards. Validate with traditional research by cross-referencing alternative data signals with earnings transcripts and industry reports. Document decisions in an investment journal that logs which alternative data signals influenced each trade.
Similarweb proprietary data: real-time digital intelligence for institutional investors
Similarweb’s Stock Intelligence provides web and app traffic data for over 100 million websites and 5 million mobile apps globally. The data is derived from a multi-source panel that includes direct measurements (anonymized clickstream data from browser extensions and mobile apps), ISP partnerships, and public web data.
Example data point (pulled April 19, 2026):
For monday.com (ticker: MNDY), a publicly traded workflow SaaS company, ticker mapping reveals: Total visits (March 2026) of 39.3 million, up 7.8% month-over-month, unique visitors 6.0 million (up 6.3% vs. March 2025). Subdomain analysis surfaces named enterprise client workspaces (ibm.monday.com, wbd.monday.com, umg.monday.com, among others), giving investors a window into the company’s enterprise customer base and competitive positioning.
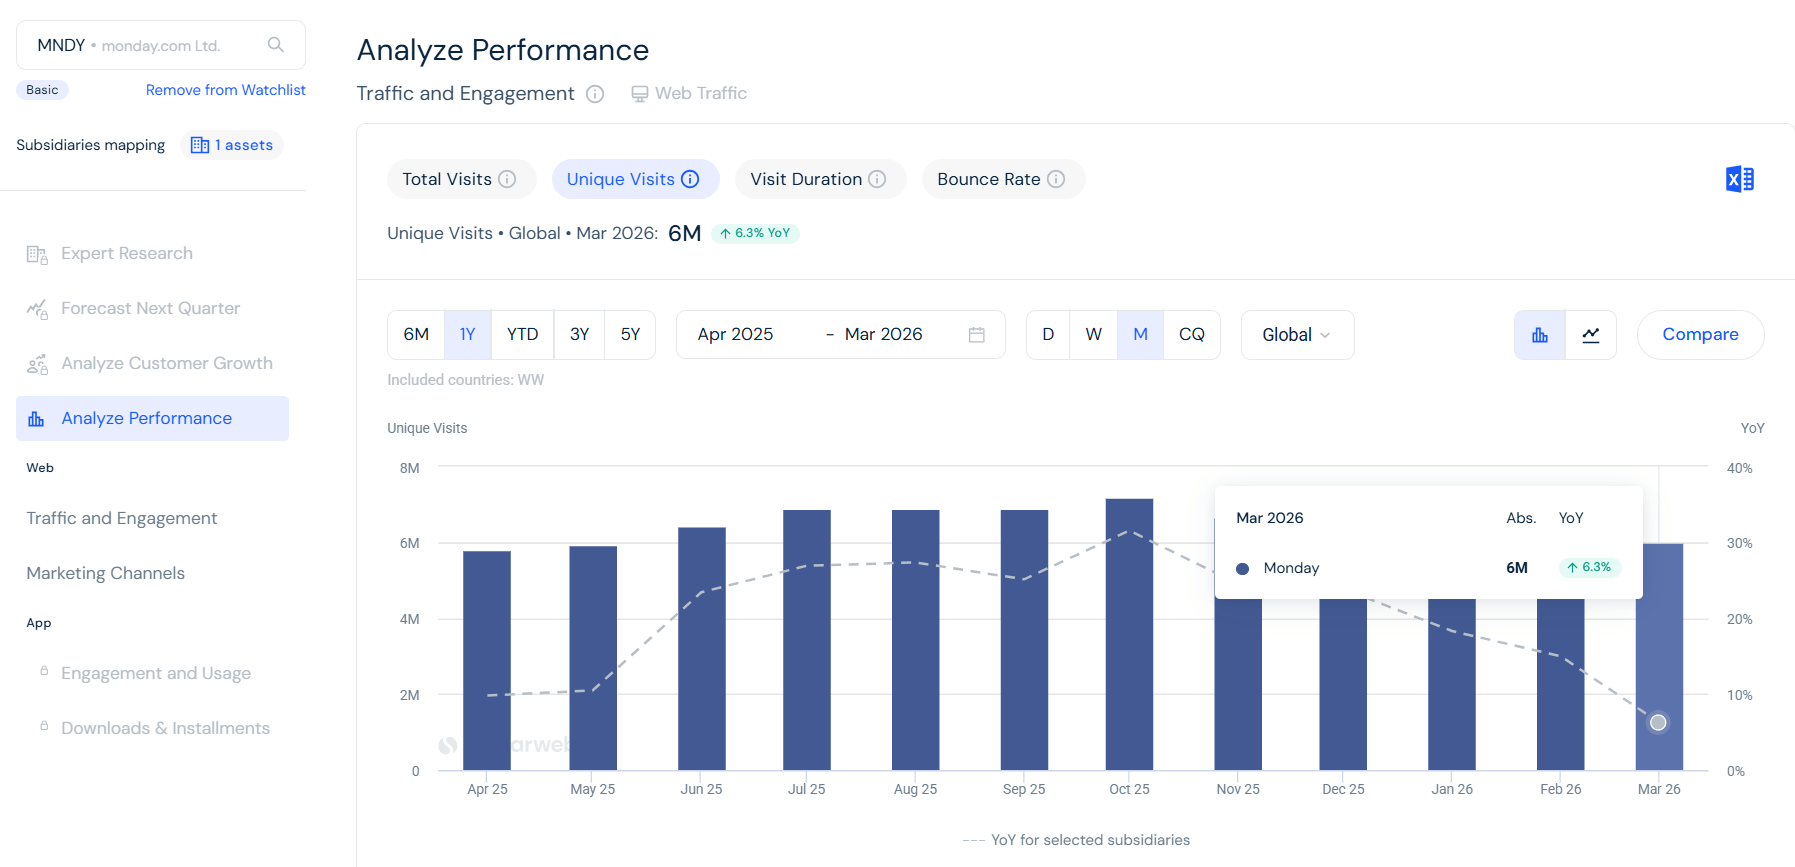
This data, updated daily, allows investors to track any company’s customer growth and web engagement in real time, weeks before the company reports Q1 earnings.
FAQ
What is the meaning of alternative data?
Alternative data is non-financial intelligence gathered from sources outside traditional investor materials, including web traffic, credit card transactions, geolocation signals, and social sentiment. Institutional investors use it to surface early performance signals and validate investment theses before quarterly earnings are released, complementing (not replacing) SEC filings, earnings transcripts, and analyst reports.
What are examples of alternative data sets?
The four most widely adopted alternative data sets are: transactional data from credit card purchases and email receipts, web and app traffic data measuring digital engagement and conversion rates, social sentiment aggregated from platforms like Reddit and X (formerly Twitter), and geolocation data tracking foot traffic to physical locations via GPS-enabled mobile devices.
What is the difference between alternative data and traditional data?
Traditional data comes from standard financial sources: 10-Ks, 10-Qs, earnings calls, and SEC filings. It is backward-looking and reported quarterly. Alternative data is derived from non-financial sources like web traffic, transactions, and geolocation. It updates daily or in near-real time, giving investors visibility into company performance weeks before earnings releases.
How is alternative data collected?
Collection methods vary by data type. Web traffic data is aggregated from browser panels, mobile apps, and ISP partnerships. Transaction data comes from credit card networks and receipt-scanning apps. Geolocation data is sourced from GPS signals in opted-in mobile applications. Social sentiment is collected via public social media APIs and NLP classification models. All reputable providers anonymize and aggregate data to ensure privacy compliance.
Is alternative data legal to use in investment decisions?
Yes, when sourced through legitimate channels. Alternative data is permissible under Regulation Fair Disclosure (Reg FD) because it is derived from publicly observable activity, not insider information. Investors must verify that providers comply with privacy regulations (GDPR, CCPA) and contractually warrant that data is not obtained through illegal means such as hacking or breach of fiduciary duty.
How do hedge funds use alternative data?
Hedge funds use alternative data for three primary workflows: nowcasting quarterly revenue before earnings by combining web traffic, transaction, and hiring signals; validating management guidance by cross-referencing CEO claims against independent traffic and sentiment data; and detecting inflection points where a company’s growth trajectory changes direction before it appears in financial statements.
How much does alternative data cost?
Annual subscriptions for alternative data sets range from under $25,000 for basic sentiment or ESG feeds to over $500,000 for premium transaction or geolocation data, according to Neudata pricing research. The cost of building an in-house alternative data team starts at $1.5 to $2.5 million annually. Many providers now offer tiered pricing, trial periods, and limited-universe packages to reduce barriers to entry for mid-sized firms.
How big is the alternative data market?
The global alternative data market was valued at approximately $5 to $12 billion in 2025, depending on the source, and is projected to grow at a compound annual growth rate of 16% to 50%+ through the early 2030s. Investment and trading firms account for roughly 41% of total market revenue. The rapid expansion reflects a structural shift from experimental use to core integration in institutional investment workflows.
Related Posts


Stock Data Feeds: How They Work and How to Use Them to Generate Alpha


Invest using the most insightful asset research
Leverage data used by 5,000+ companies to improve your strategy