Subscription Business Metrics that Define Performance

Consensus, forecasting, and analysis, oh my! Welcome to earnings season, when publicly traded companies must share financial statements quarterly to allow the investing public and equity analysts to evaluate the company’s performance and future prospects.
But what if you didn’t have to rely so heavily on these quarterly announcements? Tracking a company during the non-reported period is much easier now with alternative data. Online traffic and engagement, one type of alternative data, can provide insights into performance and revenue when looking at signups, cancellations, and active users.
How? I thought you’d never ask.
Let’s run through the basics first
What are subscription business metrics?
Subscription business metrics are the KPIs used to track a company’s performance, revenue, and effectiveness of its business model.
- Monthly recurring revenue (MRR) is the predictable monthly revenue received from a company’s subscriber base.
- Annual recurring revenue (ARR) measures recurring revenue embedded over the next 12 months and can predict annual revenue, assess the effectiveness of business models, and forecast future revenue.
- Churn rate measures cancellations and the loss of customers and revenue.
- Net growth rate is the net increase or decrease in recurring revenue from one period to the next.
- Customer acquisition cost (CAC) is the estimated cost of acquiring a new subscriber and provides insight into the effectiveness of marketing and acquisition strategies.
- Average revenue per user (ARPU) is the total revenue divided by the total number of users. It is a good indicator of a healthy customer base and more opportunities for cross-selling and upselling.
- Lifetime value (LTV) is a revenue estimate of the lifetime of a customer from signup to churn and represents how much should be spent on new customer acquisition.
Alternative data + business metrics = performance
Alternative data, specifically traffic and engagement data sets, can act as a proxy for a company’s KPIs, lending insight into signups, churn rates, and active customers, regardless of industry. Streaming, SaaS, and Ecommerce are three industries that house subscription-based companies.
Streaming
The Streaming industry is one great example of using sign-up metrics to track company performance.
Netflix was most recently in the news when it announced with its 1Q24 earnings that it would no longer publicly share subscriber numbers outside of reaching new milestones. However, it is still a key metric for tracking growth during non-reported periods.
When looking at a segment, such as monthly visits tied to a specific website page, such as a thank you for subscribing page, company performance becomes clearer.
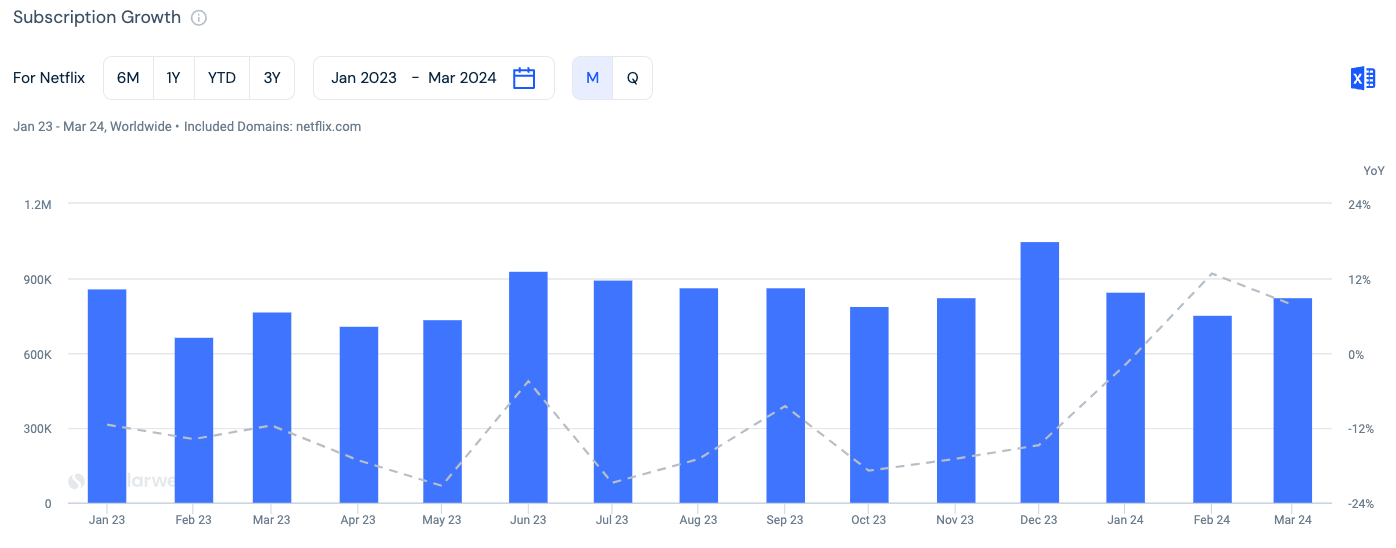
Year-over-year (YoY), 1Q24 was stronger than 1Q23. Although January saw a 1.8% drop in new subscribers from the previous year, February was up 12.8%, and March was up 7.7%, which aligns with the company’s reported growth.
Cancellations are equally as good a measure of company performance, especially for Netflix, since you can only cancel by logging into the website.
Cancellations definitely decreased when comparing 1Q23 and 1Q24, down by 45K internationally and 54K in the US and Canada.
Seeing global cancellations provides insight into Netflix’s churn rate.
As the pandemic wound down and consumers were no longer confined to their homes, Netflix implemented changes to its subscription plans with the introduction of an ads-based tier and a crackdown on password-sharing. The churn rate has fluctuated since then, but in 1Q24, it steadied at 1.1% monthly.
SaaS
The SaaS space is another industry where subscription business metrics are key indicators of performance.
Monday.com, a collaborative workplace platform for project, product, and sales process management, relies on growing and maintaining its subscription base. Tracking user acquisition and retention during the non-reported periods is how to monitor performance.

Jan. 2024 saw a 7.6% YoY rise in subscriptions over Jan. 2023. March 2024 saw a 2% YoY increase. Feb. 2024, however, saw a 3.5% decrease YoY from Feb. 2023.
Monday’s YoY subscription growth paints the company’s performance as positive. Exploring active users helps determine the impact of the subscription growth on its product offerings and the business model.
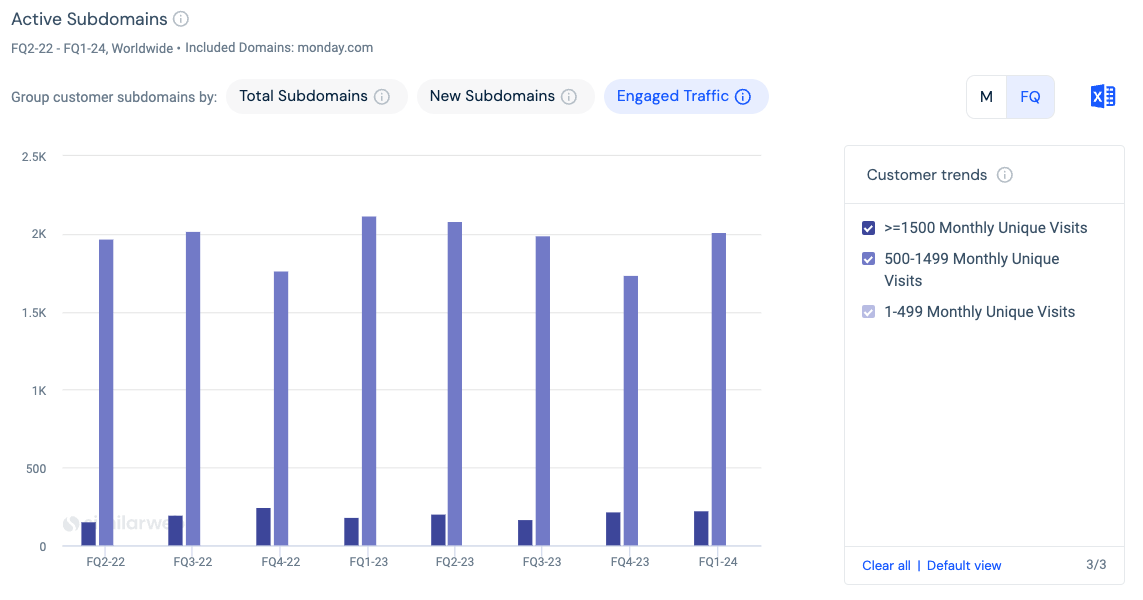
Looking at monthly unique visitors (MUVs) to active enterprise client subdomains shows how engaged paid users are with Monday’s platform. In 1Q24, 227 active client subdomains received more than 1500 MUVs, 2K active client subdomains had between 500-1499 MUVs, and seven active client subdomains saw between 1-499 MUVs. Total enterprise active client subdomains in 1Q24 stood at 2.2K.
Ecommerce
Ecommerce is a more interesting sector when it comes to subscription business metrics, as subscriptions aren’t the only contributing factor to performance and revenue. Amazon is a great example of that. You don’t need a Prime subscription to access all that Amazon offers, but the perks may be considered worth it.
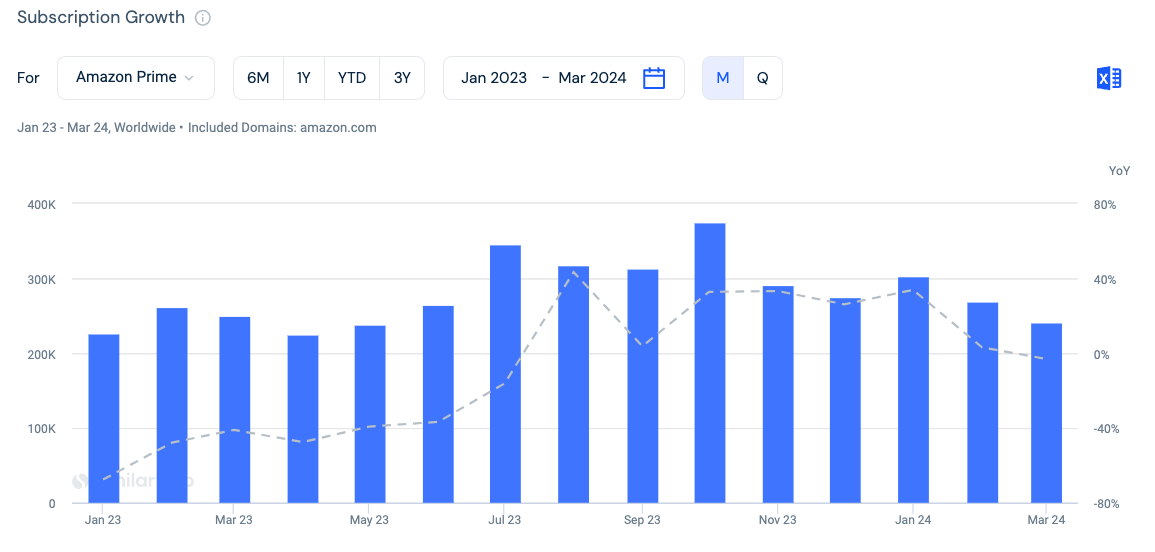
January 2024 saw a significant increase in new subscriptions over the previous year, with 33.9% growth. February 2024 saw +3.2% YoY, but March 2024 saw a 3.1% YoY decline in signups. January 2023 saw a significant YoY decline in subscriptions of 67.6%, but many external mitigating factors may have played a role, such as inflation and the cost of living crisis.
But how big a factor does this have on the company’s overall performance? In 1Q24, Amazon tripled its profit and beat expectations due to AWS revenue and Advertising revenue.
Tracking subscription business metrics with Similarweb
Similarweb’s alternative data provides unique insight into company performance using various online traffic and engagement metrics that act as proxies to companies’ KPIs.
Similarweb Stock Intelligence takes any company’s digital data to evaluate traffic to a company’s sign-up page and to its thank you for subscribing page to craft curated insights and research about a company’s performance.
With Similarweb Stock Intelligence, investors get access to global and regional sector intelligence and premium datasets like technographics, subdomains and folders, and conversion analysis data alongside digital traffic and engagement data. This allows them to curate insights and analyses derived from this alternative data source to support and enhance investment strategies.
FAQs
What are subscription business metrics?
Subscription business metrics are the KPIs used to track a company’s performance, revenue, and effectiveness of its business model.
Why should investors track subscription business metrics?
Online traffic and engagement, one type of alternative data, can provide insights into performance and revenue when looking at signups, cancellations, and active users.
How can you analyze subscription business metrics with Similarweb?
Similarweb Stock Intelligence takes any company’s digital data to evaluate traffic to a company’s sign-up page and to its thank you for subscribing page to craft curated insights and research about a company’s performance.
Related Posts


Invest using the most insightful asset research
Leverage data used by 5,000+ companies to improve your strategy