How to Analyze Stocks (and Get an Investing Edge)

Big rewards in investing (and life) are rarely risk-free. Luckily, effective stock analysis can help you evaluate – and manage – your investing risk.
As the legendary Warren Buffett told investors during an annual Berkshire Hathaway meeting in May 2021 “There’s a lot more to picking stocks than figuring out what’s going to be a wonderful industry in the future.”
In this article we’ll introduce several valuation metrics you can use for stock analysis, covering the fundamentals, technicals, and beyond. Finally, we’ll break down how you can take your asset research to the next level by using Similarweb’s powerful alternative data to generate actionable investing insights.
Stock analysis: From top to bottom
Most investors use a combination of stock intelligence analysis techniques when deciding how to analyze a stock before buying.
- Top-down analysis is an investing approach that typically starts with analyzing and evaluating global as well as national macroeconomic factors and opportunities, like COVID-19, on industries, sectors, and individual businesses.
- Bottom-up analysis, on the other hand, starts with evaluating a firm’s fundamentals and financial metrics. It then moves up to the industry and economy. With the bottom-up technique, an investor has detailed knowledge about the financial position of a company and the price action of its stock.
For this bottom-up analysis, being able to analyze a company’s performance in comparison with competitors’ data provides a valuable perspective of a stock’s performance since the main aim is to “uncover” a business that will outperform its peers in a sector.

How to analyze a stock before investing
There are a number of factors to consider when doing investment analysis and below we will discuss each of them:
1. Macro factors
Looking at the macro-level like geopolitical factors as well as developments in various regions, such as North America, emerging markets, or Asia-Pacific is an important part of how to perform sector research. When you study asset valuations in the context of an economy’s growth and prospects for its local currency it indicates which global regions might represent the best opportunity for growth.
Interestingly though, private and institutional investors typically allocate a great portion of their equity holdings to stocks in their own countries – an investment approach known as the “home country bias.”Research points out that retail investors do not usually “diversify geographically, concentrating investments in-home or regional assets” – trending D2C brands are a great example of that.
In macroeconomic analysis, investors typically look at a country’s gross domestic product (GDP), interest rates, consumer confidence, employment levels and data from various sectors, such as the housing market or retail figures. In many countries, interest rates are currently at record low levels. The result: Passive income seekers turn to high dividend-paying companies instead.
Utilities stocks such as Exxon or Chevron that pay robust dividends tend to receive plenty of interest. These stocks can generate reliable, ongoing returns every quarter, even if the share price stays flat. Another important factor to consider is Fiscal stimulus, as seen in the past year in the U.S. in the form of stimulus checks sent to households.
Several sectors, such as retailers or financial services websites, benefit from extra money in consumers’ pockets. For instance, Walmart’s CEO Doug McMillon said on the company’s recent post-earnings call: “In the U.S., economic stimulus is clearly having an impact, but we also see encouraging signs that our customers want to get out and shop.”
Want to see which signs? Access our latest Walmart insights here
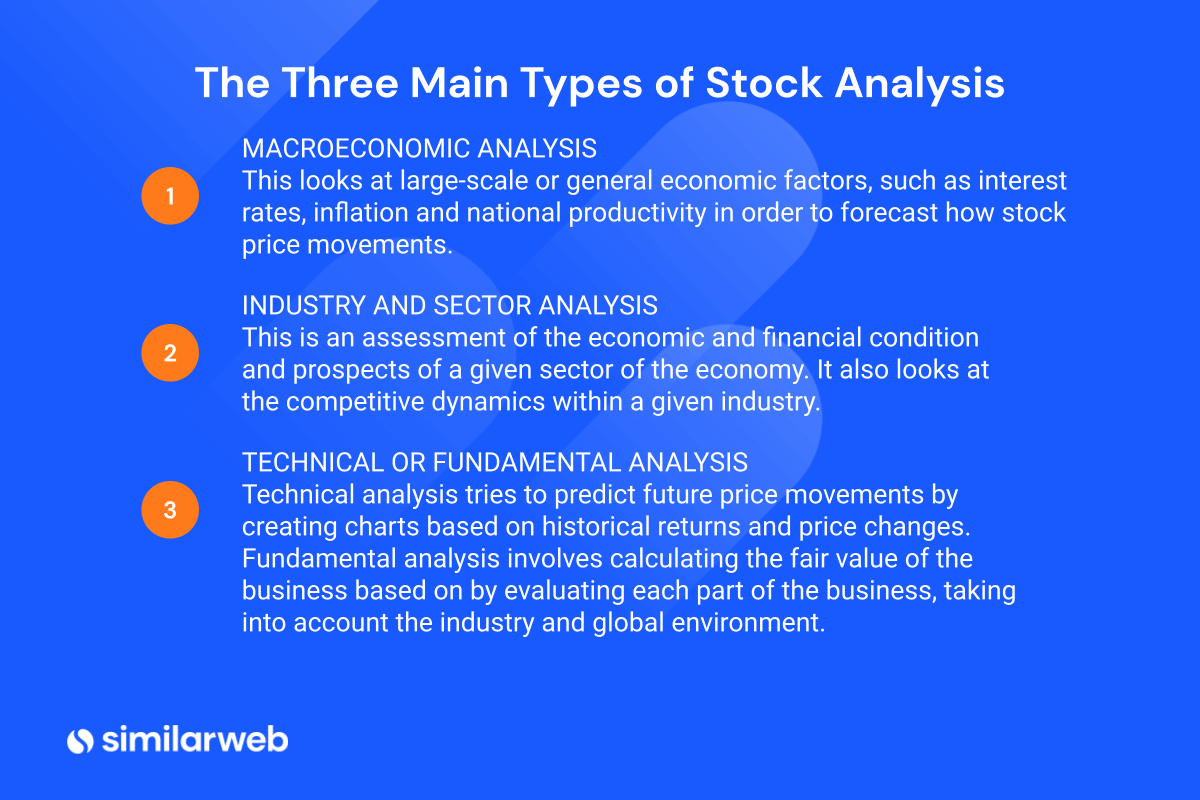
2. Industry and sector analysis
Industry analysis focuses on how specific areas of the economy are performing. The S&P 500 index, which measures the stock market performance of the largest publicly-traded companies in the U.S., is divided into 11 sectors.
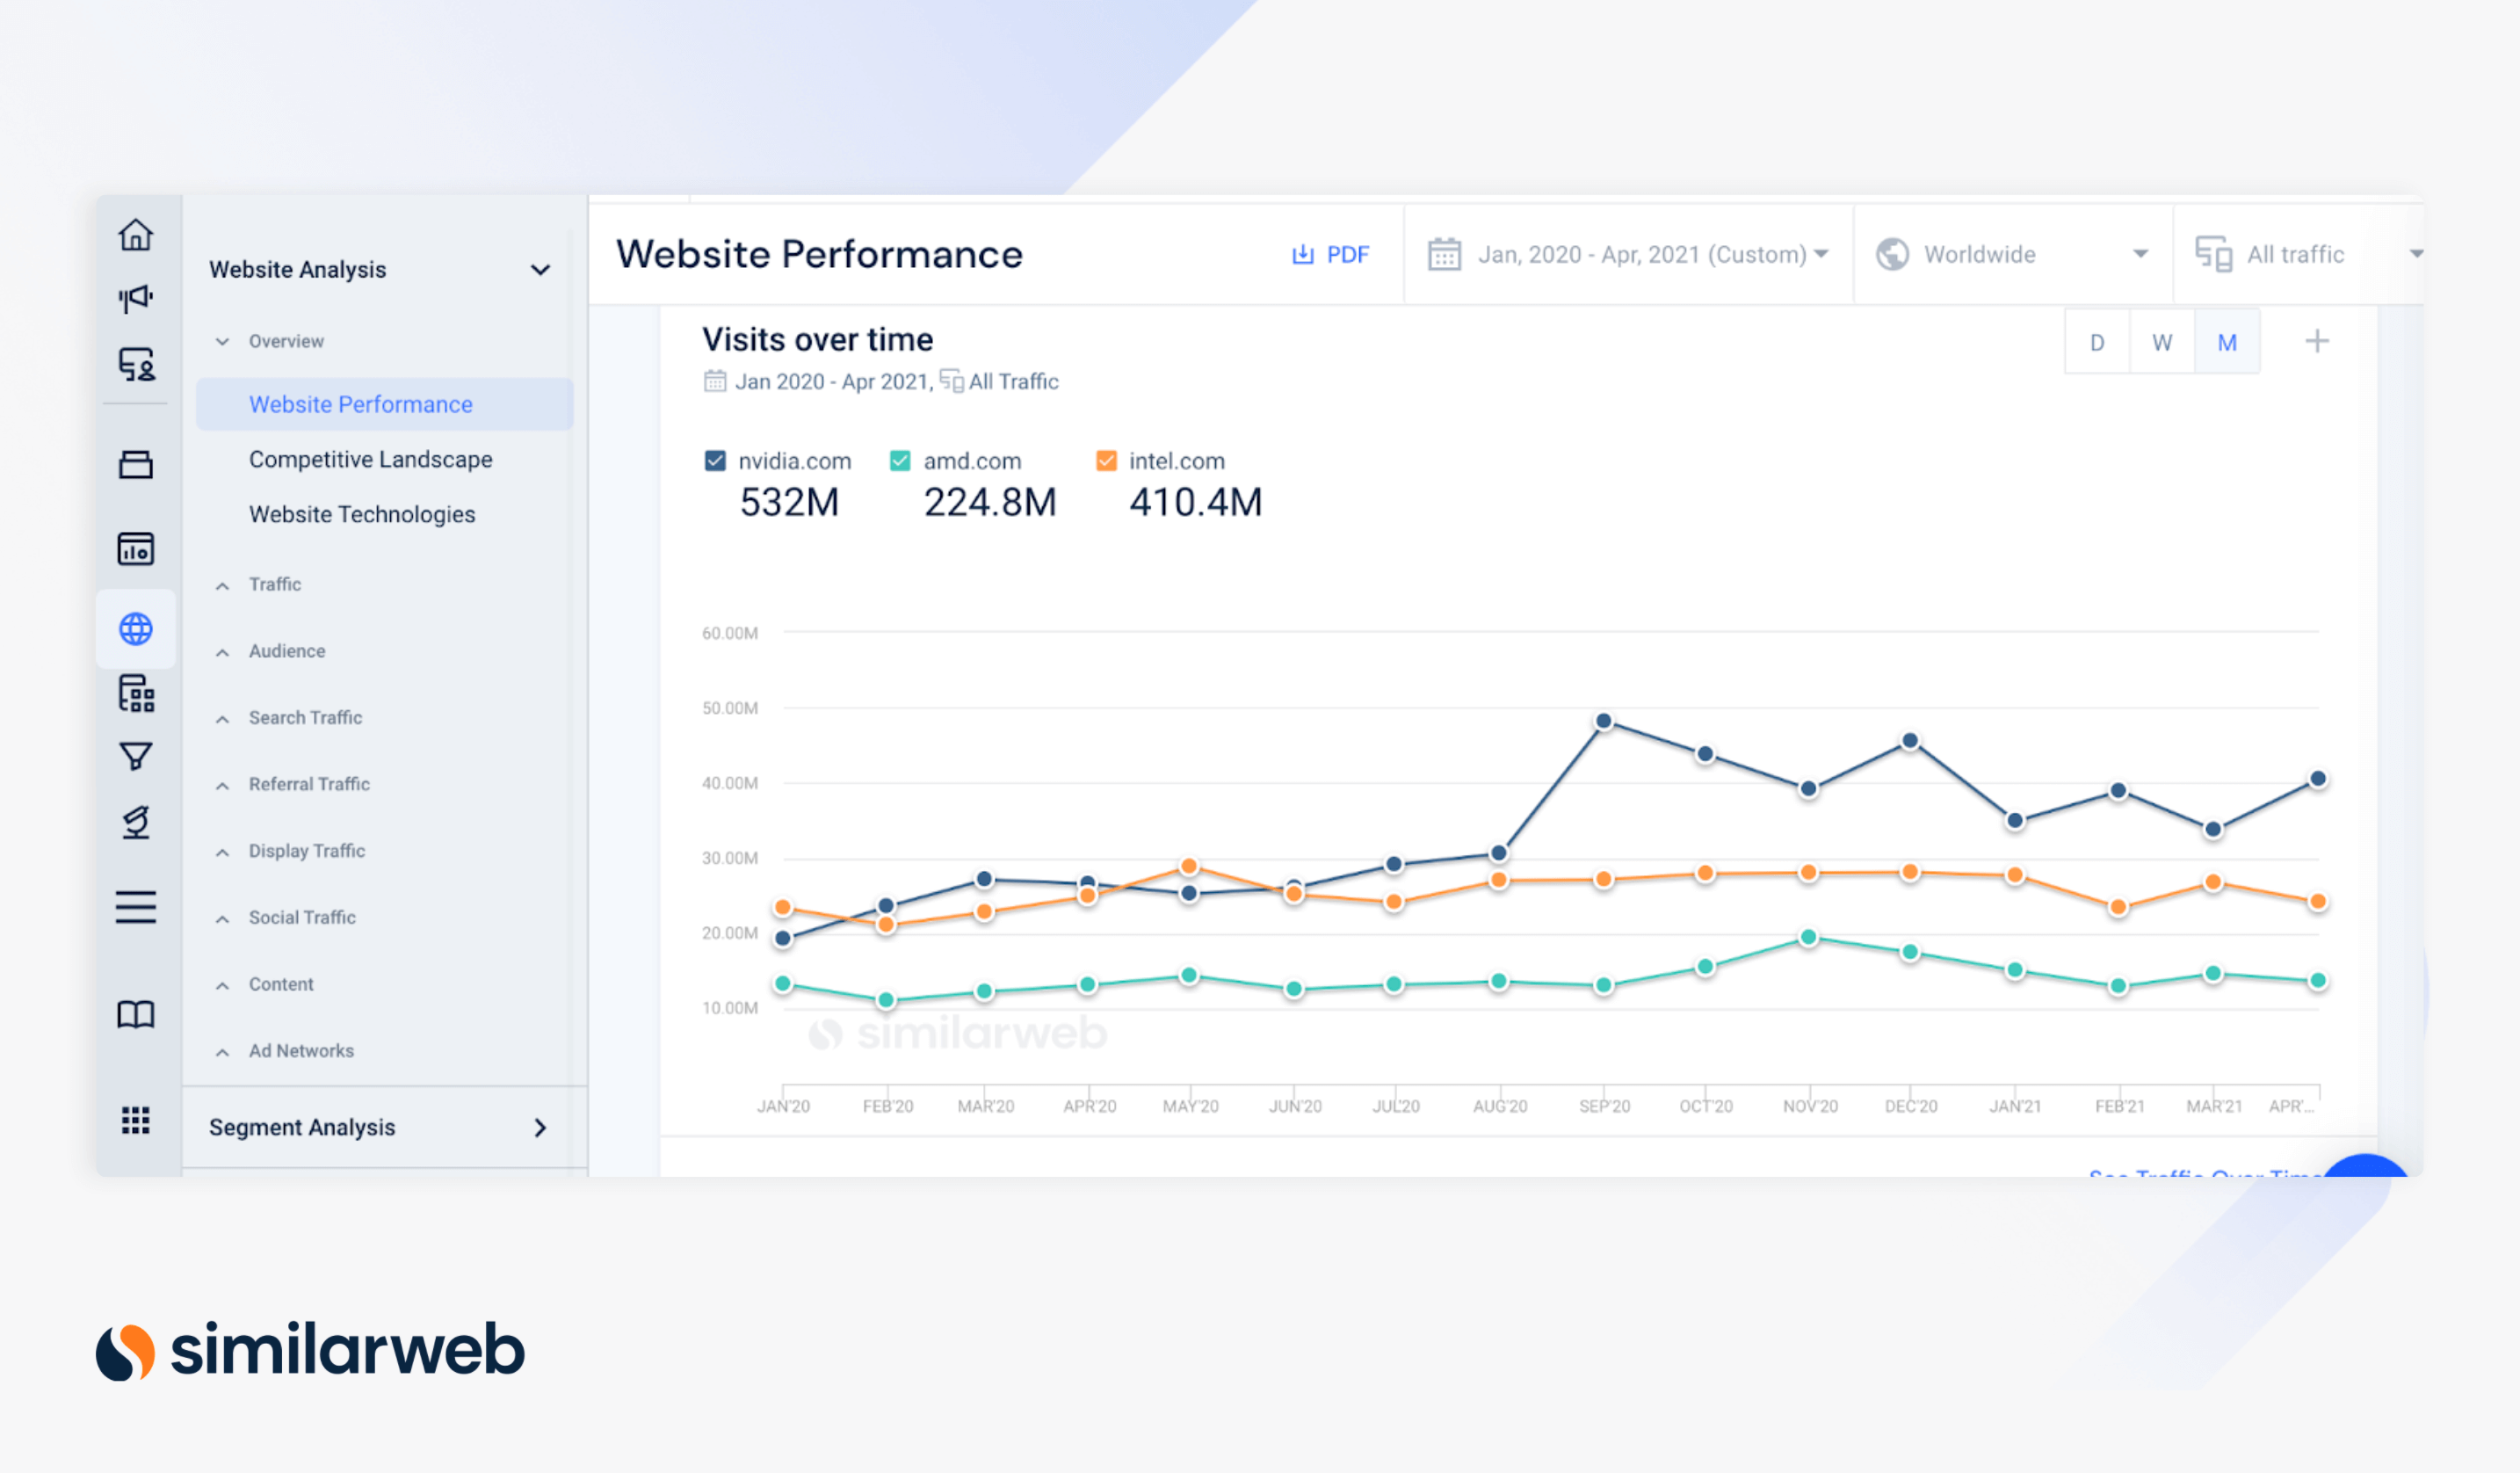
Over the past decade, tech has been a high growth sector, especially in the U.S. Shares of semiconductor companies, which manufacture and sell chips found in many products, have also skyrocketed. Indeed, the global semiconductor market is projected to grow from $452.25 billion in 2021 to $803.15 billion in 2028. And within this industry, investors will compare growth rates and expansion prospects for stocks such as Nvidia, AMD, or Intel.
Which are the fastest-growing tech websites right now? We used Similarweb data to rank the top 10 tech websites in the U.S. over the last three months. You can access this list now.
In addition, some of the most successful growth companies have been those that have taken advantage of significant societal shifts. For instance, over the past year, the world shifted to a more “stay-at-home, work-from-home” economy. Stocks such as Zoom Video (ZM) have clearly benefited, with ZM exploding 400% in 2020! You can check out our free Zoom earnings analysis here.
See Zoom’s digital trends in near real-time here
Similarly, as remote working becomes more popular, a move to larger homes, especially in the suburbs, gains pace. Low interest rates have helped housing stocks, homebuilders, and residential real estate investment trusts (REITs).
3. Technical vs. fundamental analysis
Combining technical analysis and fundamental analysis helps you determine the intrinsic value of a company’s stock. Technical analysis looks at share prices and trading volume within various timeframes (such as yearly, quarterly, monthly, daily, or intraday).
Price trends and trading activity as summarized on charts comprise the basis for investment decisions based on market value. Several technical analysis tools for individual stocks include moving averages, support and resistance levels, trend lines, oscillators, and patterns. Market participants rely on such indicators to generate buy and sell signals for short-term and long-term investments.
Fundamental analysis of equities, on the other hand, helps calculate whether the current share price of a business reflects the actual value of the company. Financial metrics are used to estimate the share value of a firm. Market participants rely on numbers, mainly from a company’s earnings statement, to calculate key ratios that show the financial health of a business.
How to analyze stocks using key financial metrics
“The best way to measure your investing success is not by whether you’re beating the market but by whether you’ve put in place a financial plan and a behavioural discipline that are likely to get you where you want to go,” Benjamin Graham, the father of value investing and Buffett’s mentor.
Equity investing comes with significant return and risk potential. As a result, proper due diligence of a company’s current price, its performance, earnings growth, operations and products, as well as financial numbers, is crucial. Investors use various metrics and valuation tools to determine whether a stock is trading at an attractive price.
When companies release financial statements and quarterly earnings reports, investors pinpoint the best stocks by analyzing the:
- Income statement – summary of the profitability of a firm with a period of time, such as a quarter or a year
- Balance sheet – a list of the company’s assets and liabilities at a particular date, such as the last day of the year
- Cash-flow statement – shows how much cash flow the business has generated as a result of operations, investments and financial activities
- Revenue (or the sales figure) – This is one of the first numbers investors look at to determine the company’s financial health. This can be found on the income statement — without revenue, there can be no earnings or eventual profit. An increase in revenue is usually referred to as top line growth.
In the case of nascent sectors or young companies, which are not necessarily profitable yet, analysts pay special attention to stable revenue growth. Research by Eli Bartov of New York University states, “In the absence of a history of profits and meaningful book values, conventional wisdom suggests that investors rely on revenue as an important financial value driver.”
However, he warns that some early-stage companies without profits might inflate “revenue either by recording sales at their gross rather than net value (“grossing up” revenue) or by recognizing them aggressively, before they were earned.” In short, investors need to pay attention to how revenue is recognized, and then analyze several other metrics besides revenue including the company’s financial statements.
The footnotes of financial disclosures in earnings statements typically give information on non-recurring events, income recognition, or depreciation policies, all of which can have an effect on the reported financial results and add to your stock analysis arsenal.
Want to keep on top of all the investor lingo? Check out our Ultimate Investor Glossary now.
The golden ratio(s)
There are several key ratios for carrying out an effective stock analysis. Each has its strength and limitation, which is again why it is best not to focus too much on one single calculation. Some of the most popular ratios include:
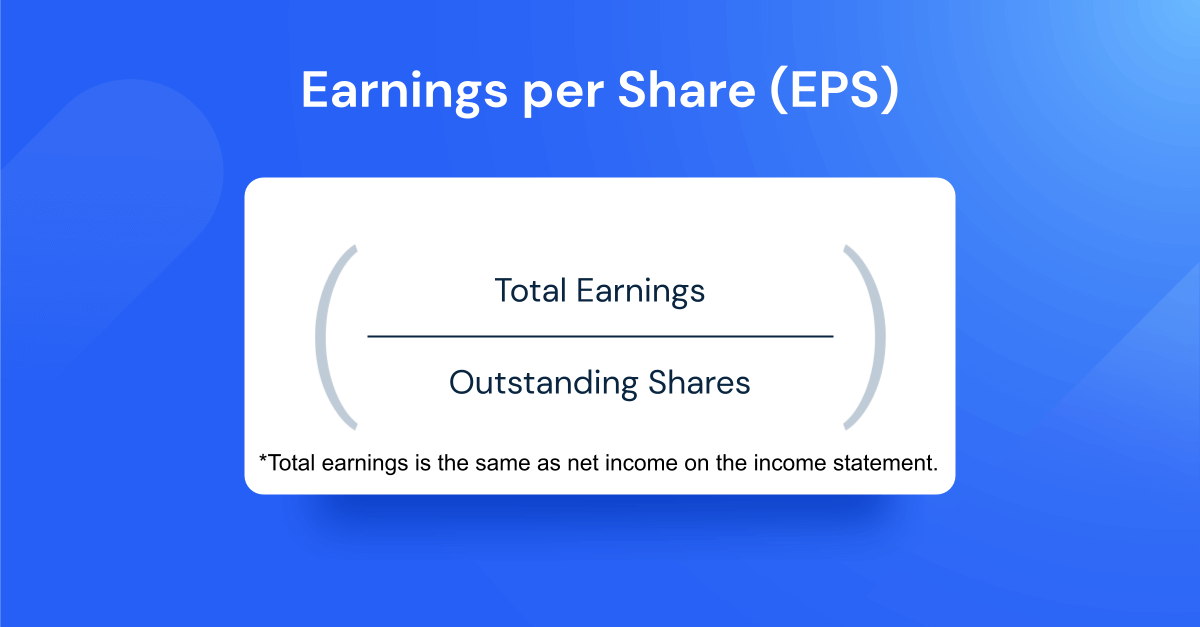
- Earnings per share
- EPS growth rate
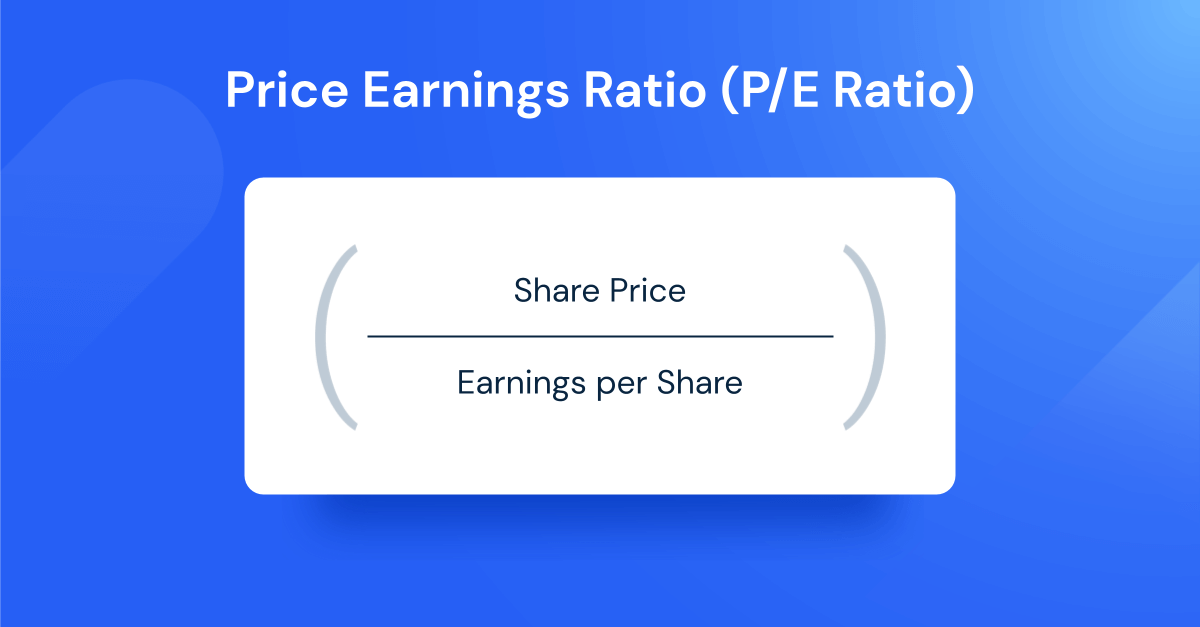
- Price-to-earnings ratio
- Free cash flow
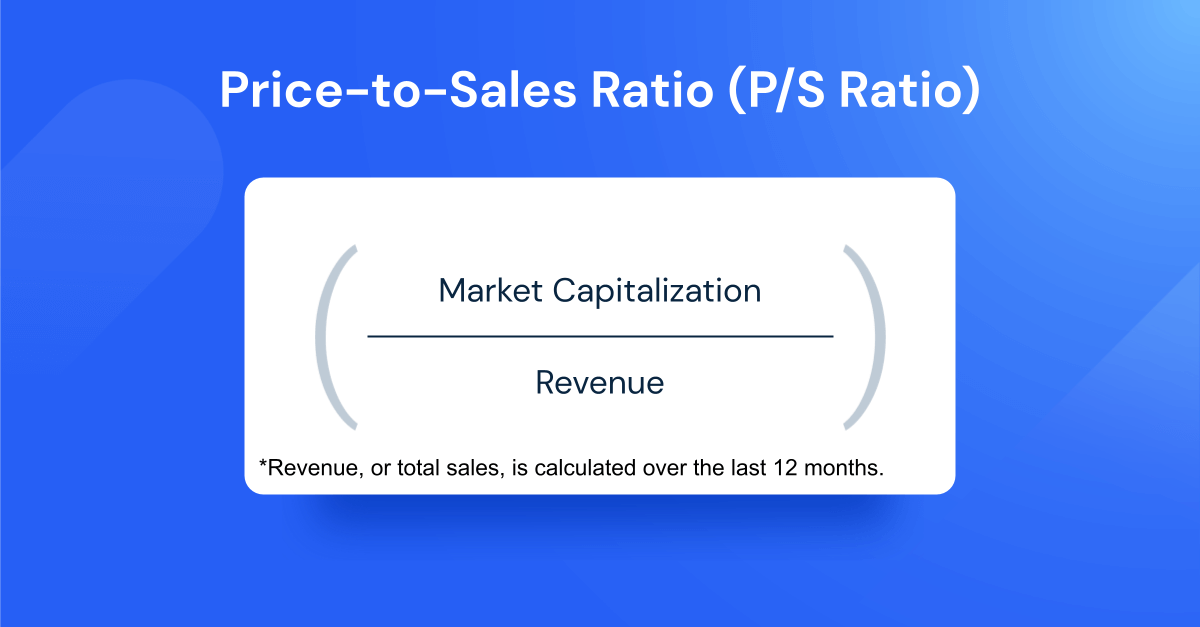
- Price-to-sales
- Return on equity
- Total-debt-to-total-assets ratio
Below we explain what each of these metrics means.
Earnings per share (EPS), which shows profitability, is found by dividing a company’s net profit by the number of common shares outstanding. A consistently growing EPS suggests that management is successfully creating shareholder value. Most companies provide the EPS figure on their regular earnings statements.
An extension of EPS is the EPS growth rate, which shows whether profitability is increasing or decreasing. You can calculate this by:
- Subtracting the initial EPS from the final EPS
- Dividing the change in EPS by the initial EPS
- Multiplying the result by 100 to calculate the EPS growth rate as a percentage
Double-digit EPS growth rates point to a business with products or services that are in strong demand. High-growth companies become more profitable over time, and their market price typically reflects that profitability.

Price-to-earnings ratio (the P/E ratio) reveals the relationship between a company’s stock price and EPS. Like most other ratios, the P/E ratio can be a useful tool in industry-specific analysis. Investors can compare a company’s P/E ratio to those of its peers and of the industry average.
P/E ratio is also referred to as the earnings multiple or the price multiple. A high P/E ratio could signal that a company’s stock is overvalued, especially in historic terms. Growth stocks typically have a high P/E ratio as investors are typically ready to pay for expected future growth rates.
However, the P/E ratio can only take you so far when it comes to deciding which stocks to buy or sell. For instance, it is based on EPS – which can give a distorted impression of a company. Due to varying accounting methods, companies can report positive earnings even if their free cash flow is negative. Plus there are stocks with low P/E ratios where the P/E ratio will fall further, and vice versa.
Free cash flow (FCF) is the amount a firm has left over after paying for all operational expenses. Investors look for stable FCF generation, which provides tailwinds for the share price of the company to grow.
Those companies that generate ample free cash flow are able to return cash to shareholders (through dividends or share buybacks), make strategic purchases, invest in technology, or save that cash as an emergency reserve for a time period when the economy might contract.

Price-to-sales (P/S) ratio is another widely used valuation tool, found by dividing the share price by the sales per share. For instance, a P/S ratio of two for a member of the S&P 500 index means an investor is paying $2 per dollar of sales.
If a company is not yet profitable (such as in the case of young growth shares), analysts look at the P/S ratio to see whether the shares are frothy or undervalued. In general, investors prefer a low P/S ratio. However, this metric should also be used along with other valuation measures.
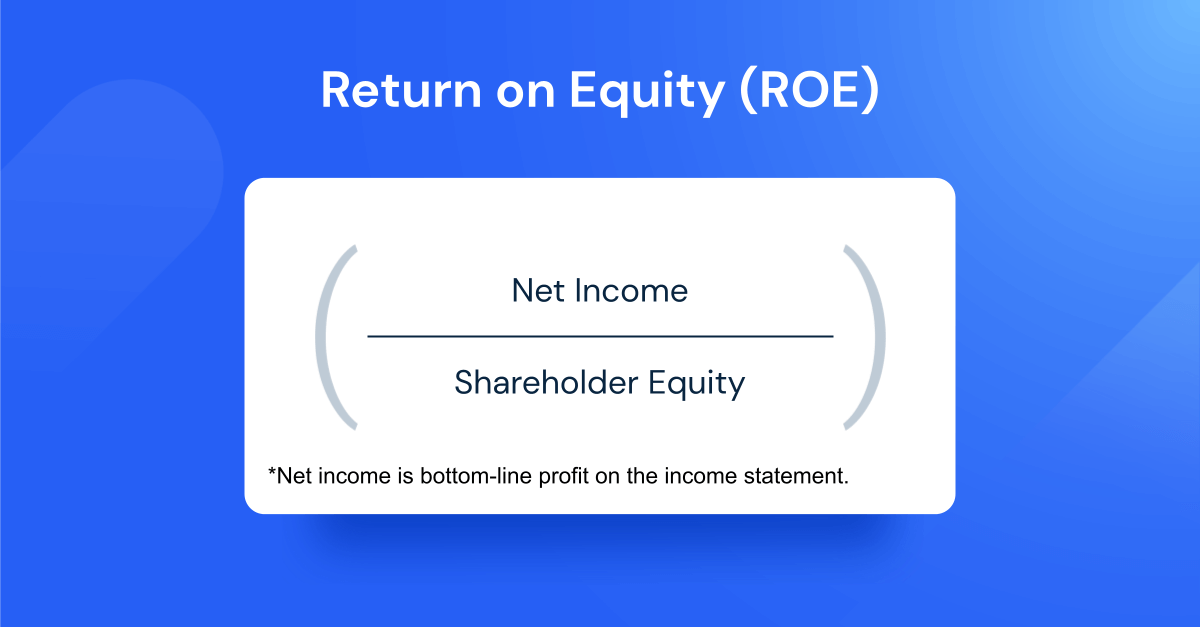
Return on equity (ROE) is net income divided by shareholder’s equity. Put another way, investors can analyze if a company’s management is using capital effectively. It can also be used over time to see changes in a firm’s financial situation.
ROE brings together the income statement and the balance sheet. Deloitte suggests, “For shareholders, ROE provides a short-hand way of judging profitability of their investments.” Investors typically compare a firm’s ROE to the industry average.
The market usually prefers a high ROE. However, investors need to determine whether a high ROE is the result of high financial leverage. In other words, if a business has taken on a large debt burden, management increases the leverage and ROE without necessarily increasing efficiency or profitability.
Understandably, most businesses have some amount of debt that enables management to carry out strategic plans and long-term objectives. But a large level of debt could have restrictive effects. If the economy contracts or revenues decrease, the firm could easily run into financial problems. Too much debt on the books can end up restricting operational flexibility. In other words, a company’s debt levels should be manageable.
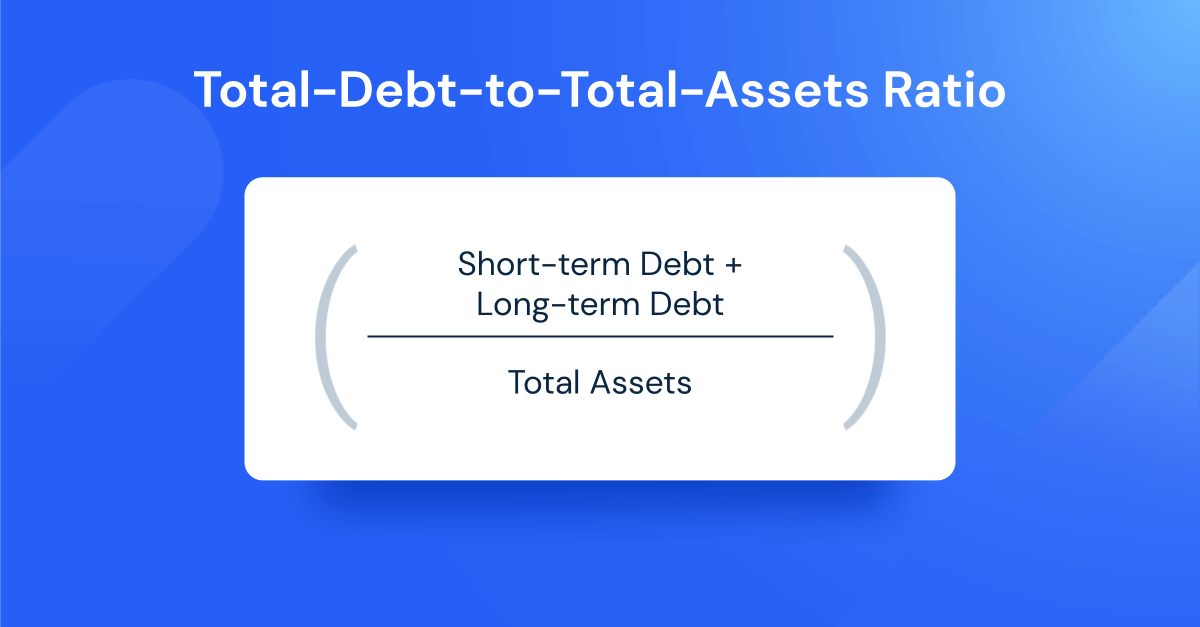
Investors usually look at the total-debt-to-total-assets ratio (or debt to assets ratio), which shows the percentage of total assets financed by creditors. Average debt ratios depend on the industry. Therefore, it is important to compare a stock’s debt to asset ratio to that of the industry, and to track changes in debt levels over time. Expensive or aggressive acquisitions that increase debt levels could act as warning signs for the stock price.
Next step: Take advantage of alternative data
Aside from traditional methods of stock analysis such as financial ratios and earnings performance, investors now have a ton of other digital tools at their fingertips to gather information for better-informed investment decisions. Alternative data is a very powerful resource if you’re trying to decode a company’s performance – and stay ahead of the market.
Alternative data includes everything from consumer preferences to social media signals. It also includes credit card transaction data, geo-location and satellite data that monitors foot traffic or flight frequency.
How to analyze stocks before buying using digital data? Well, internet search results highlight which sectors of the economy are enjoying increased attention. Real-time website traffic trends can help you understand the growth potential of a specific industry. And search results of a company’s stock ticker could point to increased attention by market participants.
A great example here are the Similarweb industry heatmaps, which track the winners and losers of the current economic climate in near real-time. Here we can see the recovery in the Transportation and Travel & Leisure industries from mid-March 2021 as U.S. lockdowns ease:
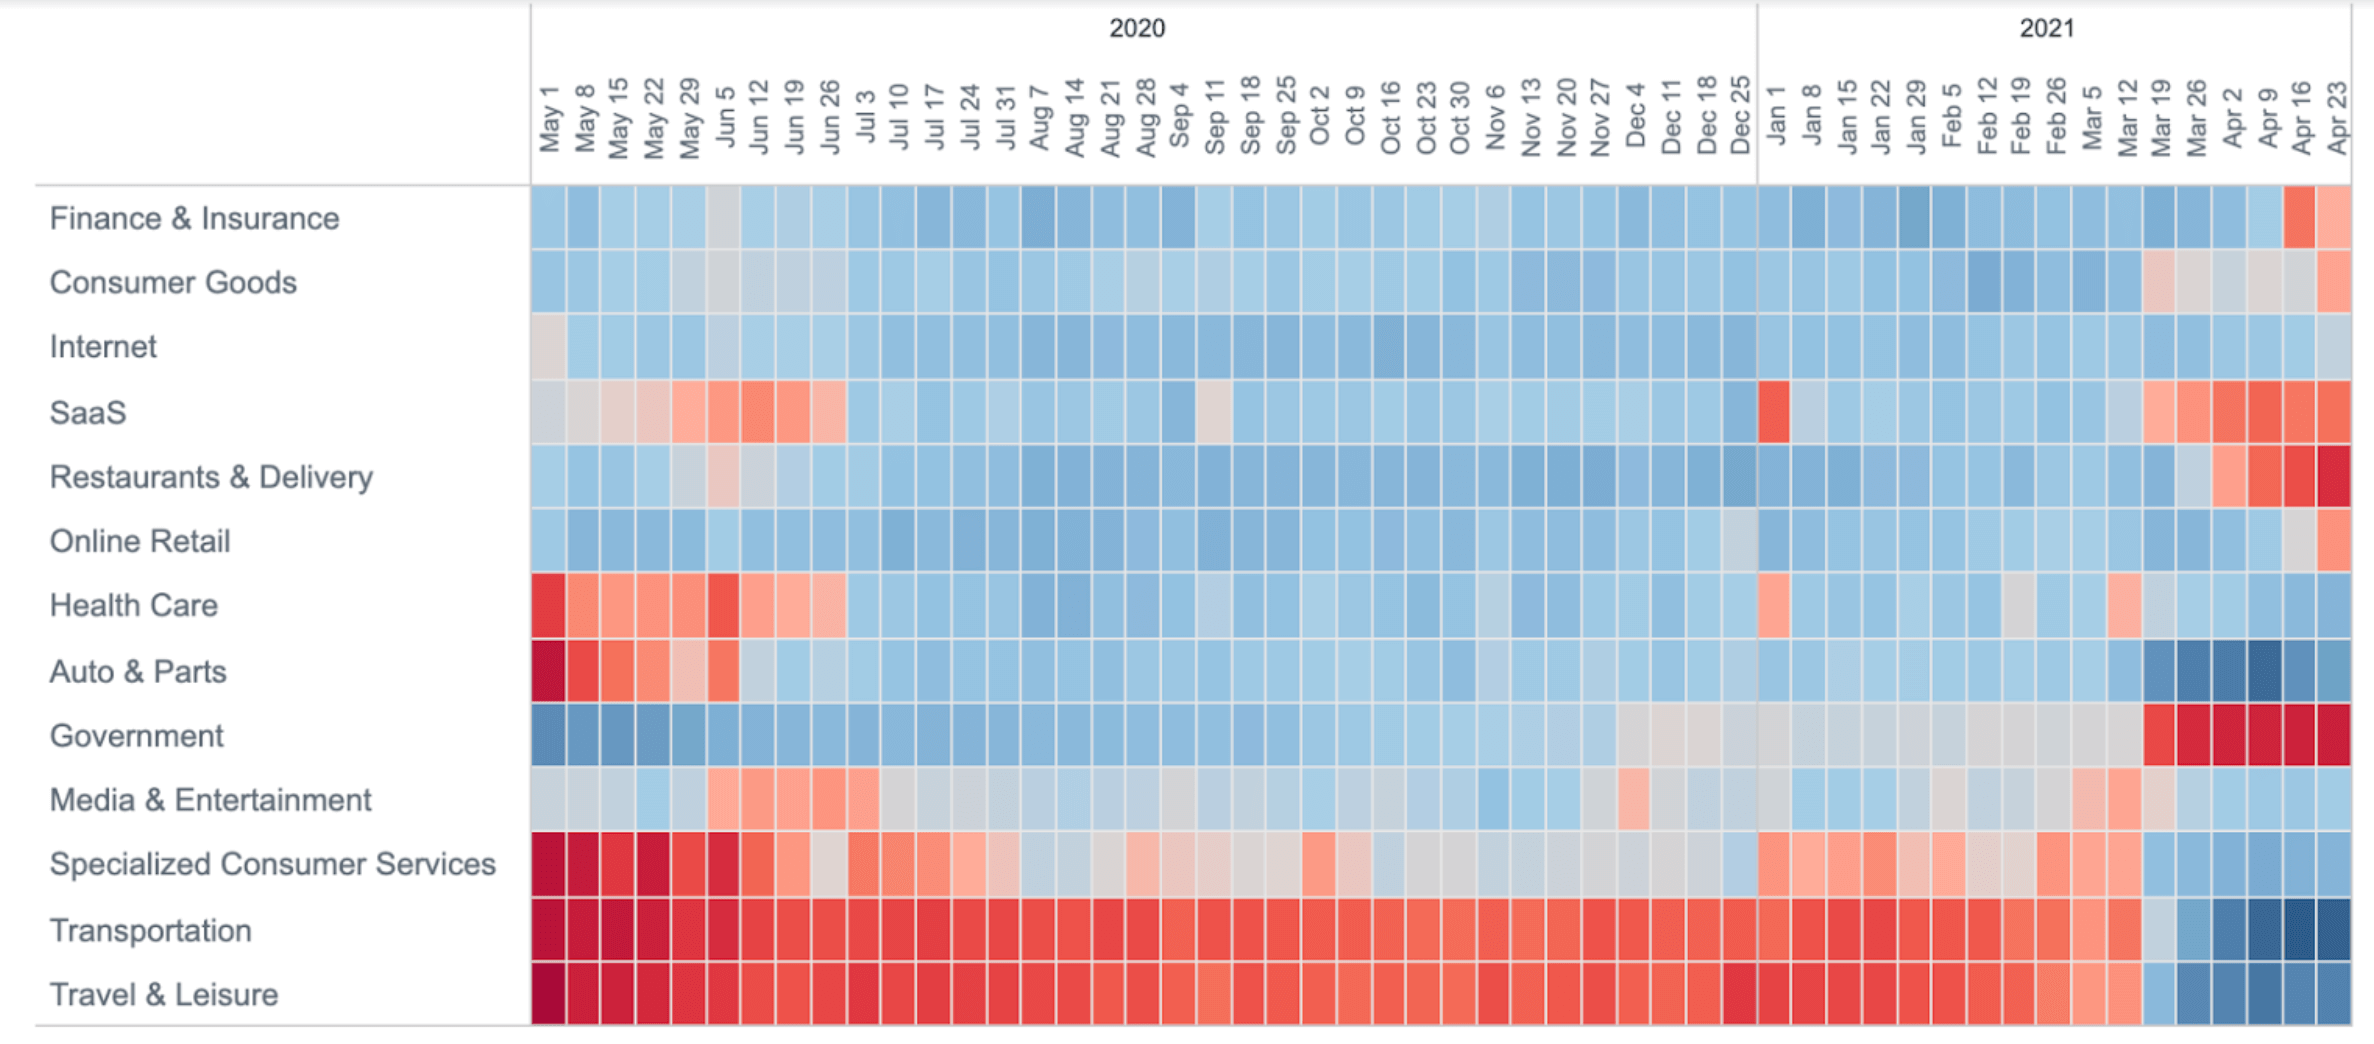
>> Want more granularity? Read our latest digital heatmap report here
When looking at company specifics, Similarweb also shows website visitor numbers, audience engagement, including how long visitors spend on a specific website, and conversion data (the proportion of visitors that end up on a ‘thank you’ page signaling a completed transaction). Investors can also compare web metrics of a given business with key rivals.
This can be particularly useful for one, pre-earnings insights and two, insights into companies that haven’t even gone public yet, with limited public financial information available, such as investment platform Robinhood. You can see how powerful the data can be from our Q4 earnings wrap here. It’s no surprise that, according to Forbes, the buy-side spent $1.1 billion on alternative data in 2019.
Now it’s your turn to reap the benefits and tone your investment strategy.
Join thousands of investors who are already using Similarweb data to make better investment decisions


Related Posts


Invest using the most insightful asset research
Leverage data used by 5,000+ companies to improve your strategy