Customer Growth: Tracking Company Success

If you build it, they will come. Okay, it’s not that simple. There are so many moving parts that contribute to a company’s initial product launch and support business growth and success, including R&D, production, marketing, and GTM, to name just a few.
How is that success tracked? Through customer growth and retention. Publicly traded companies release quarterly earnings reports for investors to gain insight into their performance.
However, in the era of big data, there are alternative ways to track this performance throughout the quarter, one of which is to use URL performance to determine customer acquisition and churn.
Traditional customer growth KPIs
There are several ways to measure customer growth that truly matter. Here are some of the traditional KPIs:
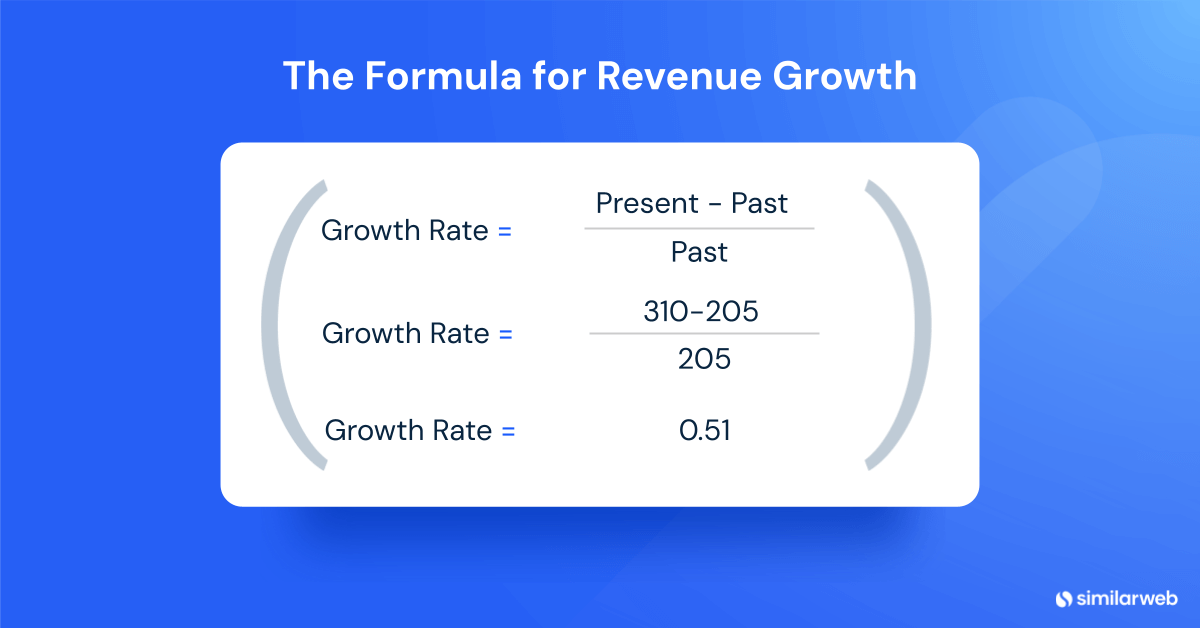
Revenue Growth
Revenue growth is the obvious KPI, and it measures an increase in revenue over a specific period, usually quarterly or annually.
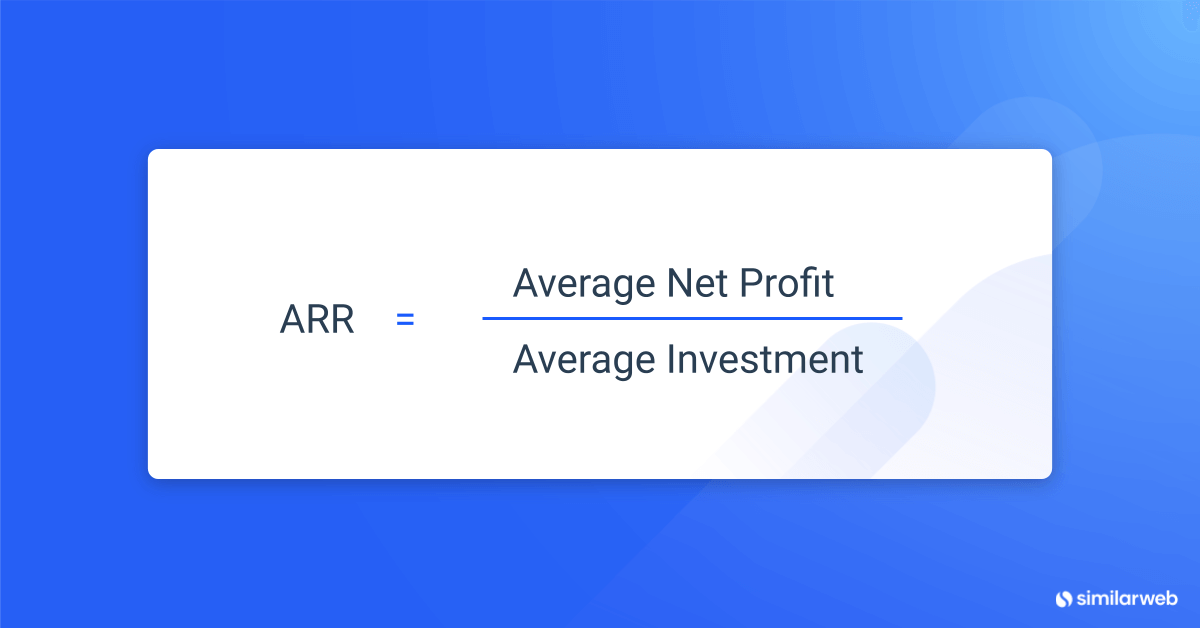
MRR and ARR
Monthly recurring revenue (MRR) and annual recurring revenue (ARR) are the predictable total revenue from all active subscriptions each month and year. They include all recurring charges from discounts, coupons, and add-ons but omit any one-time charges. ARR is a key metric for any business with a subscription-based pricing model, like Softwaere-as-a-Service (SaaS) companies.
Customer retention rate
The customer retention rate (CRR) equals the number of customers a company maintains over a specific period of time. It is calculated by comparing the number of customers at the beginning of the specified period to the number of customers at the end of that specified period. If the number is unchanged, then the company has a CRR of 100%.

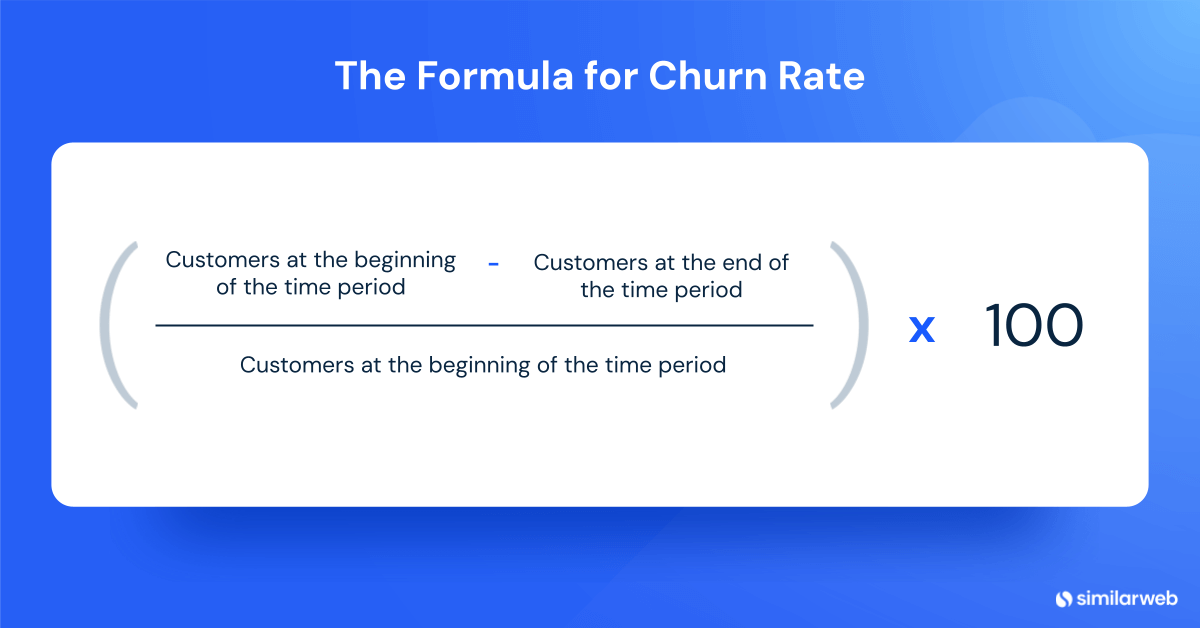
Churn rate
The churn rate is the percentage at which customers stop subscribing to a company’s service. For example, if a company has 1,000 subscribers at the beginning of the month and 50 of them cancel their subscriptions by the end of the month, the churn rate for that month would be 5%.
Customer Lifetime Value
A customer’s lifetime value (CLV) is a closely-watched metric that measures a customer’s worth to the company over the course of their relationship by examining that customer’s historical and future profitability – from onboarding to engagement and upsell.

Tracking customer growth
These traditional KPIs remain the standard for determining customer growth and there are both internal processes and external resources a company can employ to accurately track customer retention and growth.
Internal Sources
Internal sources used to track customer growth include
- Revenue
- Distribution channels
- Price points
- Customer surveys
- Social media impressions
- Website analytics
External sources
External sources, aka alternative data, can be used by investors to measure growth. These sources are:
- Transactional data
- Website and app traffic data
- Social sentiment
- Geolocation data
Measuring customer growth with Similarweb Stock Intelligence
Similarweb Stock Intelligence makes it easy to conduct a business growth analysis with metrics that act as proxies to key KPIs, focusing on web and app performance. Where does the data come from? It comes from a company’s digital assets and URLs.
Subdomain and folder data highlight:
- New customers and customer sector trends, such as what types of companies are subscribing
- Net and gross customer retention
- Subsidiary growth by tracking the customer journey through to sign-ups and cancellations
The correlation between increased sign-ups and stock performance enhances investor forecasting accuracy.
Measuring customer growth with Subdomains
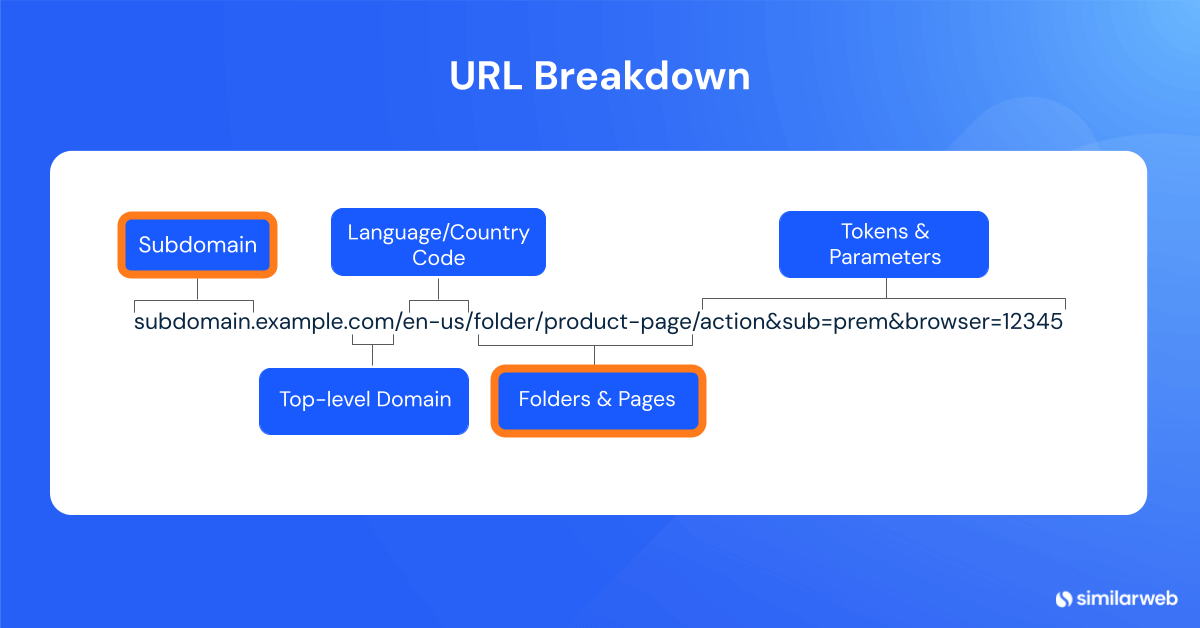
A subdomain has a prefix added to a website’s domain name to separate and organize content for a specific function. For example, if the main domain is “zoom.us,” a subdomain would be companyname.zoom.us. This allows the customer site to be designed, organized, and optimized independently.
Subdomain data analytics track usage, which allows for the analysis of user engagement and the measurement of business growth, particularly for SaaS companies.
The cloud data platform Snowflake (SNOW) is a good example.
SNOW creates subdomains for its larger enterprise and strat clients. So, customers are given subdomains unique to them, i.e. company.snowflake.com. Because this subdomain is trackable, analysis will show how many new subdomains are added on a monthly and quarterly basis.
SNOW is seeing greater year-over-year new subdomain growth (YoY) into 3Q24. January saw 69.2% YoY growth, and April saw 157.1% YoY growth. The only month with a more significant increase in new subdomains was January 2023, with 160% YoY growth.
An investor can also draw insights from how engaged SNOW’s current enterprise customer base is.
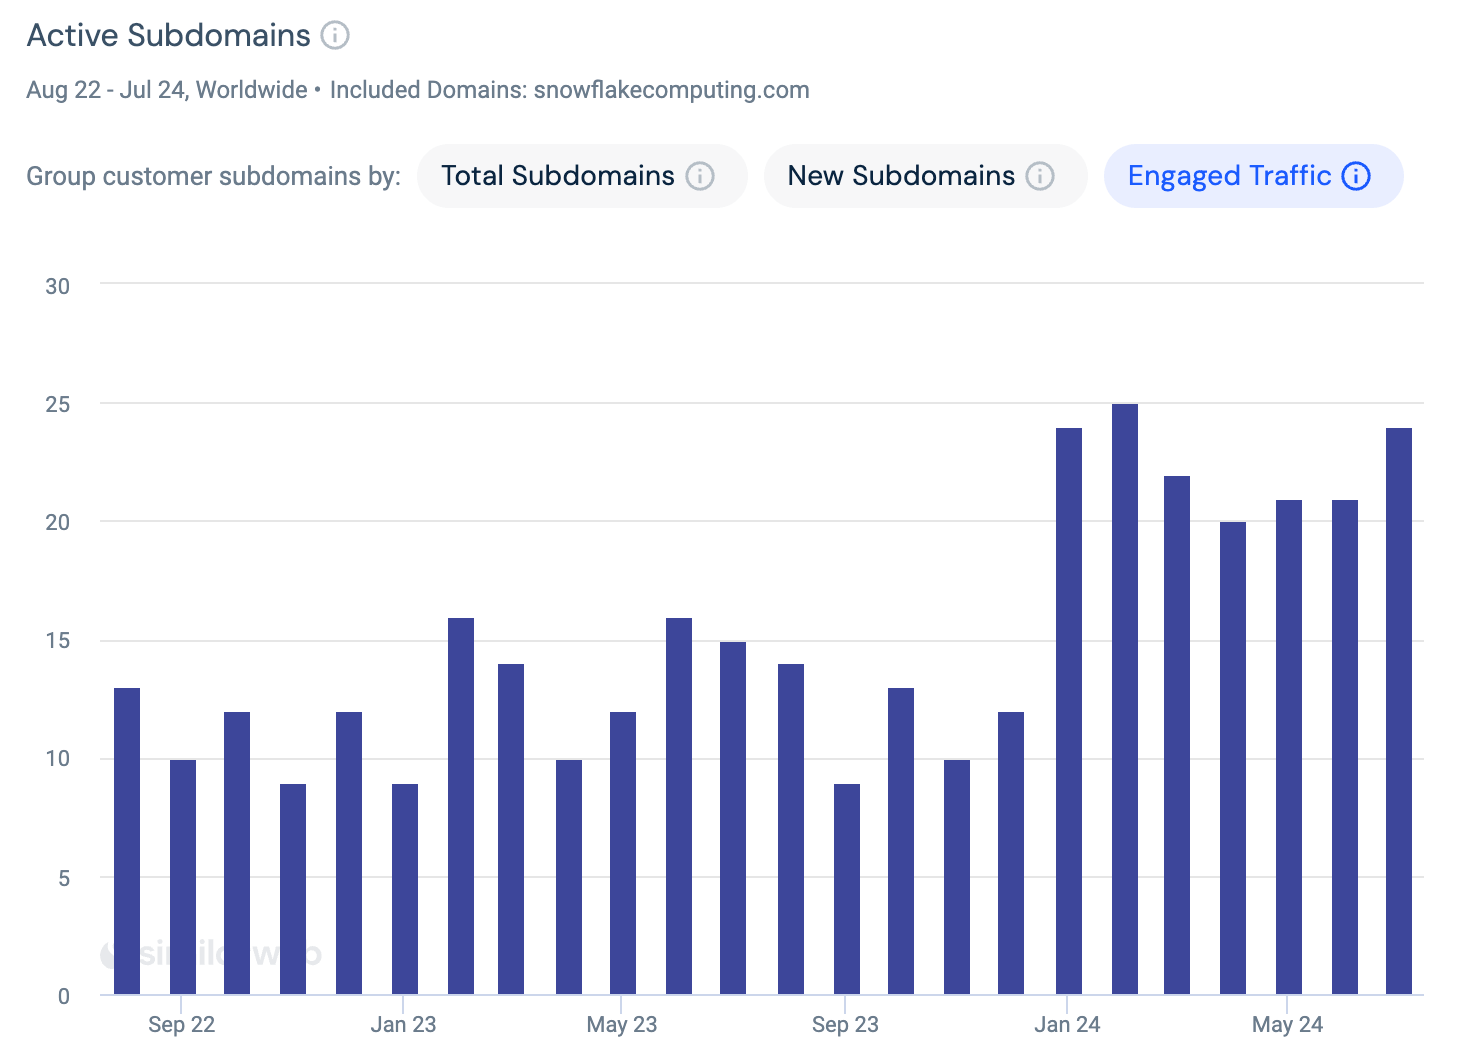
Customer engagement increased significantly over the first half of 2024. Traffic to customer subdomains increased 56.2% YoYin February, and traffic increased 60% YoY in July.
Measuring customer growth with folders
A folder is a subdirectory of a website’s root folder designed for organizing web pages and grouping related content in a logical hierarchy. It also stores images, stylesheets, and other site assets used across multiple pages. These folders are represented by segments in the URL path. For example, the URL “example.com/blog/” contains all content featured on the company’s blog. Similarly, the “example.com/shop/” folder holds all content utilized in the shop section of the website.
Folder data provides insight into interaction as the user engages with the content held within a customer folder (i.e. tost.com/client/client_id). This data includes website traffic, page views, bounce rates, and other engagement metrics. This is great for monitoring the growth of any online subscription-based product or service.
Accessing and analyzing subdomain and folder data provides insight into the customer journey, customer growth, and churn, allowing investors to forecast quarterly earnings. This data also provides insights beyond customer growth and retention and changes depending on the sector and industry. It provides investors with additional insights into product sales, updates and releases, and consumer behavior.
The customer (alt) journey
The customer journey is crucial for any company’s success. It must captivate prospects throughout the sales funnel and continue to engage customers after onboarding.
Tracking this journey is essential for measuring business growth. By leveraging alternative data from a company’s digital assets, investors gain insights across web and app traffic and engagement metrics.
Similarweb Stock Intelligence aggregates this data by ticker, enabling investors to see a comprehensive and unique view of any publicly traded company, measure customer growth consistently throughout the year, and generate alpha to inform investment strategies and decisions.
FAQs
What KPIs are used to track customer growth?
Revenue growth, monthly and annual revenue retention, customer retention rate, churn rate, and customer lifetime value are the KPIs used to measure customer growth.
What are subdomains?
Subdomains are trackable URLs created to separate and organize digital assets so that they operate independently from the main website, such as companyname.zoom.us.
What are folders?
Folders form the hierarchical subdirectory of a company website, organizing web pages, content, images, and style sheets for everything on that website, like company.com/blog or company.com/shop. A customer folder looks like this: tost.com/client/client_id
What information do subdomain and folder data provide?
Subdomain and folder data provide insight into a company’s user engagement through traffic and engagement metrics, including customer growth, retention, and churn, a key element of Similarweb Stock Intelligence.
Related Posts


Invest using the most insightful asset research
Leverage data used by 5,000+ companies to improve your strategy