Uber Widens its Lead Over Lyft to a 62% Margin in the U.S.

Uber is widening its lead over Lyft in the U.S., based on Similarweb estimates of iOS and Android app engagement, including monthly active users, and downloads.
Key takeaways
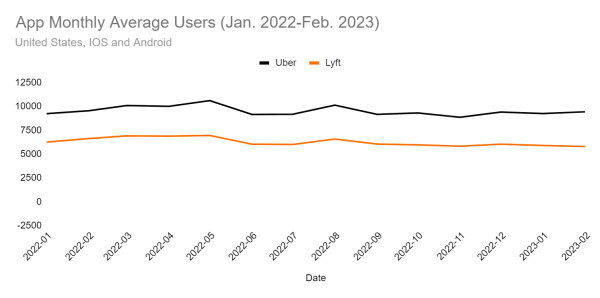
- Uber leads in Monthly Active Users (MAU), and that lead has grown over time. Similarweb data shows a combined IOS/Android MAU of 9.4 million in the U.S. in February 2023, a 62% lead over Lyft’s MAU of 5.8 million. That lead has grown from Uber’s 48% advantage in January 2022.
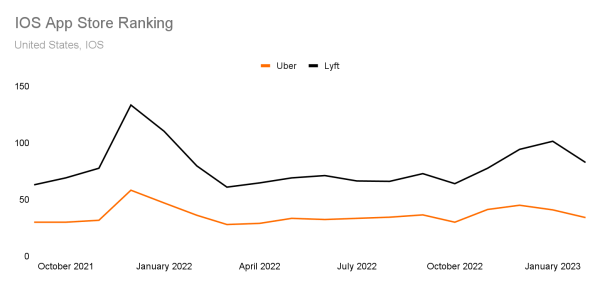
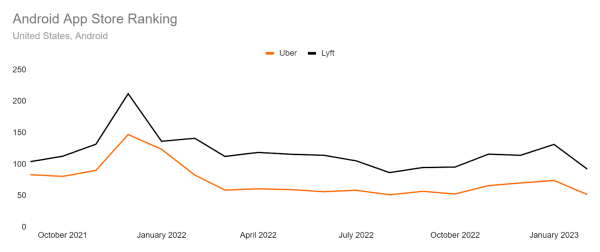
- Uber is currently ranked #30 in the U.S. in the Apple app store, while Lyft is ranked #70. On Android in the US, Uber ranks #54 vs. Lyft’s #100.
- Over the past 12 months on Android, Uber downloads totaled 6.9 million, 22% higher than Lyft’s 5.6 million. Over the past two months, that advantage has grown. The gap was 51% in February 2023, and 45% in January 2023.
Monthly active users show Uber growing its lead over Lyft
Similarweb combined IOS and Android data on MAU (monthly active users) in the United States shows that Uber not only has a huge lead over Lyft, but that lead has widened sharply over time. This shows how often users are searching for and book rides.
The gap in Jan. 2021 was 3.0 million monthly active users (9.2 mil. vs. 6.3 mil., or a gap of 48%), but by February 2023 that gap had widened to 3.6 million (9.4 mil. MAU vs. 5.8 million, for a gap of 63%). So while Lyft has seen its MAU on IOS and Android devices fall by 7% over that time period, Uber has seen modest growth of 2%, and as a result, has widened its advantage over Lyft.
App store ranking gap widening between Uber and Lyft
Similarweb’s data on app store ranking on IOS shows the wide gap between Uber and Lyft. For February 2023, Uber’s app store ranking was #30, versus Lyft’s #70. In September 2021 Uber’s app store ranking was #30 while Lyft’s was #63, so you can see that over time, Uber has kept its overall ranking, while Lyft has lost 7 spots.
Over the past 18 months, Uber’s app store ranking has ranged from 30-58, while Lyft’s has ranged from 61-133. You can see the relative differences over time in the chart below. You can see that the gap has widened.
You can see a similar trend on Android, with Uber’s ranking in February 2023 averaging #54 for the month, versus Lyft’s #100, a gap of 46 places. Back in September 2021, Uber’s average Google Play store ranking was #83 versus #104 a gap of only 21 places. So Uber has widened the gap over time.
Over the past 18 months, Uber’s Android ranking has ranged from 52-147, while Lyft’s has ranged from 87-212. You can see the change over time on the chart below.
Android download data tells a similar story
Similarweb’s data on downloads over time shows that Uber has maintained a lead on Lyft on this important dynamic. For February 2023, Uber had 1.2 million downloads on Android devices, versus 794K for Lyft, a gap of 34%.
Back in September 2021, Uber had 1.6 million downloads versus 1.2 million for Lyft, a gap of 24%. So the gap in downloads has widened over time. Notably, downloads have trended downward for both companies for some time.
Install penetration rate also favors Uber
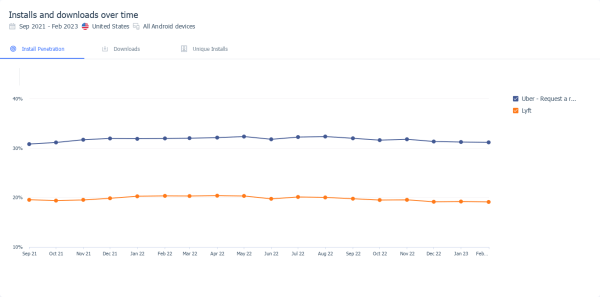
Looking at the install penetration rate on Android, you can see that Uber maintains a solid lead over Lyft. In February 2023 Uber’s install penetration rate was 31% versus 19% for Lyft. That gap has remained mostly steady over time. Back in September 2021, Uber’s install penetration rate was 30.8% versus 19.6% for Lyft.
Uber (NYSE:UBER) and Lyft (NASDAQ:LYFT) are both publicly traded.
The Similarweb Insights & Communications team is available to pull additional or updated data on request for the news media (journalists are invited to write to press@similarweb.com). When citing our data, please reference Similarweb as the source and link back to the most relevant blog post or similarweb.com/blog/insights/.
Disclaimer: All names, brands, trademarks, and registered trademarks are the property of their respective owners. The data, reports, and other materials provided or made available by Similarweb consist of or include estimated metrics and digital insights generated by Similarweb using its proprietary algorithms, based on information collected by Similarweb from multiple sources using its advanced data methodologies. Similarweb shall not be responsible for the accuracy of such data, reports, and materials and shall have no liability for any decision by any third party based in whole or in part on such data, reports, and materials.
Wondering what Similarweb can do for your business?
Give it a try or talk to our insights team — don’t worry, it’s free!


