Insights
Unique insights on key stories, powered exclusively by Similarweb data, and executed by our expert team of Analysts.

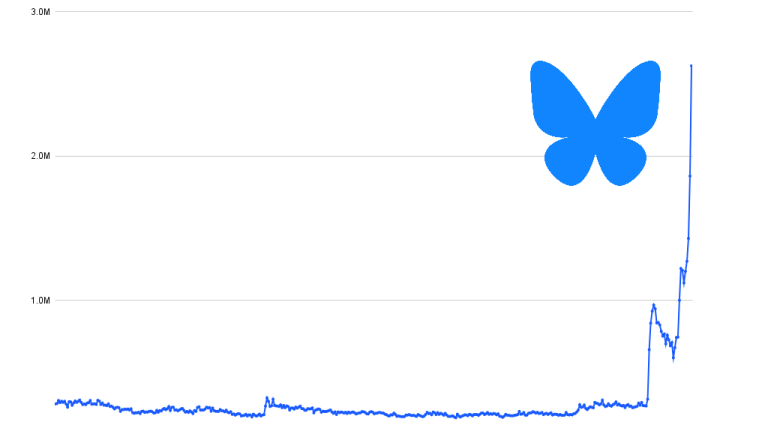
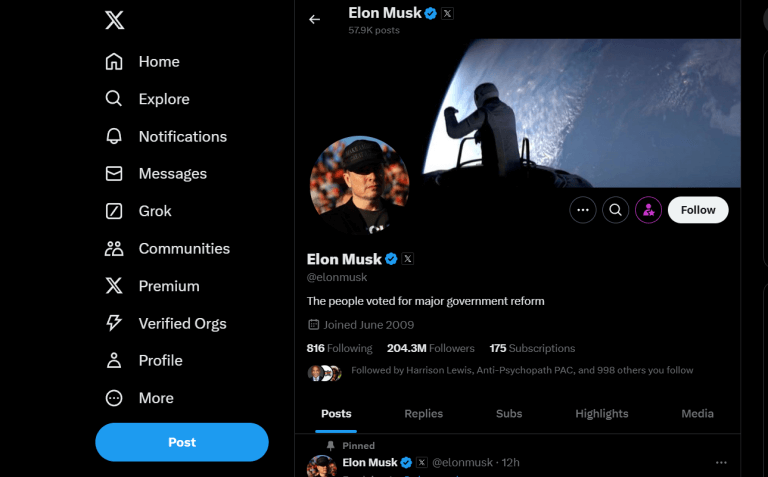
X Traffic Peaked After Election Day in US. So Did Deactivations
by David F. Carr
5 Min.
Nov 12, 2024

Global gambling market overview highlights strong growth worldwide and in Latin America
by David F. Carr
3 Min.
Nov 7, 2024


Australian Furniture and Homewares: Mobile-First and Primed for Growth
by Mir Jawad
9 Min.
Oct 30, 2024


Pawsitive Growth: Insights & Amazon Trends in the Pet Health Segment
by Maria Pashi
6 Min.
Oct 11, 2024

Our Content Topics
Find the information you need. Browse our content focus areas below.
Wondering what Similarweb can do for your business?
Give it a try or talk to our insights team — don’t worry, it’s free!
Would you like a free trial?
Wouldn’t it be awesome to see competitors' metrics?
Stop guessing and start basing your decisions on real competitive data
Now you can! Using Similarweb data. So what are you waiting for?