Airbnb Losing Market Share in Hotels and Accommodations Sector: US Web Traffic up 6% in Q1 Versus 18% Growth for Peer Group

Airbnb loses travel share while Booking.com gains
With Airbnb set to report Q1 earnings on May 2, we took a look at what Similarweb’s data shows on the company and its position among peers in the hotels and accommodations industry. Our traffic analytics shows that while the company grew web traffic by 6% in the US in Q1, that growth lagged behind its peer group, which grew 18%.
Key Takeaways:
- Airbnb grew Q1 web traffic by 6% against a peer group total growth of 18%. Globally, the company did a little better, growing total web traffic across its major domains by 8%.
- The entire peer group saw year-over-year growth, with Airbnb lagging with the slowest growth in the peer group, rising just 6%. Vrbo was up 7%, while Marriott was up 25%, and Hilton was up 27%. Expedia saw web traffic rise 19% and Hotels.com gained 15%.
- In terms of share of traffic (a proxy for market share), Airbnb lost 2.4 points of share versus the peer group while Booking gained share.
Demand was strong in Q1, but Airbnb lagged peers
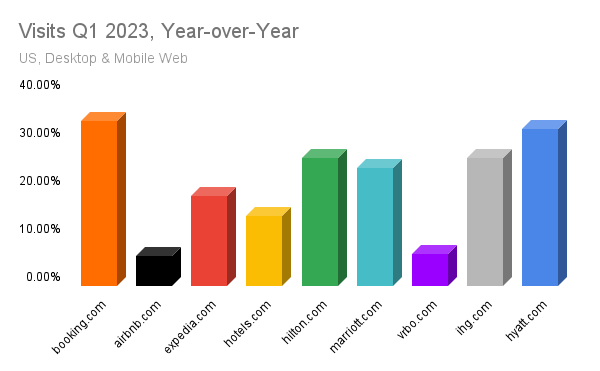
You can see the relative performance of the peer group in March 2023 on a year-over-year basis below. The entire group is seeing strong demand, with the 2022 revenge travel trend seemingly continuing unabated in the first three months of 2023. One trend that stands out includes a decided underperformance by vacation rental sites versus hotels and OTAs.
You can see the fastest growth was at Booking.com (+34%), Hyatt (+33%), IHG (+27%) Hilton (+27%) and Marriott (+25%) Expedia (+19%), Hotels.com (+15%). Airbnb (+6%) and Vrbo (+7%) lagged the group performance.
What’s driving the underperformance of vacation rentals versus hotels and OTAs? It could be a couple of things. First, vacation rentals were significantly aided by health concerns during the pandemic, when travelers chose to increasingly book sites that didn’t require them to be around other travelers. With concerns over COVID lessened post-vaccine, this trend seems to have reversed. Secondly, the hassle factor involved in vacation rental (added fees, need to clean up after yourself, numerous restrictions), seems to have made the experience less compelling for many travelers. It’s also possible that vacation rental landlords have raised prices too aggressively or not properly responded to changing market conditions with reduced pricing.
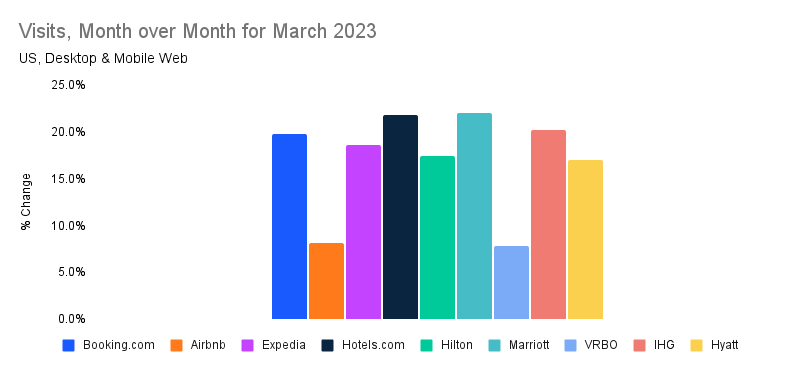
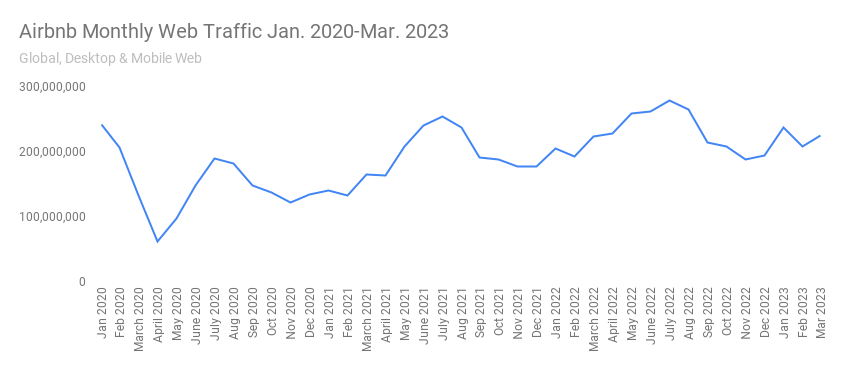
Monthly web traffic shows an accelerating story
Airbnb and Vrbo both grew in March versus February, unsurprisingly, since the entire group saw growth, but they again underperformed their peers. They both grew just 8% versus February, while Marriott and Hotels.com led in monthly growth at 22%, followed by IHG and Booking (+20%), Expedia (+19%), and Hilton and Hyatt (+17%).
Airbnb and Vrbo lost their share of traffic versus peers, with Booking up the most
Share of traffic is an important indicator of how the companies are performing against each other, and you can see Airbnb and Vrbo losing ground versus peers while Booking gained the most. By growing relatively slower than the rest of its peers in March, Expedia also 70 basis points of share of traffic. Airbnb lost 2.4 percentage points versus peers, and Vrbo lost one percentage point. Booking.com gained 2.5 percentage points of traffic to lead all gainers.

Globally, Airbnb did slightly better in Q1
Looking across all of Airbnb’s major domain names, the company saw Q1 web traffic rise by 8%, slightly better than the 6% performance the company saw in the US. However, that growth is still weaker than most peers saw for the quarter.
The overall share of traffic shows Expedia leading, followed by Airbnb in the US
Looking at the overall share of traffic in this peer group, pictured below, you can see that Expedia and Airbnb are the share leaders, even though they are losing some share of traffic versus peers. Expedia’s web traffic in March 2023 represented 22% of the peer group, followed by Airbnb at 19%, and Booking at 18%. You can see the group represented in the pie chart below.

Publicly traded companies mentioned in this report include Airbnb, Inc. (NASDAQ:ABNB), Booking Holdings Inc. (NASDAQ:BKNG), Expedia Group, Inc. (NASDAQ:EXPE), Hilton Worldwide Holdings Inc. (NYSE: HLT), Hyatt Hotels Corp. (NYSE:H), InterContinental Hotels Group (NYSE:IHG), and Marriott International, Inc. (NASDAQ:MAR).
The Similarweb Insights & Communications team is available to pull additional or updated data on request for the news media (journalists are invited to write to press@similarweb.com). When citing our data, please reference Similarweb as the source and link back to the most relevant blog post or similarweb.com/blog/insights/.
Contact: For more information, please write to press@similarweb.com.
Citation: Please refer to Similarweb as a digital intelligence platform. If online, please link back to www.similarweb.com or the most relevant blog post.
Report By: Jim Corridore, Senior Insights Manager
Disclaimer: All names, brands, trademarks, and registered trademarks are the property of their respective owners. The data, reports, and other materials provided or made available by Similarweb consist of or include estimated metrics and digital insights generated by Similarweb using its proprietary algorithms, based on information collected by Similarweb from multiple sources using its advanced data methodologies. Similarweb shall not be responsible for the accuracy of such data, reports, and materials and shall have no liability for any decision by any third party based in whole or in part on such data, reports, and materials.

Related Posts


Japan Rail Pass Tops Digital 100 Ranking of Fastest Growing Travel and Tourism Sites


Wondering what Similarweb can do for your business?
Give it a try or talk to our insights team — don’t worry, it’s free!