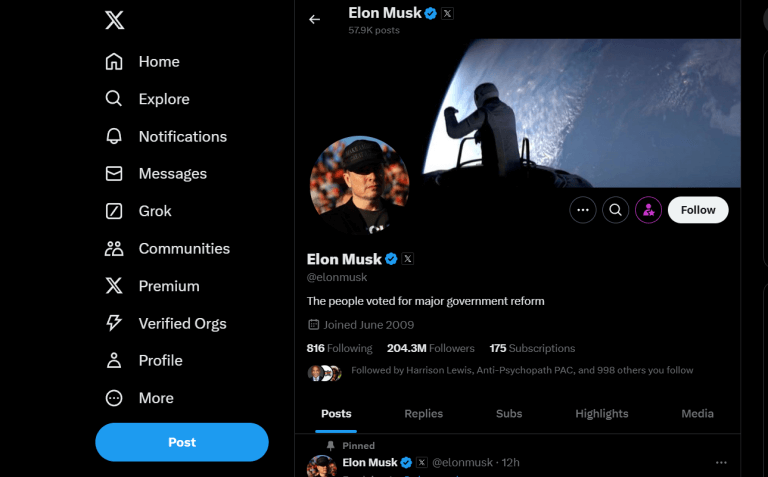
Twitter Becomes “X” as Threads Fades

Twitter.com traffic was down 10% in the latest week; Threads app users were down 60% from the launch
It may be too early to say whether Twitter’s recent rebranding as “X” will hurt the company’s traction with its audience or advertisers – but it’s not helping. The rebranding of Twitter to “X” is incomplete, with twitter.com remaining the primary web domain and the mobile app unchanged, so forgive us if we refer to this social media property as Twitter for the rest of this report.
Meanwhile, enthusiasm seems to have dimmed among those who saw the Threads app as a Twitter replacement. While the status of Threads as a spin-off of Instagram gave the new Meta Platforms social network a huge boost, active users have dropped by 60% from launch week.
Key takeaways
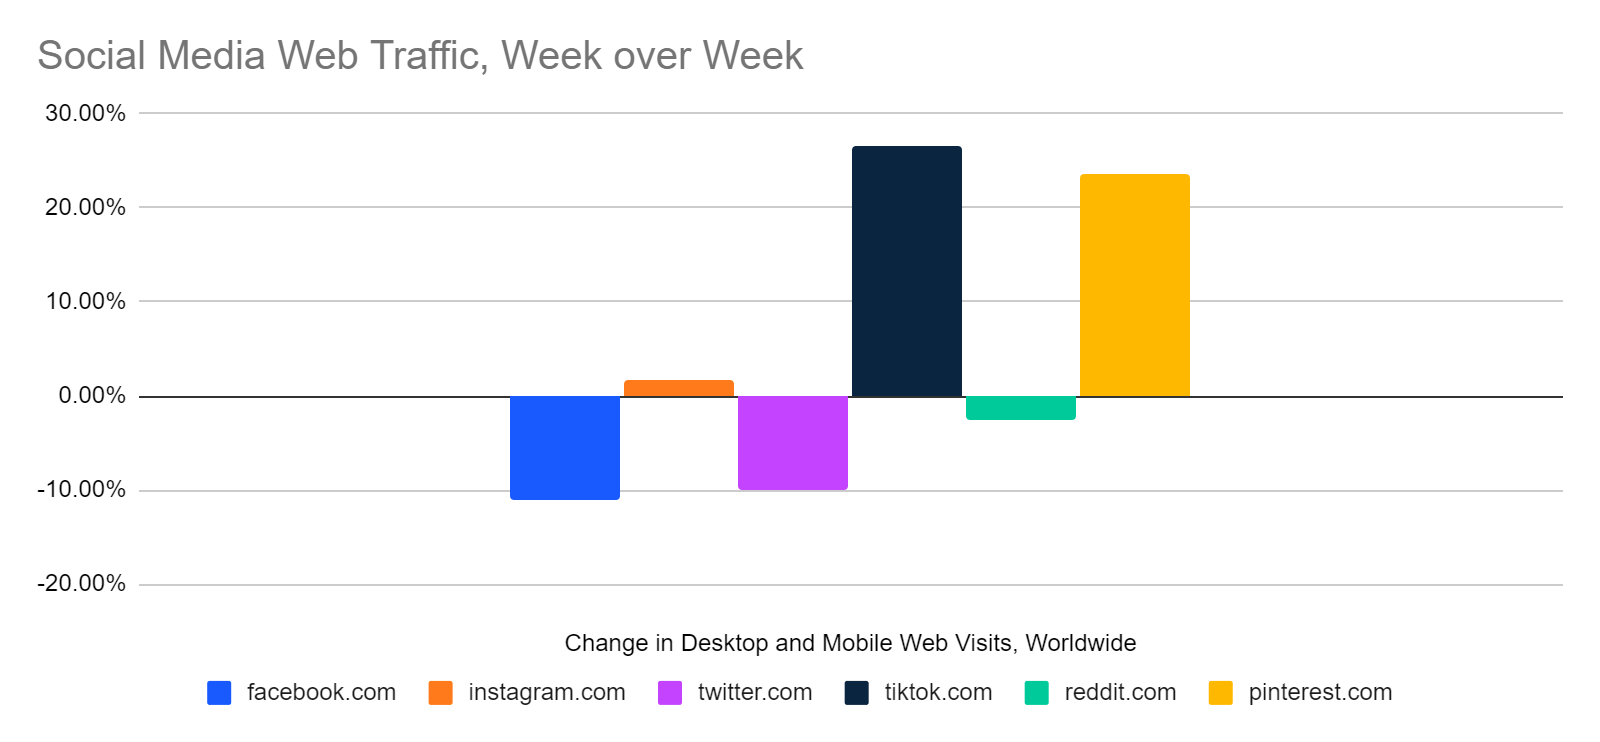
- Based on the last week’s worth of data, through July 23, traffic to twitter.com is down 10% from the previous week and 9.4% from the same days last year. This is probably more a factor of a long-term decline than the rebranding per se. App usage didn’t see the same week-over-week drop.
- In June, usage of the Twitter mobile apps was down 8.4% year-over-year, based on combined iOS and Android monthly active users in the US. However, usage of competing social media apps was also down, including for some of the largest like Instagram (-10.8%), Snapchat (-8%), and TikTok (-6%).
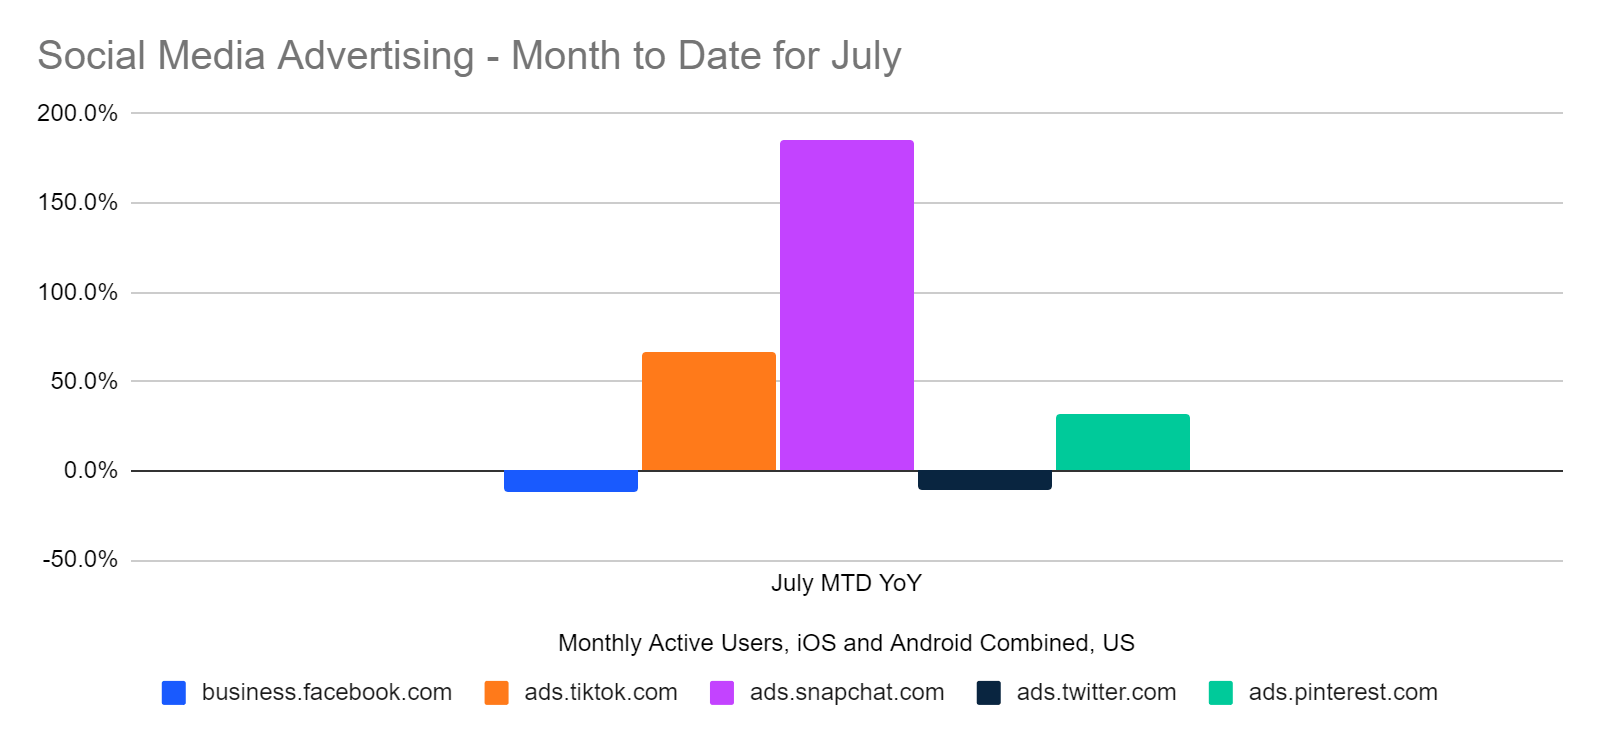
- Month-to-date traffic to the Twitter ad portal, ads.twitter.com, was down 10.4%, reflecting a long-term slide in advertiser engagement. Meta’s ads portal, business.facebook.com, was down 11.6%, again reflecting a long-term trend, while ads.snapchat.com was up 185.8%, ads.tiktok.com traffic was up 66.4%, and ads.pinterest.com was up 32.3%.
- Threads usage peaked immediately after its launch, on July 7, with more than 49 million daily active users on Android alone. That’s more than a third of Twitter’s audience on that platform. However, by July 23, that had fallen to 12.6 million daily active users, or about 12% of Twitter’s audience.
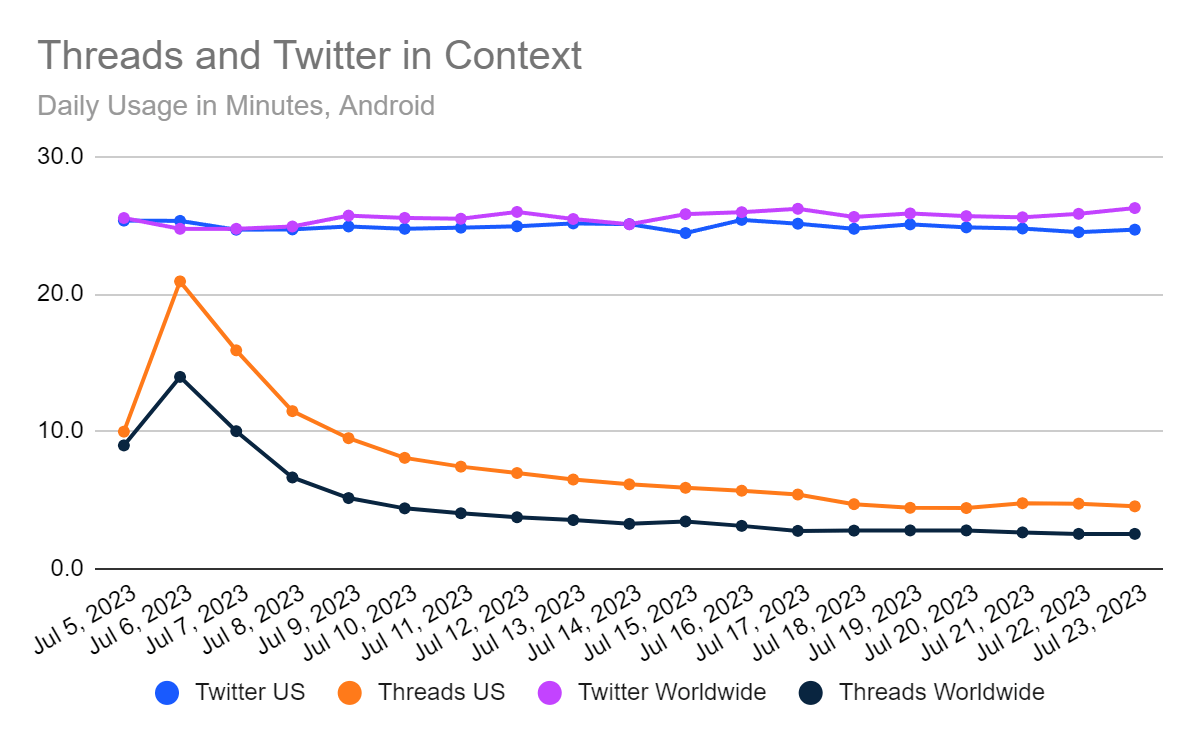
- The average amount of time active Threads users spent on the app also dropped. US Android users spent nearly 21 minutes per day on the app immediately after launch, but over the past week, they’ve spent less than 5 minutes per day with it. In contrast, Twitter users consistently engaged with the app for about 25 minutes per day.
Snapshot of web traffic shows a decline for Twitter
A one-week change in traffic may not be significant in the long run, but the chart below is consistent with what we’ve been showing for months in terms of declines for both twitter.com and facebook.com.
Social media advertising remains on a downward trend for Twitter and Meta/Facebook
As we have been reporting month after month, the ad and business portals for both Twitter and Meta/Facebook have seen eroding traffic, while competitors like Snapchat, TikTok, and sometimes Pinterest have been gaining. The update shown below is based on month-to-date traffic through July 23, compared with the same days in 2022. We track traffic to these portals as a leading indicator of advertiser interest.
Threads made a big dent in the social media market before fading
Threads was briefly bigger than Reddit, as measured by daily active users of its official app for Android, before falling into last place among the major social networks we track. We don’t yet have daily numbers for iOS, but we suspect the boom-and-bust pattern is similar. Threads took off like a rocket, with its close linkage to Instagram as the booster. However, the developers of Threads will need to fill in missing features and add some new and unique ones if they want to make checking the app a daily habit for users.
Time spent using Threads has fallen dramatically
Measured by time spent using the app, Threads came close to Twitter levels of engagement at launch, particularly in the US. Usage has since fallen significantly, both in the US and worldwide.
So far, Twitter (or X) seems to be struggling, but Threads is in the very early stages of mounting a challenge to it.
The Similarweb Insights & Communications team is available to pull additional or updated data on request for the news media (journalists are invited to write to press@similarweb.com). When citing our data, please reference Similarweb as the source and link back to the most relevant blog post or similarweb.com/blog/insights/.
Contact: For more information, please write to press@similarweb.com.
Disclaimer: All names, brands, trademarks, and registered trademarks are the property of their respective owners. The data, reports, and other materials provided or made available by Similarweb consist of or include estimated metrics and digital insights generated by Similarweb using its proprietary algorithms, based on information collected by Similarweb from multiple sources using its advanced data methodologies. Similarweb shall not be responsible for the accuracy of such data, reports, and materials and shall have no liability for any decision by any third party based in whole or in part on such data, reports, and materials.
Wondering what Similarweb can do for your business?
Give it a try or talk to our insights team — don’t worry, it’s free!
