House of the Dragon, Rings of Power and How Exclusives Drive Streaming Sign-ups

The near-simultaneous launches of two streaming network fantasy shows, HBO Max’s House of the Dragon and Amazon Prime’s Rings of Power, showcase the power of exclusive programming to drive new member sign-ups – with House of the Dragon performing better.
Key takeaways
- In the U.S., as House of the Dragon launched in August traffic to the HBO Max signup page was up more than 60% year over year and more than 40% compared with July.
- Customer journey analysis shows that about 3% of U.S. desktop web visitors to the House of the Dragon landing page clicked through to the HBO Max signup page. And 3.6% of new members signing up proceeded directly to watch the show on their computer (with more presumably watching it on a smart TV).
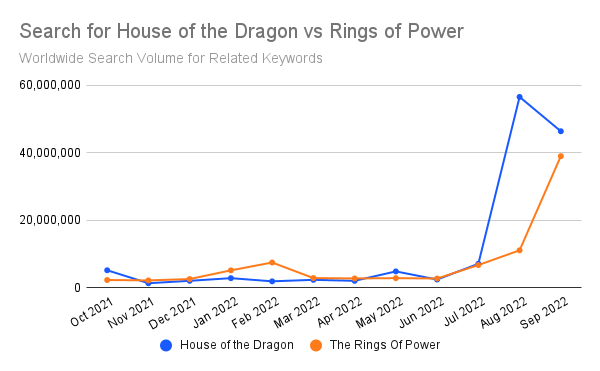
- While Amazon has reportedly invested a much bigger production budget in Rings of Power, search volume shows House of the Dragon is generating significantly more popular interest.
- When sign-ups for any streaming service show a monthly spike, there is often an exclusive offer associated with it – for example, a November 2021 South Park special more than doubled that month’s Paramount Plus sign-ups compared with the previous month.
Search winner: House of the Dragon
Search volume is an excellent indicator of popular interest, and search volume on House of the Dragon (and related terms) rose dramatically from the pre-launch buzz of recent months to August, when the program became available to stream. The peak volume of searches Rings of Power generated in September was about 45% lower.
This analysis was created by Domenico Mansi, a Similarweb Solution Engineer who often produces this sort of analysis to help prospective customers understand how they can use the data. This particular research was motivated more by his personal interest as someone watching both programs.
Both House of the Dragon and Rings of Power are spinoffs, Mansi notes – prequels to Game of Thrones and The Lord of the Rings, respectively. It might be that Game of Thrones is more popular as a media property – although the search volume on keywords related to the two (covering both the books and TV/video versions) is about even. The record $100 million promotional campaign HBO employed to boost the program must also have made a difference, he says.
Mansi also found it interesting that he could look back through the history of when sign-ups have surged for different streamers and find a corresponding exclusive program that explained it, as in the South Park example for Paramount Plus.
Netflix still leads but HBO Max surged in August
Netflix is still the streaming platform with the highest number of monthly sign-ups in the U.S., but it is not growing as fast as other newer streaming platforms. In August, Netflix sign-up traffic was down nearly 9% compared with July, while HBO Max sign-ups were up more than 40%.

Amazon Prime Video is not shown on the chart above, as it’s part of the broader Amazon Prime bundle of services. However, based on search volume alone, we suspect Rings of Power didn’t match House of the Dragon for driving new sign-ups.
Apps Data Favors HBO Max Over Amazon Prime Video
One way we can see a more direct comparison between the engagement generated by the two fantasy series is by looking at engagement data for the HBO Max versus Amazon Prime Video mobile apps. As with the search data, HBO Max comes out the winner.
While you might not think people would watch epic fantasy on their phones, it looks like some do – in August, HBO Max’s Android app saw an 8% month-over-month increase in daily active users, according to Similarweb estimates. Amazon Prime video saw an increase in September, but it was just 2.3%.
Updated October 6, 2022, to include September numbers.
The Similarweb Insights & Communications team is available to pull additional or updated data on request for the news media (journalists are invited to write to press@similarwb.com). When citing our data, please reference Similarweb as the source and link back to the most relevant blog post or similarweb.com/blog/insights/.
Disclaimer: All data, reports, and other materials provided or made available by Similarweb are based on data obtained from third parties, including estimations and extrapolations based on such data. Similarweb shall not be responsible for the accuracy of the materials and shall have no liability for any decision by any third party based in whole or in part on the materials.
Image by Ivory MacIntyre from Pixabay

Related Posts


Similarweb Traffic League: Who Was the Most Popular Football Club in April 2024?

NCAA’s Women’s Basketball Stars Eclipsing Men’s Ahead of March Madness

A Super Bowl with a Difference: Swifties Flock to This Year’s Event

Wondering what Similarweb can do for your business?
Give it a try or talk to our insights team — don’t worry, it’s free!