Australia’s Fashion Market: Small Players, Big Wins

Key Takeaways:
- Australia’s fashion ecommerce is resilient, with a 5.61% year-over-year (YoY) traffic growth and 149 million visits in H1 2024, indicating a promising future for retailers and brands
- Search engines drive 66% of traffic, with 39% from organic search, making SEO crucial for ecommerce success
- With 77% of traffic from mobile devices, brands are prioritizing improving mobile user experience to compete better
In this article, we highlight key insights from our analysts, including the major players and strategies driving impressive market growth. These findings are based on data from the Similarweb platform.
Australian fashion market size and growth path
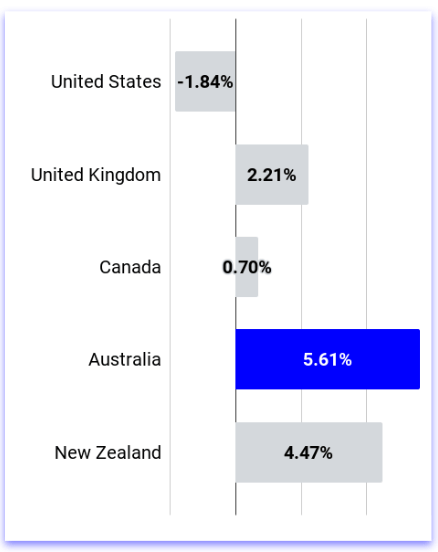
Unlike other key markets, Australia (and New Zealand) are seeing significant traffic growth at 5.61% and 4.47%, respectively.
H1 2024 Traffic Engagement in Fashion, Apparel & Accessories Ecommerce
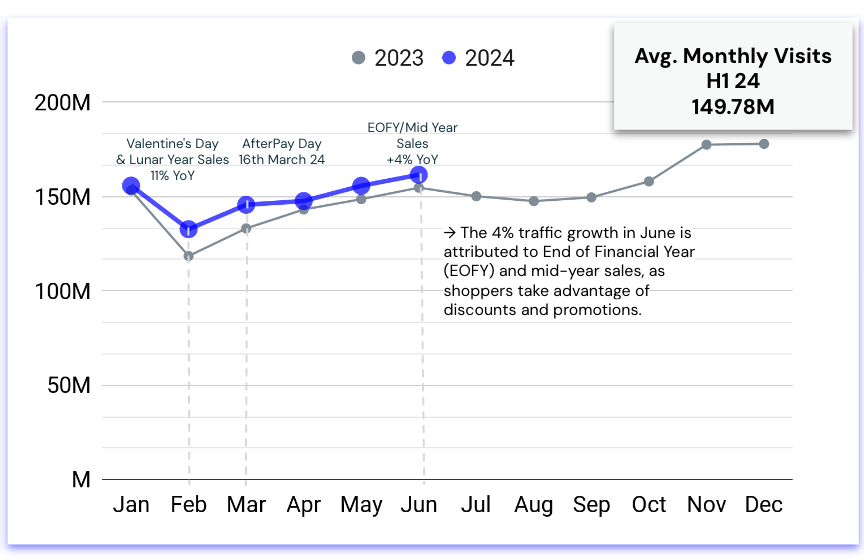
The average monthly visits for the Australian Fashion Ecommerce industry during the first half of 2024 was 149.78M. Valentine’s Day and end-of-year sales saw 11% YoY growth at slightly over 150M. Similarly, the 4% traffic growth in June (to 153M) is attributed to End of Financial Year (EOFY) and mid-year sales, as shoppers take advantage of discounts and promotions.
H1 Total Monthly Visits (2024 vs. 2023), Australia Fashion, Apparel & Accessories Ecommerce
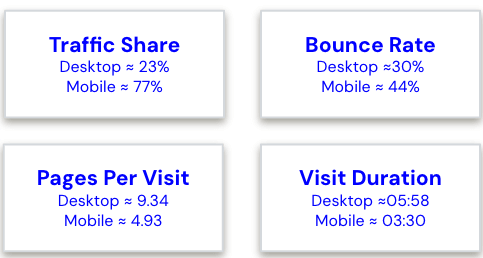
When looking at key engagement metrics, we see that the high numbers are not just traffic but also on-page engagement. Given the high traffic share from mobile devices (77%), retailers should prioritize improving mobile site speed, navigation, and overall user experience to reduce bounce rates and increase engagement.
Similarly, desktop users show higher engagement levels, as evidenced by lower bounce rates, higher pages per visit, and longer visit durations compared to mobile traffic. This suggests that the desktop experience is more conducive to in-depth browsing and interaction.
H1 2024 YoY Traffic Growth in Fashion, Apparel & Accessories Category
Australian fashion market analysis: Leaders vs. rising players
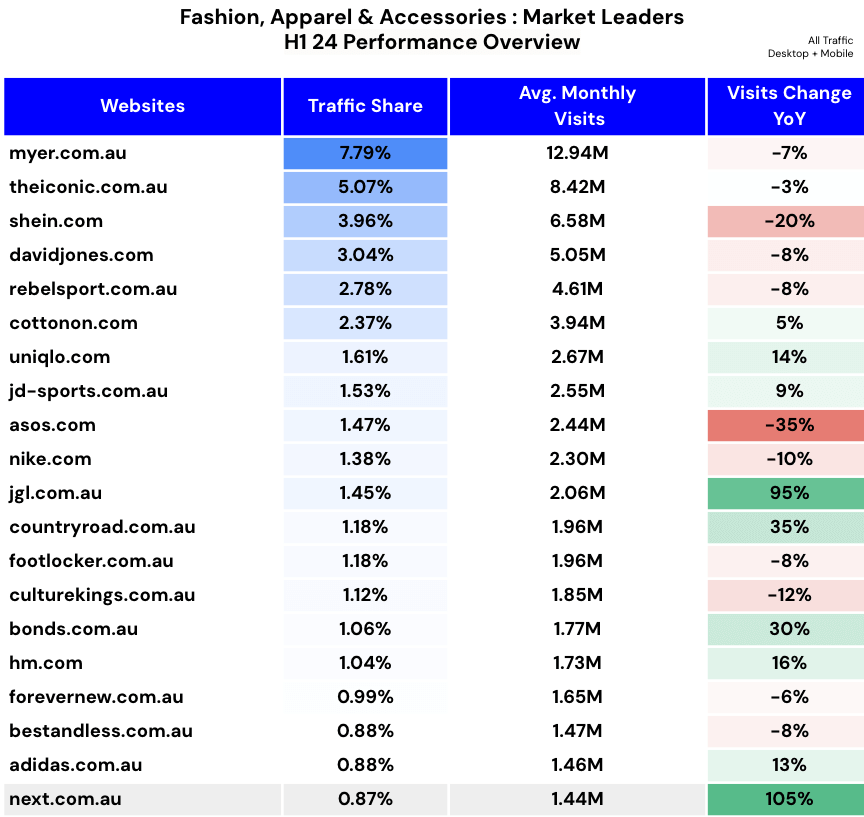
The competitive landscape is evolving as market leaders see declines in traffic, Shein web traffic is down 20% (notching on average 6.5M visits a month), and Asos traffic is down 35%, YoY. In contrast, next.com.au is leading in online growth with a 105% increase in visits YoY (with 1.4M average monthly visits), and jgl.com.au is up by 95% – both gaining strong traction among shoppers.
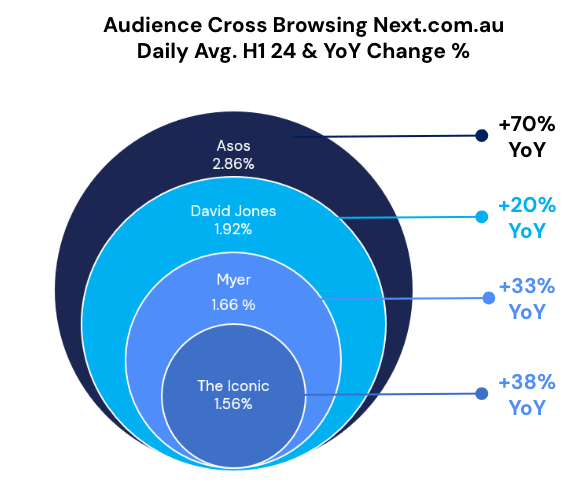
Growing cross-browsing rates between next.com.au and other market leaders like Asos (2.86%), David Jones (1.92%), Myer (1.66%), and The Iconic (1.56%) indicate strong consumer interest and brand overlap among key players.
Next.com.au’s robust growth in audience and market share is driven by two main factors:
- Effective SEO strategy: 98% YoY increase in organic traffic. The website targets keywords related to popular brands like French Connection, Ted Baker, Calvin Klein, and U.S. Polo.
- Smart paid media investments: Significant investments in display ads, paid search, referrals, and social media. PPC spend saw a 238% increase in paid search spend in H1 2024.
Australian consumers look to prioritize comfort over style
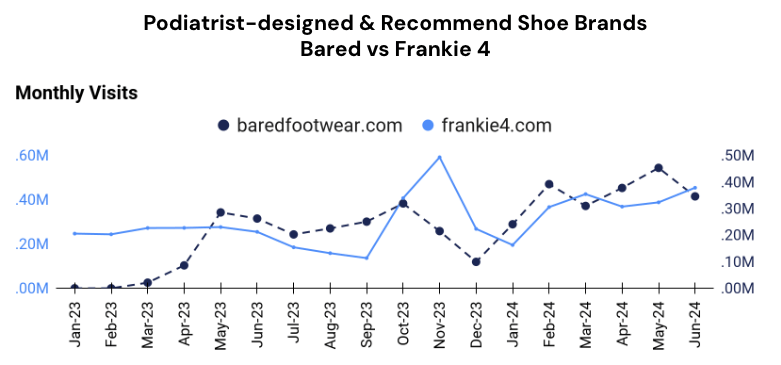
Podiatrists’ recommended footwear brand Bared saw 223% growth, outpacing rival Frankie4, capitalizing on the growing demand for comfortable yet stylish shoes.
Both shoe brands – baredfootwear.com and frankie4.com – prioritize comfort and foot health in their designs. Searches for podiatrist-recommended shoes grew by 14% YoY in H1 2024.
Bared Footwear emphasizes their “biomechanical footbed and hidden support features” in every pair, as seen on their homepage. Similarly, Frankie4 was founded by a podiatrist and incorporates “podiatrist-designed support” and “innovative technology” into their shoes.
As a result, monthly visits have been on a consistent growth trajectory:
Luxury and designer clothes charge ahead led by a surge in D2C
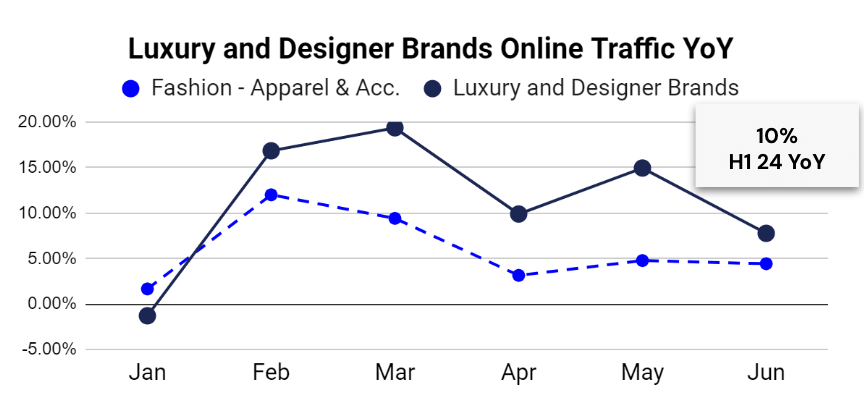
Luxury and designer brands outperformed the Australian fashion and apparel category average with 10% YoY traffic growth in H1, led by women’s footwear retailers Jo Mercer and Steve Madden. Direct-to-consumer (D2C) stores like Hugo Boss, Coach, Oroton, Tommy Hilfiger, and Chanel also continued to gain traction with customers, signaling a strategic shift in the luxury retail sector.
This consumer trend remained strong from February to May, but the gap closed significantly in June, with both segments around 5% traffic growth, which could imply that the overall category is fighting back to recapture lost market share.
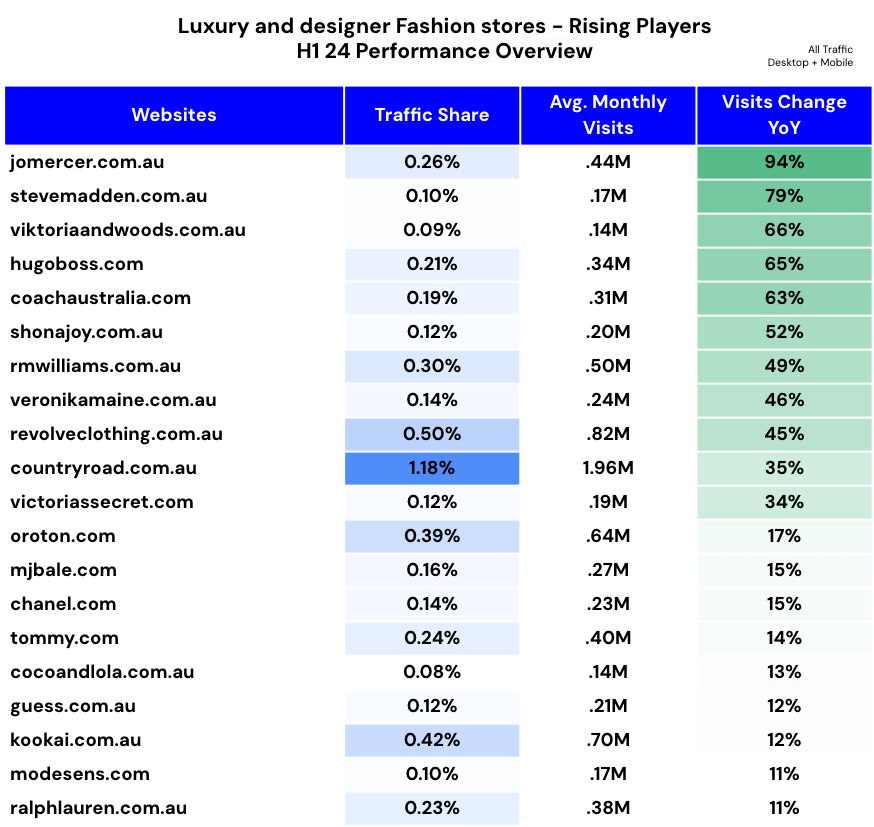
Fashion, Apparel & Accessories: Luxury and Designer Fashion Stores H1 2024 Performance Overview
When zooming in on the luxury and designer fashion stores, we can see that the top 5 fastest-growing players in H1 were:
- Jomercer.com.au stats:
- Market share: 0.26%
- Web visits: 0.44M
- Visits Change YoY: 94%
- Stevemadden.com.au stats:
- Market share: 0.10%
- Web visits: 0.17M
- Visits Change YoY: 79%
- Viktoriaandwoods.com.au stats:
- Market share: 0.09%
- Web visits: 0.14M
- Visits Change YoY: 66%
- Hugoboss.com stats:
- Market share: 0.21%
- Web visits: 0.34M
- Visits Change YoY: 65%
- Coachaustralia.com stats:
- Market share: 0.19%
- Web visits: 0.31M
- Visits Change YoY: 63%
As all of these rising players capture less than 1% of the market share, it indicates that smaller fashion retailers are growing and taking more market share from traditional players in the fashion space.
The power of search in fashion
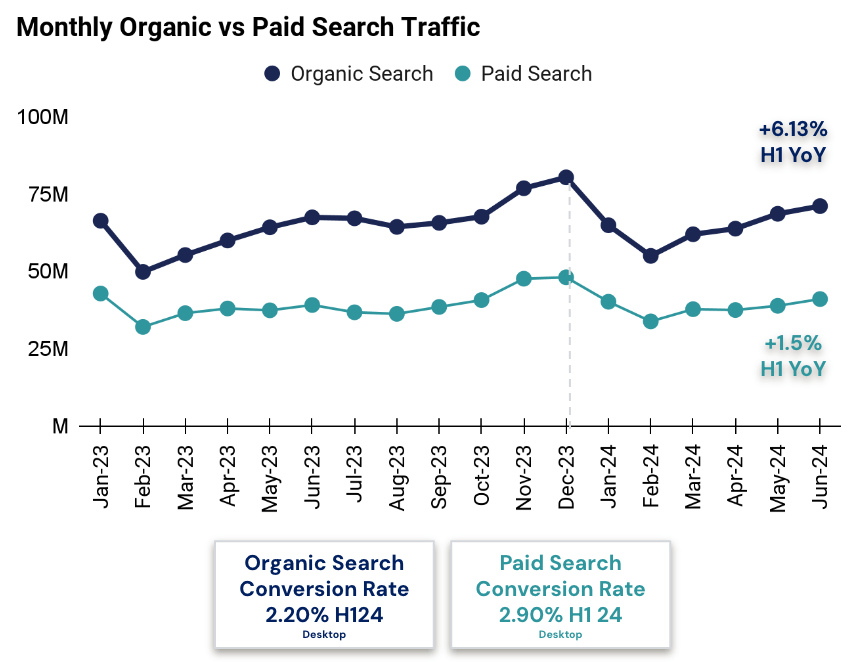
Now, let’s look at the top traffic-driving channels in the market. Search as a whole leads, contributing 66% of traffic to fashion and apparel ecommerce sites. Organic search accounts for 39%, while paid search, at 22.7%, nearly matches direct traffic (26.7%), underscoring the long-term value of paid strategies in enhancing brand recognition, organic traffic, and direct visits.
Fashion, Apparel & Accessories: Traffic Acquisition by Marketing Channels H1 2024 Performance Overview
Paid search traffic grew by 1.47%. This modest growth suggests steady performance in paid search campaigns and growing investment in SEO and display channels, with display emerging as the fastest-growing channel for traffic acquisition.
Comparing the two at the acquisition level, we see that organic search has a conversion rate of 2.20% in H1 2024 on desktop, while paid search has a conversion rate of 2.90%. This indicates that both channels are equally important traffic sources for new customers.
Fashion, Apparel & Accessories: Organic vs. Paid Search H1 2024 Performance Overview
That’s a wrap… but there’s more
These insights are just a few of the ones in our comprehensive report on the Australian fashion market.
Download the full report for in-depth analysis, including search trends and consumer insights on the Australian fashion ecommerce market in the first half of 2024.
The Similarweb Insights & Communications team is available to pull additional or updated data on request for the news media (journalists are invited to write to press@similarweb.com). When citing our data, please reference Similarweb as the source and link back to the most relevant blog post or similarweb.com/blog/insights/.
Disclaimer: All names, brands, trademarks, and registered trademarks are the property of their respective owners. The data, reports, and other materials provided or made available by Similarweb consist of or include estimated metrics and digital insights generated by Similarweb using its proprietary algorithms, based on information collected by Similarweb from multiple sources using its advanced data methodologies. Similarweb shall not be responsible for the accuracy of such data, reports, and materials and shall have no liability for any decision by any third party based in whole or in part on such data, reports, and materials.
Photo by Clem Onojeghuo on Unsplash
Wondering what Similarweb can do for your business?
Give it a try or talk to our insights team — don’t worry, it’s free!
