Cruises Reentering Stormy Waters?

Web traffic growth has decelerated and purchases have weakened over past two months
Website traffic to leading cruise lines has shown marked improvement over the past three years. Customer engagement metrics (time spent on cruise providers’ websites, number of pages viewed per user, etc.) are also recovering. However, the pace of growth is slowing, and purchase trends have weakened over the past two months.
Key takeaways
- From the pandemic low in October 2020, web traffic to top cruise lines increased 321% in May 2022, according to Similarweb estimates
- May 2022 rose 119% year-over-year and was up 5.7% over April 2022; however, growth has been uneven, up only 1.8% in April after a 30.7% increase in February
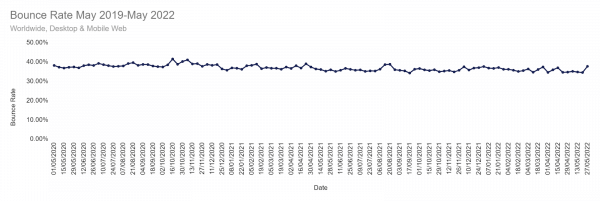
- Customer engagement has strengthened, with session duration (time spent on site), pages per visit, and bounce rate (percentage of visitors that leave after viewing only one page) all seeing modest improvement over the past year
- Rising engagement suggests that visitors to the site have a greater intent to plan a cruise
- However, conversion data (the number of website visits that results in a purchase) shows a drop in converted visits in May 2022, which may be a warning sign for the industry
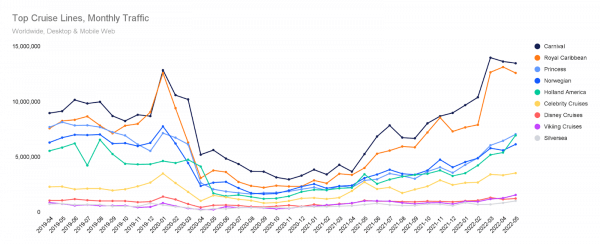
Cruise Industry Seeing Strong Web Traffic Recovery But Growth Uneven
Based on Similarweb web traffic data, demand for the cruise industry seems to have recovered. From a COVID low in October 2022, worldwide monthly traffic to top cruise lines was 321% higher in May 2022. The month of May also saw year-over-year growth of 119% and month-over-month growth of 5.7% versus April 2022. The chart below shows monthly web traffic to leading cruise lines from April 2019 through May 2022; the chart shows the pandemic dip and slow recovery that has now approached pre-pandemic levels.
Notably, month-over-month growth, while largely trending upward, has been uneven. May was up 5.7%, April 1.8%, February 30.7%, yet January was down 10.4%.
Risks Abound for Cruise Industry
Many potential cruise customers are still concerned about the safety of cruises, given past quarantines and mass COVID outbreaks on board cruise ships at the onset of the pandemic. Spikes in Delta and Omicron variants halted momentum in the industry last year when it looked set to recover.
It looks like consumer interest in cruises is improving overall. That said, inflation and economic risks, coupled with continued worries about safety and the addition of geopolitical concerns like the war in Ukraine, could keep the industry from full recovery for some time.
One important piece of the puzzle is pricing, which has not recovered at the same rate as web traffic. At a recent cruise industry conference in May 2022, Derek Lloyd, VP of sales at Norwegian Cruise Line said “we’re seeing great bookings for 23/24. And then we are seeing a lot close-in. The middle for us is where we are having a bit of a challenge.”
In addition, high oil prices and wages and other inflation are combined to drive input costs higher for the industry. Also, many cruise lines took on substantial amounts of debt to survive the pandemic industry-wide shutdown, and are ill-equipped to service that debt at current levels of industry revenues. It remains to be seen how this will all shake out, but it’s clear that the industry continues to face many stark challenges.
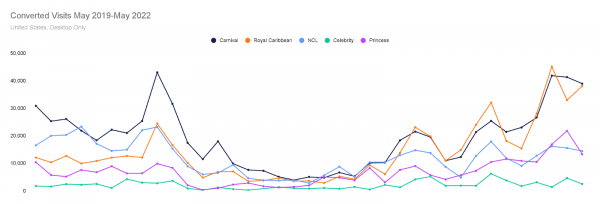
Weakening U.S. Conversion Data Could be a Cause for Concern
Similarweb data on conversion trends in the U.S. could be a warning sign. After strengthening sharply for the first three months of 2022, conversion trends decelerated in May 2022. Given economic conditions and inflation pressures, this could be a sign that consumers are not following through on booking cruises, despite their apparent interest (based on engagement metrics). After rising 50% in March and 35% in February, April conversion declined 4% and May weakened a further 8%, month-over-month. This decline could also be due to the recent flare-ups of COVID in different regions, prompting potential customers to rethink plans. With the U.S. comprising about 81% of total web traffic to leading cruise line websites, U.S. data on conversion is a good proxy for the overall industry. See the chart below.
Engagement Metrics Look Stronger
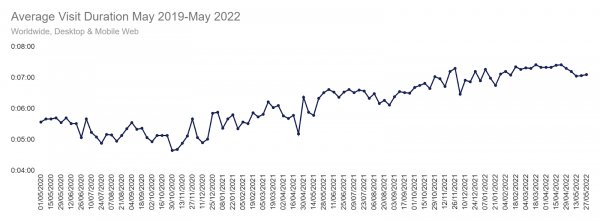
A look at customer engagement metrics including visit duration, pages per visit and bounce rates over the past two years shows that trends are improving. This is a positive sign, as you would expect increased customer engagement if demand was improving. Overall, improved engagement along with rising web traffic is a good sign for the industry. If people are looking at more pages per visit and spending more time on a website, it’s usually a sign of heightened intent to make a purchase.
First, here is a look at visit duration over the past two years, which has risen for both desktop and mobile web over time relatively steadily.
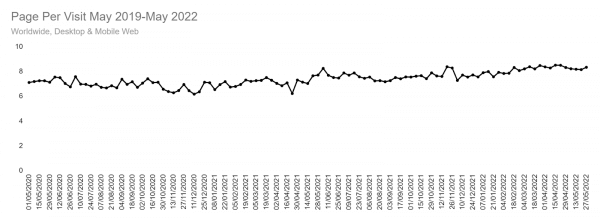
Pages per visit have risen to an average of 7.5 in May 2022 from a low of 6.5 in December 2020.
The bounce rate looks relatively stable over time
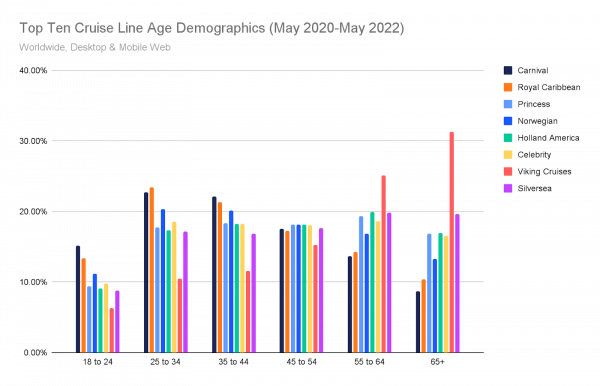
Not All Cruise Lines Created Equal
A look at Similarweb data on audience demographics shows that cruise lines Viking and Silversea skew significantly older, while Carnival and Royal Caribbean attract a younger audience. This is largely due to the luxurious nature of the former, and the more affordability of the latter.
Demand for all cruises is not equal, and with the economy seemingly headed toward recession, it seems plausible that younger, less affluent travelers may be quicker to cancel trips than older more affluent ones, potentially impacting cruise lines like Carnival and Royal Caribbean more deeply than those that skew older.
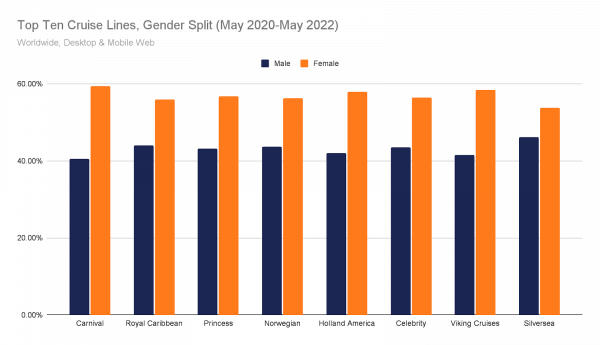
Gender distribution is largely equal across most cruise lines, with women taking the lead in website traffic across the board.
Conclusion
While traffic to leading cruise lines has strengthened and is approaching pre-pandemic levels, there are some signs of concern in decelerating growth and weakening conversion data. Customer engagement has improved over time, which is encouraging. However, risks abound, including inflation, the stock market decline, high oil prices, increased debt levels, and sporadic COVID spikes.
The Similarweb Insights Newsroom is available to pull additional or updated data on request for the news media (journalists are invited to write to press@similarweb.com). When citing our data, please reference Similarweb as the source and link back to the most relevant blog post or similarweb.com/blog/insights/.
Disclaimer: All data, reports and other materials provided or made available by Similarweb are based on data obtained from third parties, including estimations and extrapolations based on such data. Similarweb shall not be responsible for the accuracy of the materials and shall have no liability for any decision by any third party based in whole or in part on the materials.

Related Posts


Cruises: April 2023 Web Traffic Growth Decelerates to 9% from 52% in Q1

Cruises: “2023 Wave Season”: Q1 Rose 52%, With All Cruise Lines Seeing Growth

Cruises: “2023 Wave Season” Strengthens with February Web Traffic up 55% after 28% Increase in January

Cruises: “2023 Wave Season” Off to Strong Start With January Web Traffic up 28% and Conversions Up 55%

Wondering what Similarweb can do for your business?
Give it a try or talk to our insights team — don’t worry, it’s free!