Black Friday: US Ecommerce Traffic Down 7% from 2022

US consumers spent on travel, beauty, and big-box retail. Amazon gained as traffic dropped to other ecommerce players
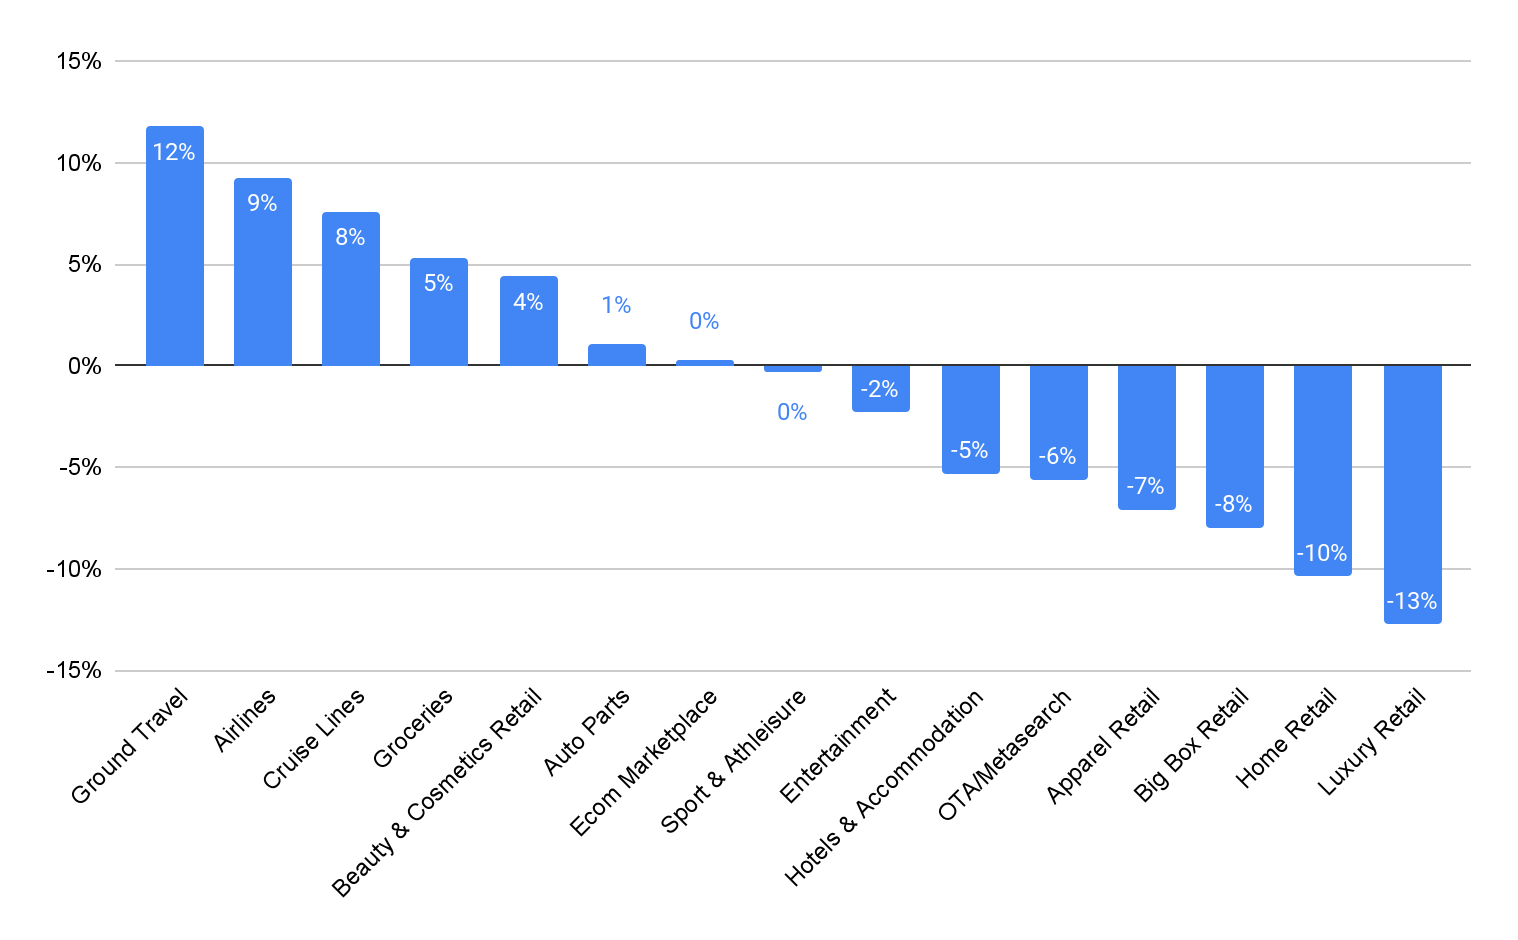
Similarweb’s traffic data to the top 716 ecommerce players on Black Friday shows a dampening in US consumer demand, as measured by traffic. On Black Friday, it seems that consumers prioritized travel (mainly transportation) over other large ticket items such as Home Furnishing or Luxury.
As an ecommerce event, Black Friday really extends from Thanksgiving (celebrated on Thursday Nov. 23 in the US) to Cyber Monday – sometimes referred to as the “Cyber 5” days of peak online shopping. This report focuses on the first two days for which we can share digital performance data, with updates to follow as the full picture comes into focus.
Top sectors in YoY Traffic change on Black Friday
US, Desktop & Mobile Web, November 24th 2023 vs November 25th 2022
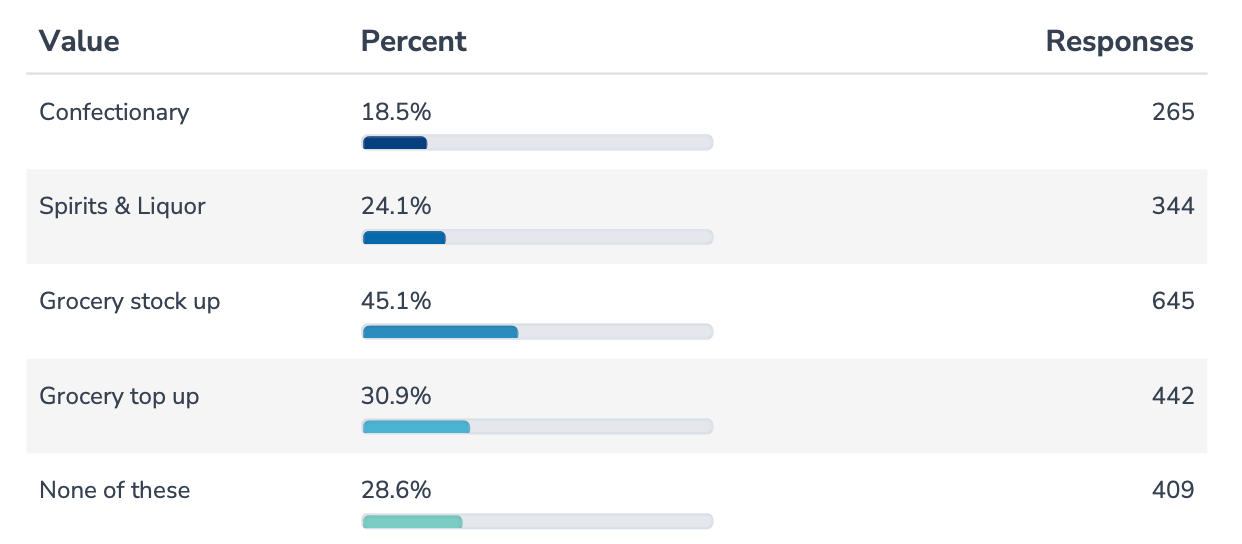
Traffic to grocery sites was also up 5% on Black Friday, indicating that Black Friday shoppers may have leveraged discounts to stock their pantries.
In fact, according to Similarweb’s Market Research Panel of 1,824 Survey respondents, 45% of consumers planning to buy groceries during Black Friday were doing so to stock up.
Top US eCommerce sites on Black Friday, in visits with Year-over-Year change
US, Desktop & Mobile Web, November 24th 2023
Many top retailers experienced sluggish growth or traffic, with consumer demand dampening:
- Amazon still managed to increase website traffic by over 2% YoY versus Black Friday last year, with mixed results across its key categories
- Fashion and apparel retailers overall experienced a larger decline: -16% for Macy’s, -18% for Kohls, -6% for Gap
Despite growing unique visitors on Black Friday by 91%, Temu did not make it to the top 15 players in visits
Top US Retailers in Unique Visitors on Black Friday, with YoY Change
US, Desktop & Mobile Web, November 24th 2023 vs November 5th 2022
Amazon was more successful than last year in the first two days of Cyber 5, except in the Clothing, Shoes, and Jewelry category
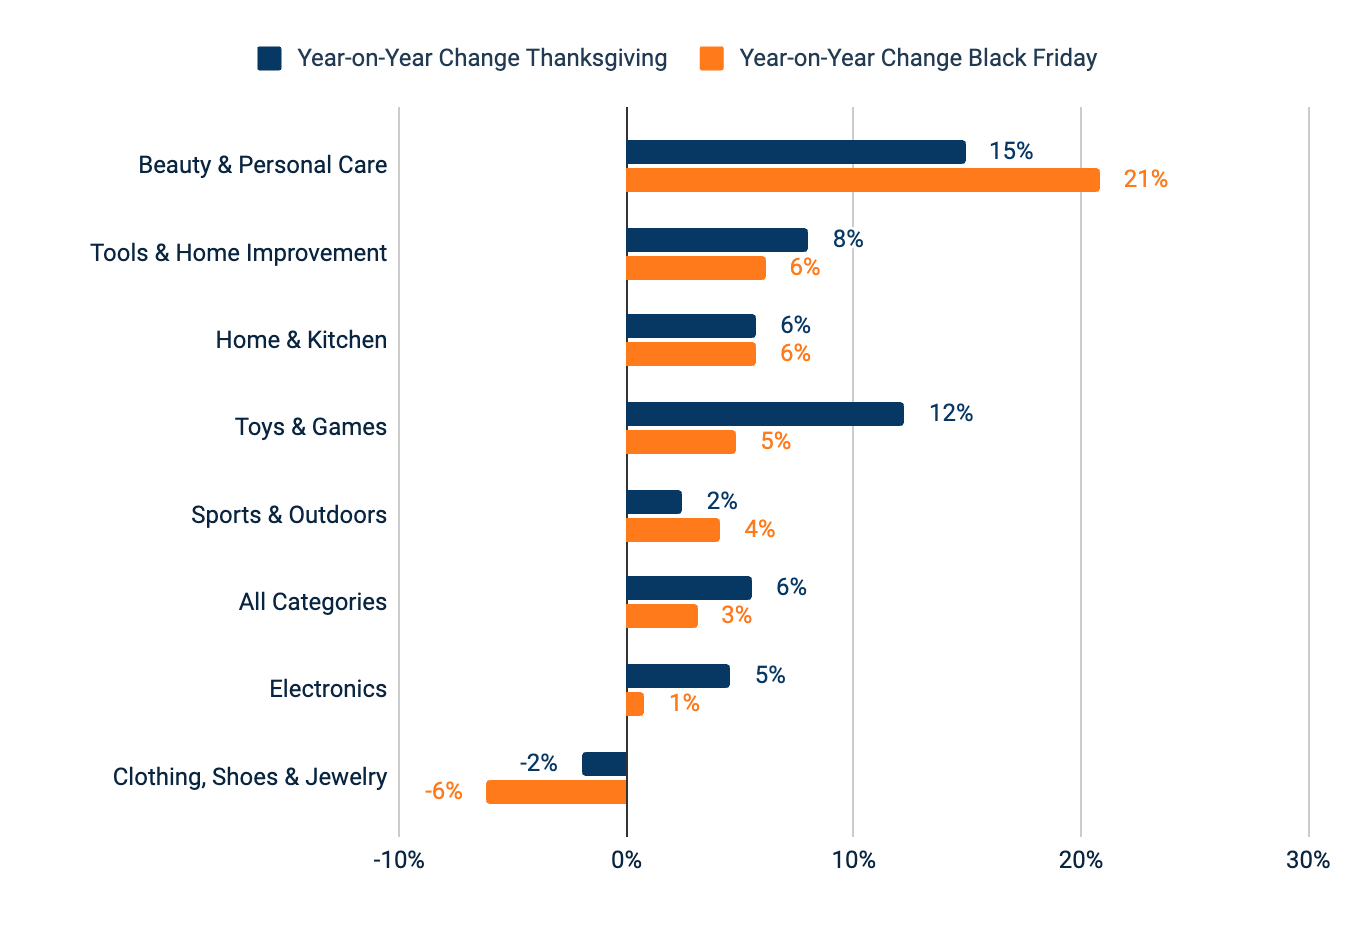
Amazon’s early Black Friday sales have surpassed expectations, with a surge in visits and impressive growth across several key categories. This year’s Black Friday saw a 6% year-on-year (YoY) increase in visits to the overall site on Thanksgiving, outpacing the growth on Black Friday itself (3% YoY). The peak in visits occurred around 10 pm on Thanksgiving, indicating that shoppers were eager to browse for deals after dinner. On Black Friday, the peak was reached around 3 pm.
Top categories on Thanksgiving and Black Friday in Product views, by Year-on-Year change in visits
US, Desktop, Mobile Web & Mobile App, November 23rd and 24th 2023 vs November
While the Toys and Games category experienced a surge in product views (12% YoY on Thanksgiving), indicating a strong appetite for holiday gifting deals, the Clothing, Shoes & Jewelry category saw a decline in demand on both days. This trend aligns with the broader observation of slowing global demand for fashion.
Beauty and Personal Care emerges as a top performer on Amazon
The Beauty and Personal Care category was a standout performer, with visits up 15% on Thanksgiving and 21% on Black Friday compared to last year. This surge in interest was reflected in strong sales of beauty best-sellers, which were discounted by up to 60%. Moreover, some of the top products were TikTok favorites, such as COSRX or Mighty Patch.
Apple Remains a Consumer’s Favorite
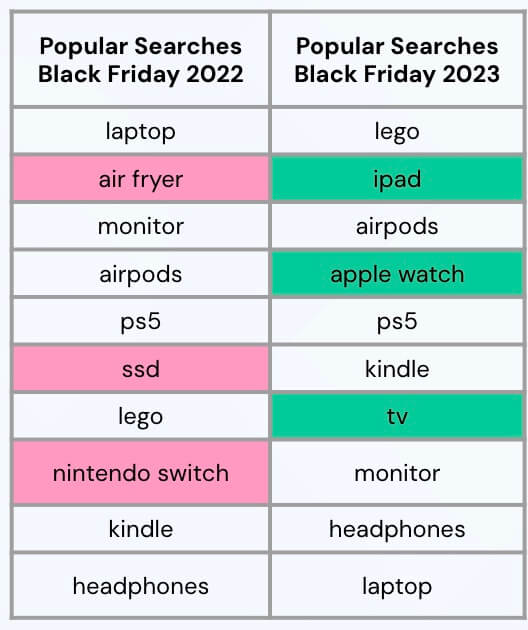
Apple’s dominance in the consumer electronics space was once again evident on Black Friday. The iPad. Apple Watch, and Airpods made it into the top 10 most searched products on Amazon, demonstrating their enduring popularity among shoppers.
No Barbie takeover in the Toys & Games category
Despite the success of the Barbie movie, it did not translate to a boost in sales of Barbie dolls, with none of Mattel’s dolls reaching the top 10. In fact, the top-selling Barbie product on Black Friday was the Barbie Dreamhouse, which came in at number 15. Overall, consumers were willing to spend more on toys and games this year, with the average selling price for the top 10 best-sellers being $27.32, up from $23.42 in 2022.
| Product name | Price | Best-seller rank |
| SHASHIBO Shape Shifting Box – Award-Winning, Patented Fidget Cube w/ 36 Rare Earth Magnets – Transforms Into Over 70 Shapes | $17.50 | 1 |
| Playskool Sit ‘n Spin Classic Spinning Activity Toy for Toddlers Ages Over 18 Months (Amazon Exclusive),Multicolor | $19.99 | 2 |
| Taco Cat Goat Cheese Pizza | $7.95 | 3 |
| Furby Purple, 15 Fashion Accessories, Interactive Plush Toys for 6 Year Old Girls & Boys & Up, Voice Activated Animatronic | $46.99 | 4 |
| TEMI Dinosaur Truck Toys for Kids 3-5 Years, Tyrannosaurus Transport Car Carrier Truck with 8 Dino Figures, Activity Play Mat, Dinosaur Eggs, Capture Jurassic Dinosaur Play Set for Boys and Girls | $23.98 | 5 |
| Ultra Rare Card Starter Bundle | 100+ Authentic Cards | 1x Ultra Rare Guaranteed | Legendary, VSTAR, VMAX, V, GX, or EX | Plus Bonus 10x Holo or Rare Cards | GG Deck Box Compatible with Pokemon Cards | $19.98 | 6 |
| Elf on the Shelf : A Christmas Tradition Blue-Eyed Boy Light Tone Scout Elf – Elf and book included. | $28.98 | 7 |
| Toniebox Audio Player Starter Set with Playtime Puppy – Listen, Learn, and Play with One Huggable Little Box – Pink | $69.99 | 8 |
| ORSEN LCD Writing Tablet Toddler Toys, 8.5 Inch Doodle Board Drawing Pad Gifts for Kids, Dinosaur Boy Toy Drawing Board Christmas Birthday Gift, Drawing Tablet for Boys Girls 2 3 4 5 6 Years Old-Green | $12.98 | 9 |
| NATIONAL GEOGRAPHIC Gross Science Kit – 45 Gross Science Experiments- Dissect a Brain, Make Glowing Slime Worms, Science Kit for Kids 8-12 | $24.89 | 10 |
Amazon’s strong performance during the early Black Friday period highlights its continued dominance in the e-commerce landscape. The company’s vast product selection, competitive pricing, and convenient shopping experience have made it a go-to destination for holiday shoppers. With more deals to come throughout the Cyber 5 week, Amazon is poised to further solidify its position as the leading e-commerce retailer.
Watch for additional updates as we continue to dig through the numbers.
The Similarweb Insights & Communications team is available to pull additional or updated data on request for the news media (journalists are invited to write to press@similarweb.com). When citing our data, please reference Similarweb as the source and link back to the most relevant blog post or similarweb.com/blog/insights/.
Disclaimer: All names, brands, trademarks, and registered trademarks are the property of their respective owners. The data, reports, and other materials provided or made available by Similarweb consist of or include estimated metrics and digital insights generated by Similarweb using its proprietary algorithms, based on information collected by Similarweb from multiple sources using its advanced data methodologies. Similarweb shall not be responsible for the accuracy of such data, reports, and materials and shall have no liability for any decision by any third party based in whole or in part on such data, reports, and materials.


