The 40 Apps Americans Love the Most

YouTube and Amazon Shopping lead the list of the most used apps in the US, with Temu joining at #8
Similarweb’s American Top 40 Mobile Apps list is a ranking of combined iOS and Android engagement with users in the United States. This ranking differs from some others because it is based on estimates of app usage rather than downloads or rankings provided by the app stores.
Key takeaways
- YouTube is the most used app in the US, with more than 243 million monthly active users in August, closely followed by Amazon Shopping at 236.6 million, according to Similarweb estimates.
- Four of the top 10 apps and 10 of the top 40 are owned by Google (or its parent company, Alphabet). Google apps account for more than one-third of the total active users of all the apps in this top 40 tally.
- Three of the top 10 (Instagram, Facebook, and Messenger) are owned by Meta Platforms.
- Temu’s appearance at #8 on the list is remarkable because its app only rose to popularity in the US within the past year. The fast-growing Chinese retailer had 133.3 million US monthly active users in August, or more than half of Amazon Shopping’s total.
- Aside from Temu, the Top 40 apps that gained the most users over the past year were Google Home, Cash App, Chase Mobile, YouTube Music, and Walmart: Shopping & Savings.
- The Top 40 apps that lost the most users were Google Calendar, Hulu, Netflix, X (Twitter), and Pandora.
We identified the top 40 list detailed below by starting with a list of more than 230 apps for which we identified both on iOS and Android versions. The ranking does not include apps that are only present on one operating system or the other, such as Apple Pay or common Android utilities.
Top of the List: Apps from Google, Amazon, Facebook … and Temu

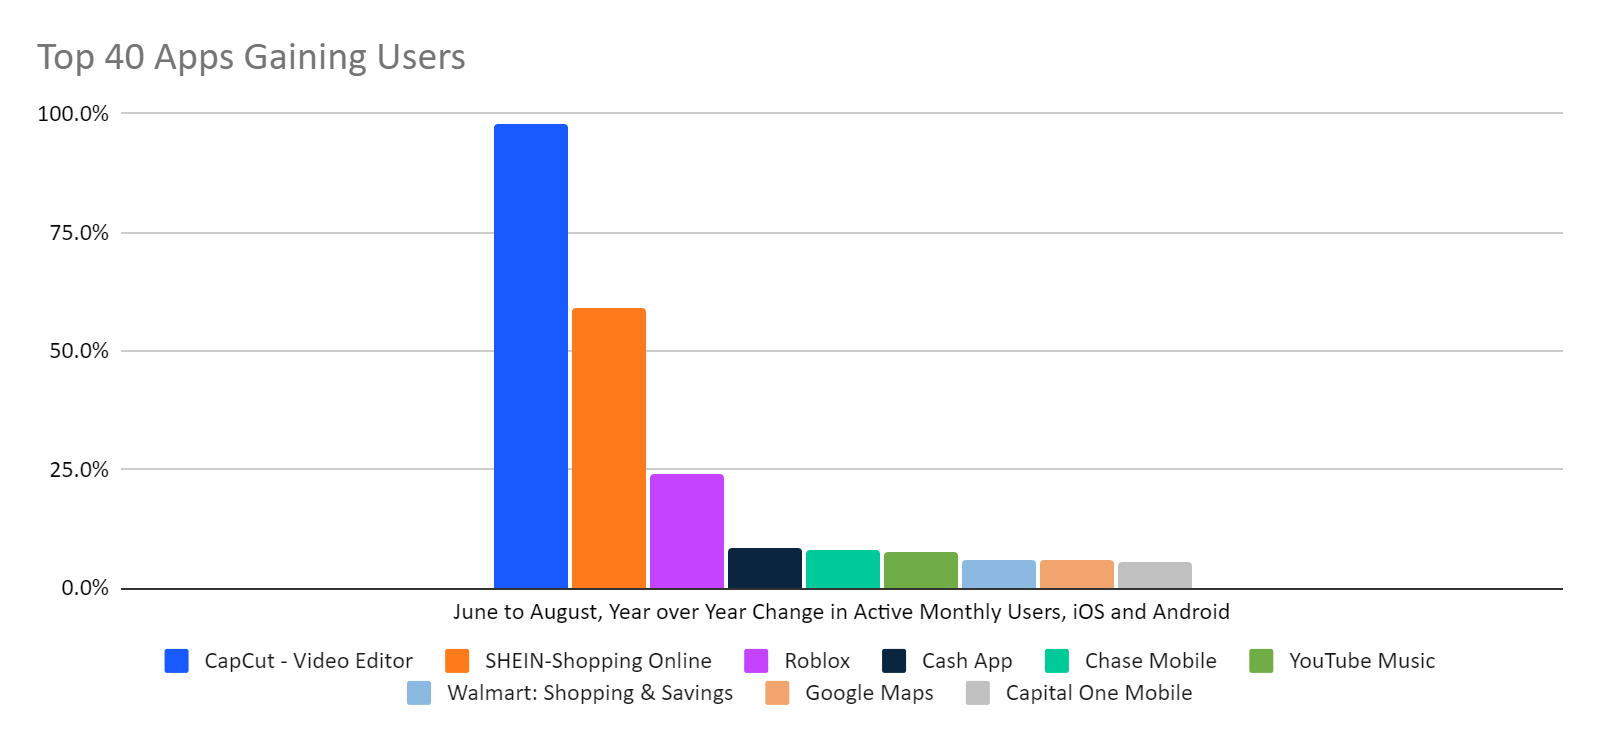
Apps Gaining Users: CapCut, Shein, Roblox, and others
To see which apps are growing or shrinking the most, we compared a 3-month total (June to August) for 2022 versus 2023 to arrive at the percentage changes shown below. Temu does not appear on this list because we didn’t begin tracking that app from within the US until September 2022.
CapCut, a video editor that turned up at #38 on our list, grew its user base 97.7% by that measure. Others with big gains included the Shein shopping app, which was up 59.2%, and Roblox, up 24.2%. Cash App, Chase Mobile, YouTube Music, and Walmart Shopping, Google Maps, and Capital One Mobile all gained by more than 5%.
Apps Losing Users: Google Calendar, Hulu, Netflix, X, and Pandora
The biggest loser in our analysis was Google Calendar. Although it’s still one of the most popular apps at #28 with 46.7 million monthly active users, it appears to be losing ground to other calendar and productivity apps, dropping 19.7% in our 3-month analysis.
Google Calendar users are particularly disappearing on iOS, where monthly active users were down nearly 40% year-over-year in August. But even on Android, the user count for August was down 8%.
Other apps losing ground included Hulu (-16.8 %), Netflix (-14%), X (-10.8%), and Pandora (-10.6%).

The 40 Most Popular Apps in the US
Here is the full list of the top 40, ranked by monthly active users for iOS and Android with a breakdown of which platform is responsible for the most usage. The year-over-year comparison is for the three most recent months of data (June to August).
|
App |
Aug 2023 |
Jun-Aug YoY |
iOS |
Android |
|
|
1 |
243,254,287 |
-3.4% |
67.4% |
32.6% |
|
|
2 |
236,613,964 |
-0.7% |
69.0% |
31.0% |
|
|
3 |
197,461,232 |
0.0% |
64.2% |
35.8% |
|
|
4 |
173,714,677 |
-0.3% |
49.6% |
50.4% |
|
|
5 |
160,299,882 |
-4.5% |
80.0% |
20.0% |
|
|
6 |
152,747,499 |
-8.0% |
68.6% |
31.4% |
|
|
7 |
144,993,337 |
-2.5% |
46.6% |
53.4% |
|
|
8 |
133,315,329 |
N/A |
86.9% |
13.1% |
|
|
9 |
129,056,161 |
-1.0% |
47.0% |
53.0% |
|
|
10 |
119,216,208 |
-2.2% |
71.3% |
28.7% |
|
|
11 |
117,869,316 |
8.7% |
72.7% |
27.3% |
|
|
12 |
112,422,409 |
5.8% |
38.7% |
61.3% |
|
|
13 |
105,686,481 |
-6.1% |
52.7% |
47.3% |
|
|
14 |
101,366,340 |
5.9% |
77.6% |
22.4% |
|
|
15 |
96,900,871 |
-5.9% |
76.6% |
23.4% |
|
|
16 |
94,621,601 |
-1.3% |
10.2% |
89.8% |
|
|
17 |
82,321,441 |
-9.8% |
78.2% |
21.8% |
|
|
18 |
81,332,318 |
-10.8% |
76.3% |
23.7% |
|
|
19 |
72,627,301 |
-0.2% |
67.8% |
32.2% |
|
|
20 |
71,116,265 |
-3.9% |
77.0% |
23.0% |
|
|
21 |
63,319,776 |
-2.6% |
60.2% |
39.8% |
|
|
22 |
62,521,435 |
-14.0% |
68.0% |
32.0% |
|
|
23 |
56,821,129 |
-3.2% |
75.9% |
24.1% |
|
|
24 |
53,401,464 |
-0.4% |
67.8% |
32.2% |
|
|
25 |
50,689,436 |
2.0% |
69.2% |
30.8% |
|
|
26 |
50,126,348 |
59.2% |
87.8% |
12.2% |
|
|
27 |
48,863,964 |
-5.0% |
72.6% |
27.4% |
|
|
28 |
47,264,799 |
-2.6% |
81.5% |
18.5% |
|
|
29 |
46,771,063 |
-19.7% |
55.0% |
45.0% |
|
|
30 |
45,276,627 |
8.2% |
73.7% |
26.3% |
|
|
31 |
45,183,213 |
-10.6% |
74.6% |
25.4% |
|
|
32 |
43,924,178 |
-7.2% |
46.9% |
53.1% |
|
|
33 |
42,089,551 |
24.2% |
86.4% |
13.6% |
|
|
34 |
38,454,011 |
7.6% |
59.1% |
40.9% |
|
|
35 |
37,963,877 |
5.7% |
76.2% |
23.8% |
|
|
36 |
34,172,939 |
-3.8% |
42.2% |
57.8% |
|
|
37 |
34,165,923 |
2.0% |
77.0% |
23.0% |
|
|
38 |
33,963,258 |
97.7% |
88.2% |
11.8% |
|
|
39 |
33,287,810 |
-16.8% |
76.8% |
23.2% |
|
|
40 |
31,911,889 |
2.3% |
86.4% |
13.6% |
The Similarweb Insights & Communications team is available to pull additional or updated data on request for the news media (journalists are invited to write to press@similarweb.com). When citing our data, please reference Similarweb as the source and link back to the most relevant blog post or similarweb.com/blog/insights/.
Disclaimer: All names, brands, trademarks, and registered trademarks are the property of their respective owners. The data, reports, and other materials provided or made available by Similarweb consist of or include estimated metrics and digital insights generated by Similarweb using its proprietary algorithms, based on information collected by Similarweb from multiple sources using its advanced data methodologies. Similarweb shall not be responsible for the accuracy of such data, reports, and materials and shall have no liability for any decision by any third party based in whole or in part on such data, reports, and materials.
