13 Digital Marketing Metrics to Track Success

Digital marketing metrics are central to every website and marketing team. Not everybody tracks the same metrics, but without any tracking, you’re lost.
In this article, we’ve covered the full marketing funnel and split the core metrics each and every marketing team should track by: traffic, engagement, conversion and the big one: revenue.
There are literally thousands of internet marketing metrics, but these 13 are your bread and butter.
And psst… a little secret: with Similarweb Digital Marketing Intelligence, you can track the traffic and engagement metrics of your competition too – game-changing.
What are digital marketing metrics?
Digital marketing metrics are the values used by marketing teams to measure and track the performance of your website and marketing campaigns.
Generally, marketers will use a variety of in-house and external tools to track metrics. Marketers should also benchmark against competitors, their industry and market to set KPIs (Key Performance Indicators) based on the metrics that matter.
Website traffic metrics
1. Overall website traffic
In today’s digital-first world, your website is the nucleus of your marketing and sales activity. The more traffic you can drive to it, the more new leads you can generate and potential customers you can close.
With this in mind, measuring websites’ overall traffic – which is essentially all of your traffic sources combined, i.e. social media, referral traffic, direct traffic, organic traffic (no matter where from) – will give you a good idea of your website’s overall performance. Most marketing departments have traffic targets as a core business KPI.
How to track: Google Analytics is the general go-to tool for tracking overall website traffic. In order to track your competitors’ traffic, Similarweb can give you the down-low.
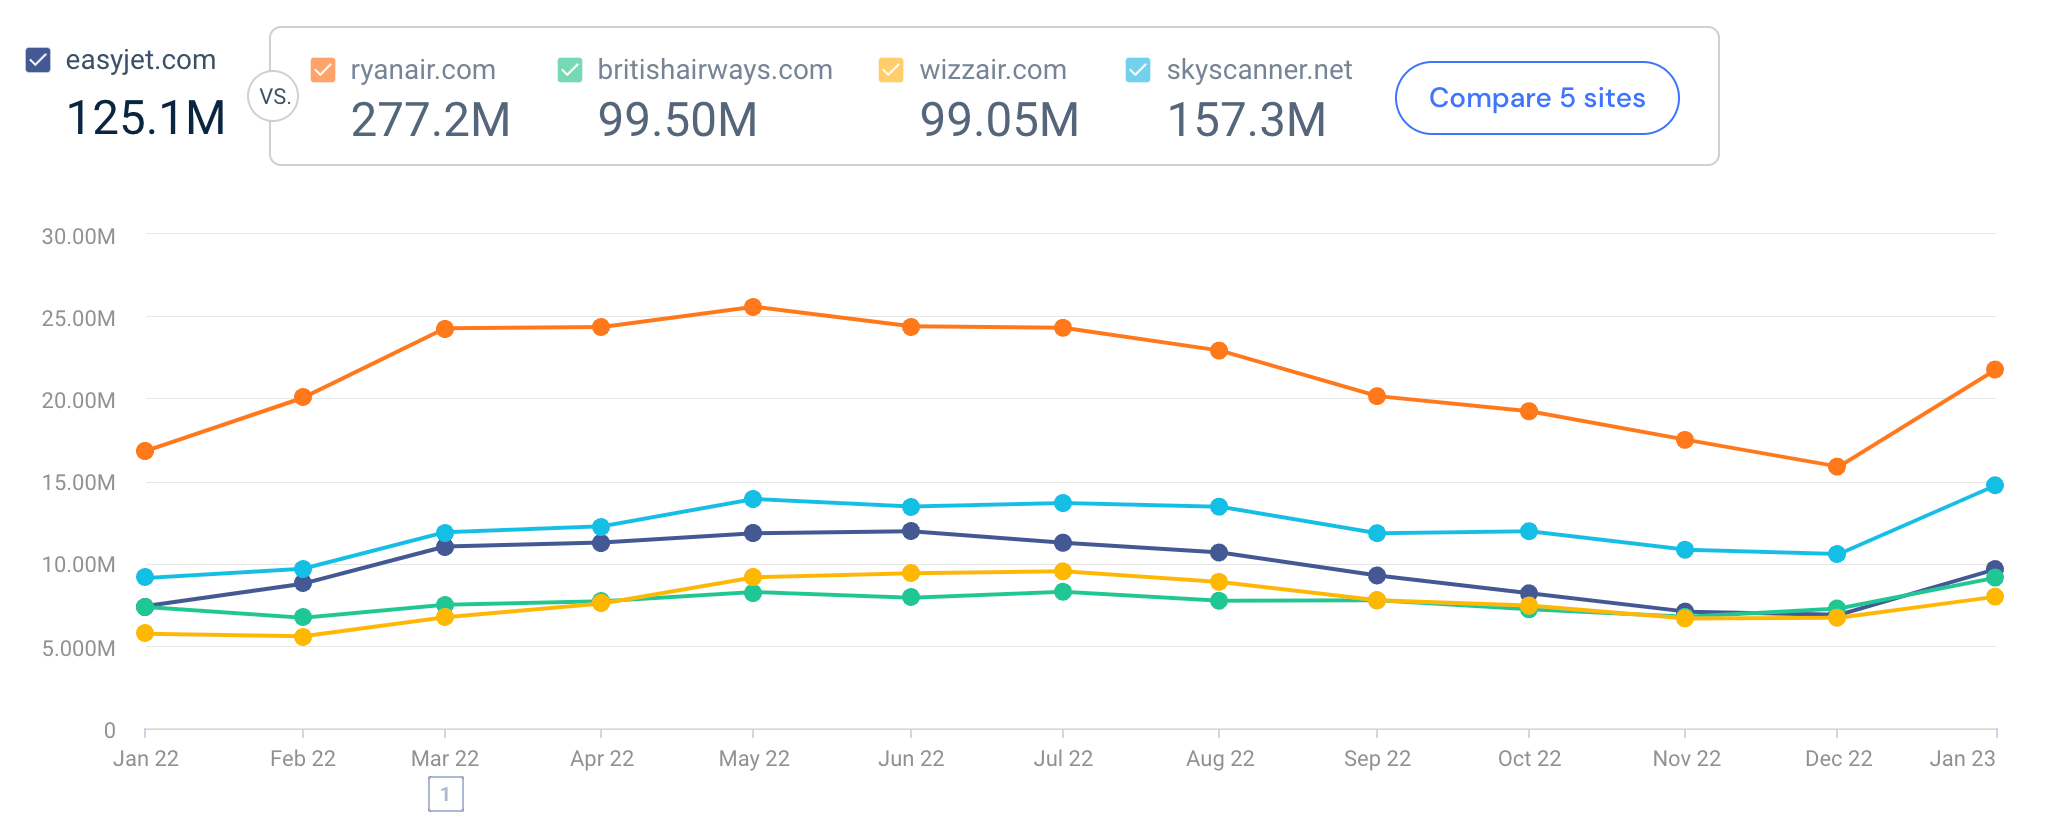
Type any website into Similarweb to see its traffic numbers over time. Here we’ve chosen key players in the airline industry to review traffic against each other.
2. Traffic by marketing channel
If you want to drill down into the specifics of each channel, traffic by marketing channel or source (depending on the analytics tool) is what you want to look at.
The great thing about traffic by marketing channel or source is that you can use the data to identify which channels are working well, versus those that need more attention.
For example, you may find that a lot of your website’s traffic is generated via social media – you could then build more campaigns around your social media channels to increase that traffic further.
However, the one channel that you always want to be doing well is organic, as it’s what will continue to generate traffic after the end of your campaigns.
Organic traffic shows how many people found your website via search engines. The easiest way to improve it is to optimize your web pages and incorporate new, but relevant search terms.
Ultimately, you want to focus on the channels that your buyer personas use. If your target audience rarely checks email or doesn’t use social media, for instance, it doesn’t make sense to invest a lot of your time and effort there.
How to track:
- Google Analytics shows a breakdown of each channel
- Google Search Console is the go-to for organic
- Similarweb Competitive Analytics shows you the traffic channel mix for any competitor
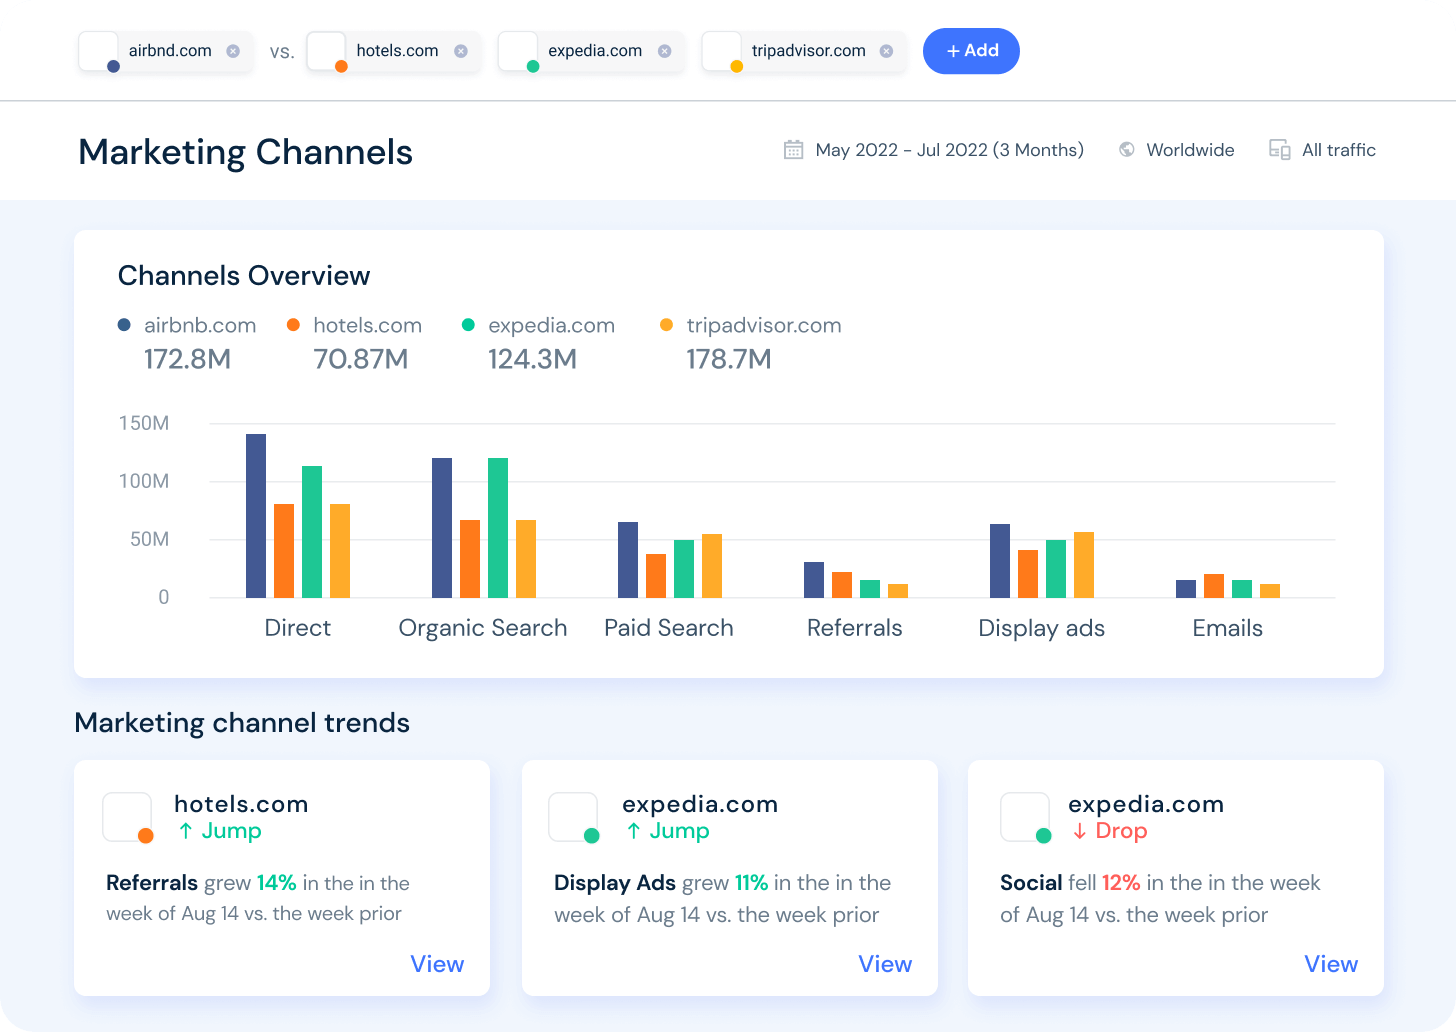
Similarweb shows you traffic mix metrics, but also changes, trends for both you and your competitors – vital for actioning new strategies and changes.
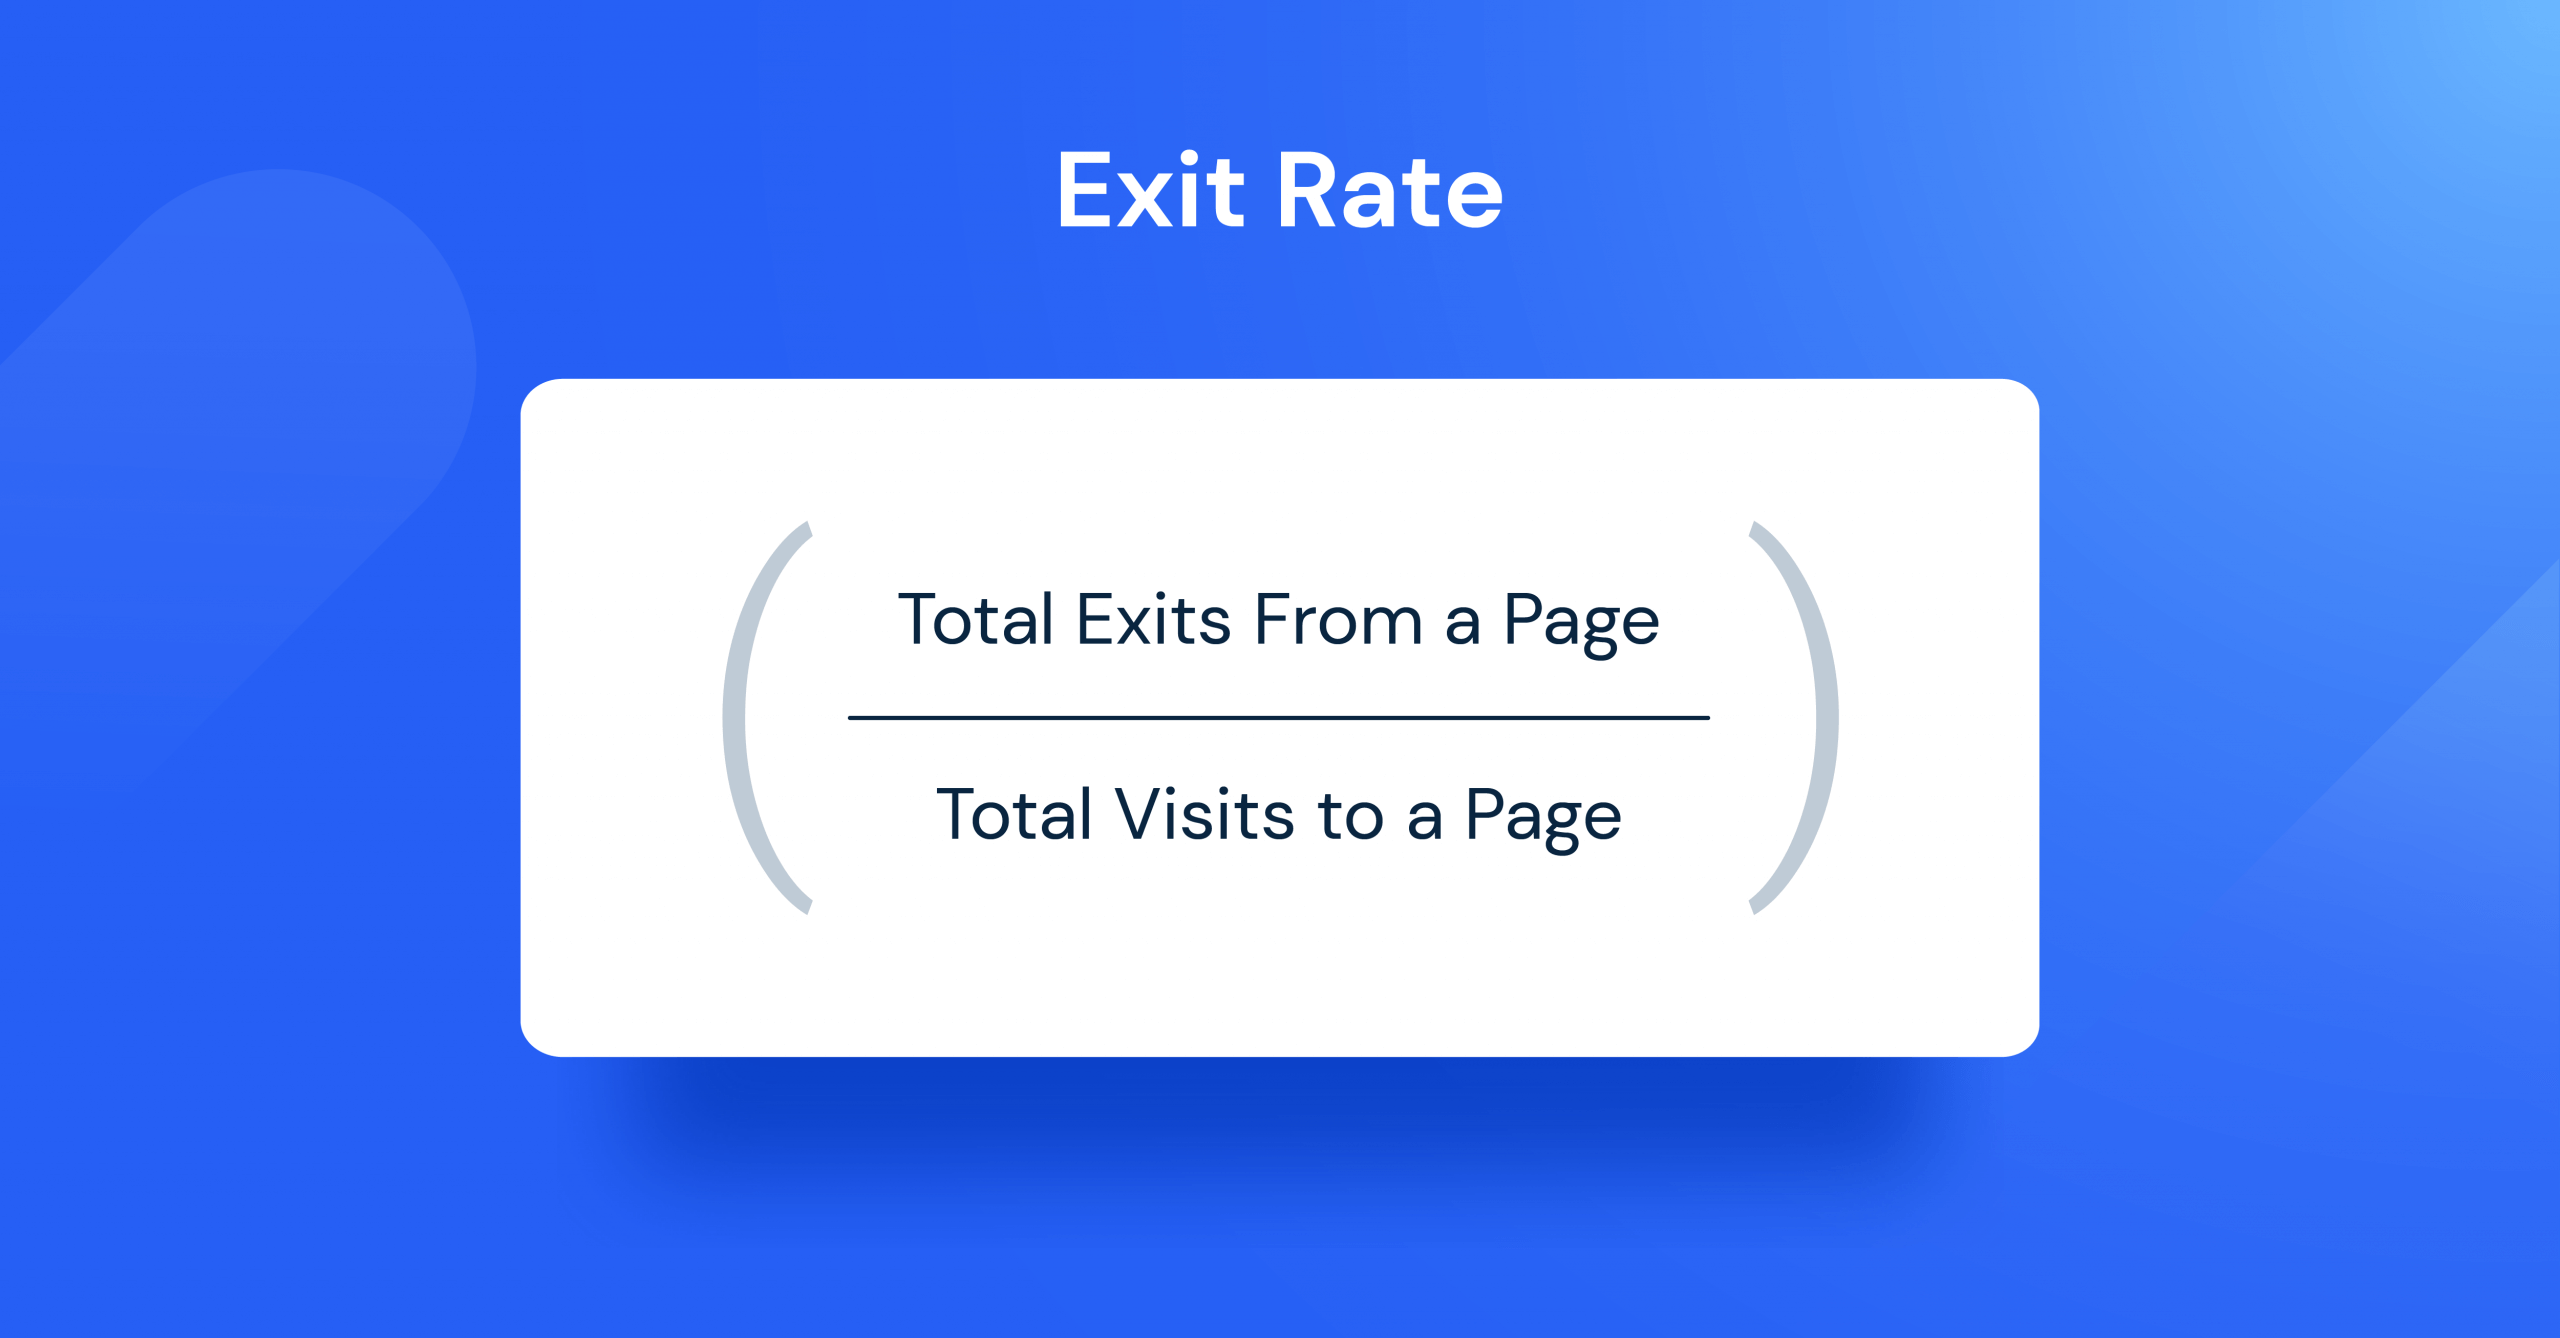
3. Exit rate
Looking at your website’s exit rate (or exit rate by page) is very useful for websites with a multi-page conversion process or multiple touchpoints. Why? Because it shows you where and when people leave your site.
For example, new visitors might find your website via a social media promotion – directing them to a related blog – then they click on the call to action at the end to download a piece of content, but they don’t complete the form. What gives?
At this point, you can look at your landing page’s exit rate, see what percent of people are leaving once they arrive, and optimize the page accordingly. You can also look at statistics like time on page and engagement rate (but more on that next) to make informed decisions.
Another possibility: The landing page content doesn’t align well with the blog CTA. Are you offering readers what they expected? Is the form too long? Or perhaps the content can be found elsewhere with greater ease.
Engagement metrics
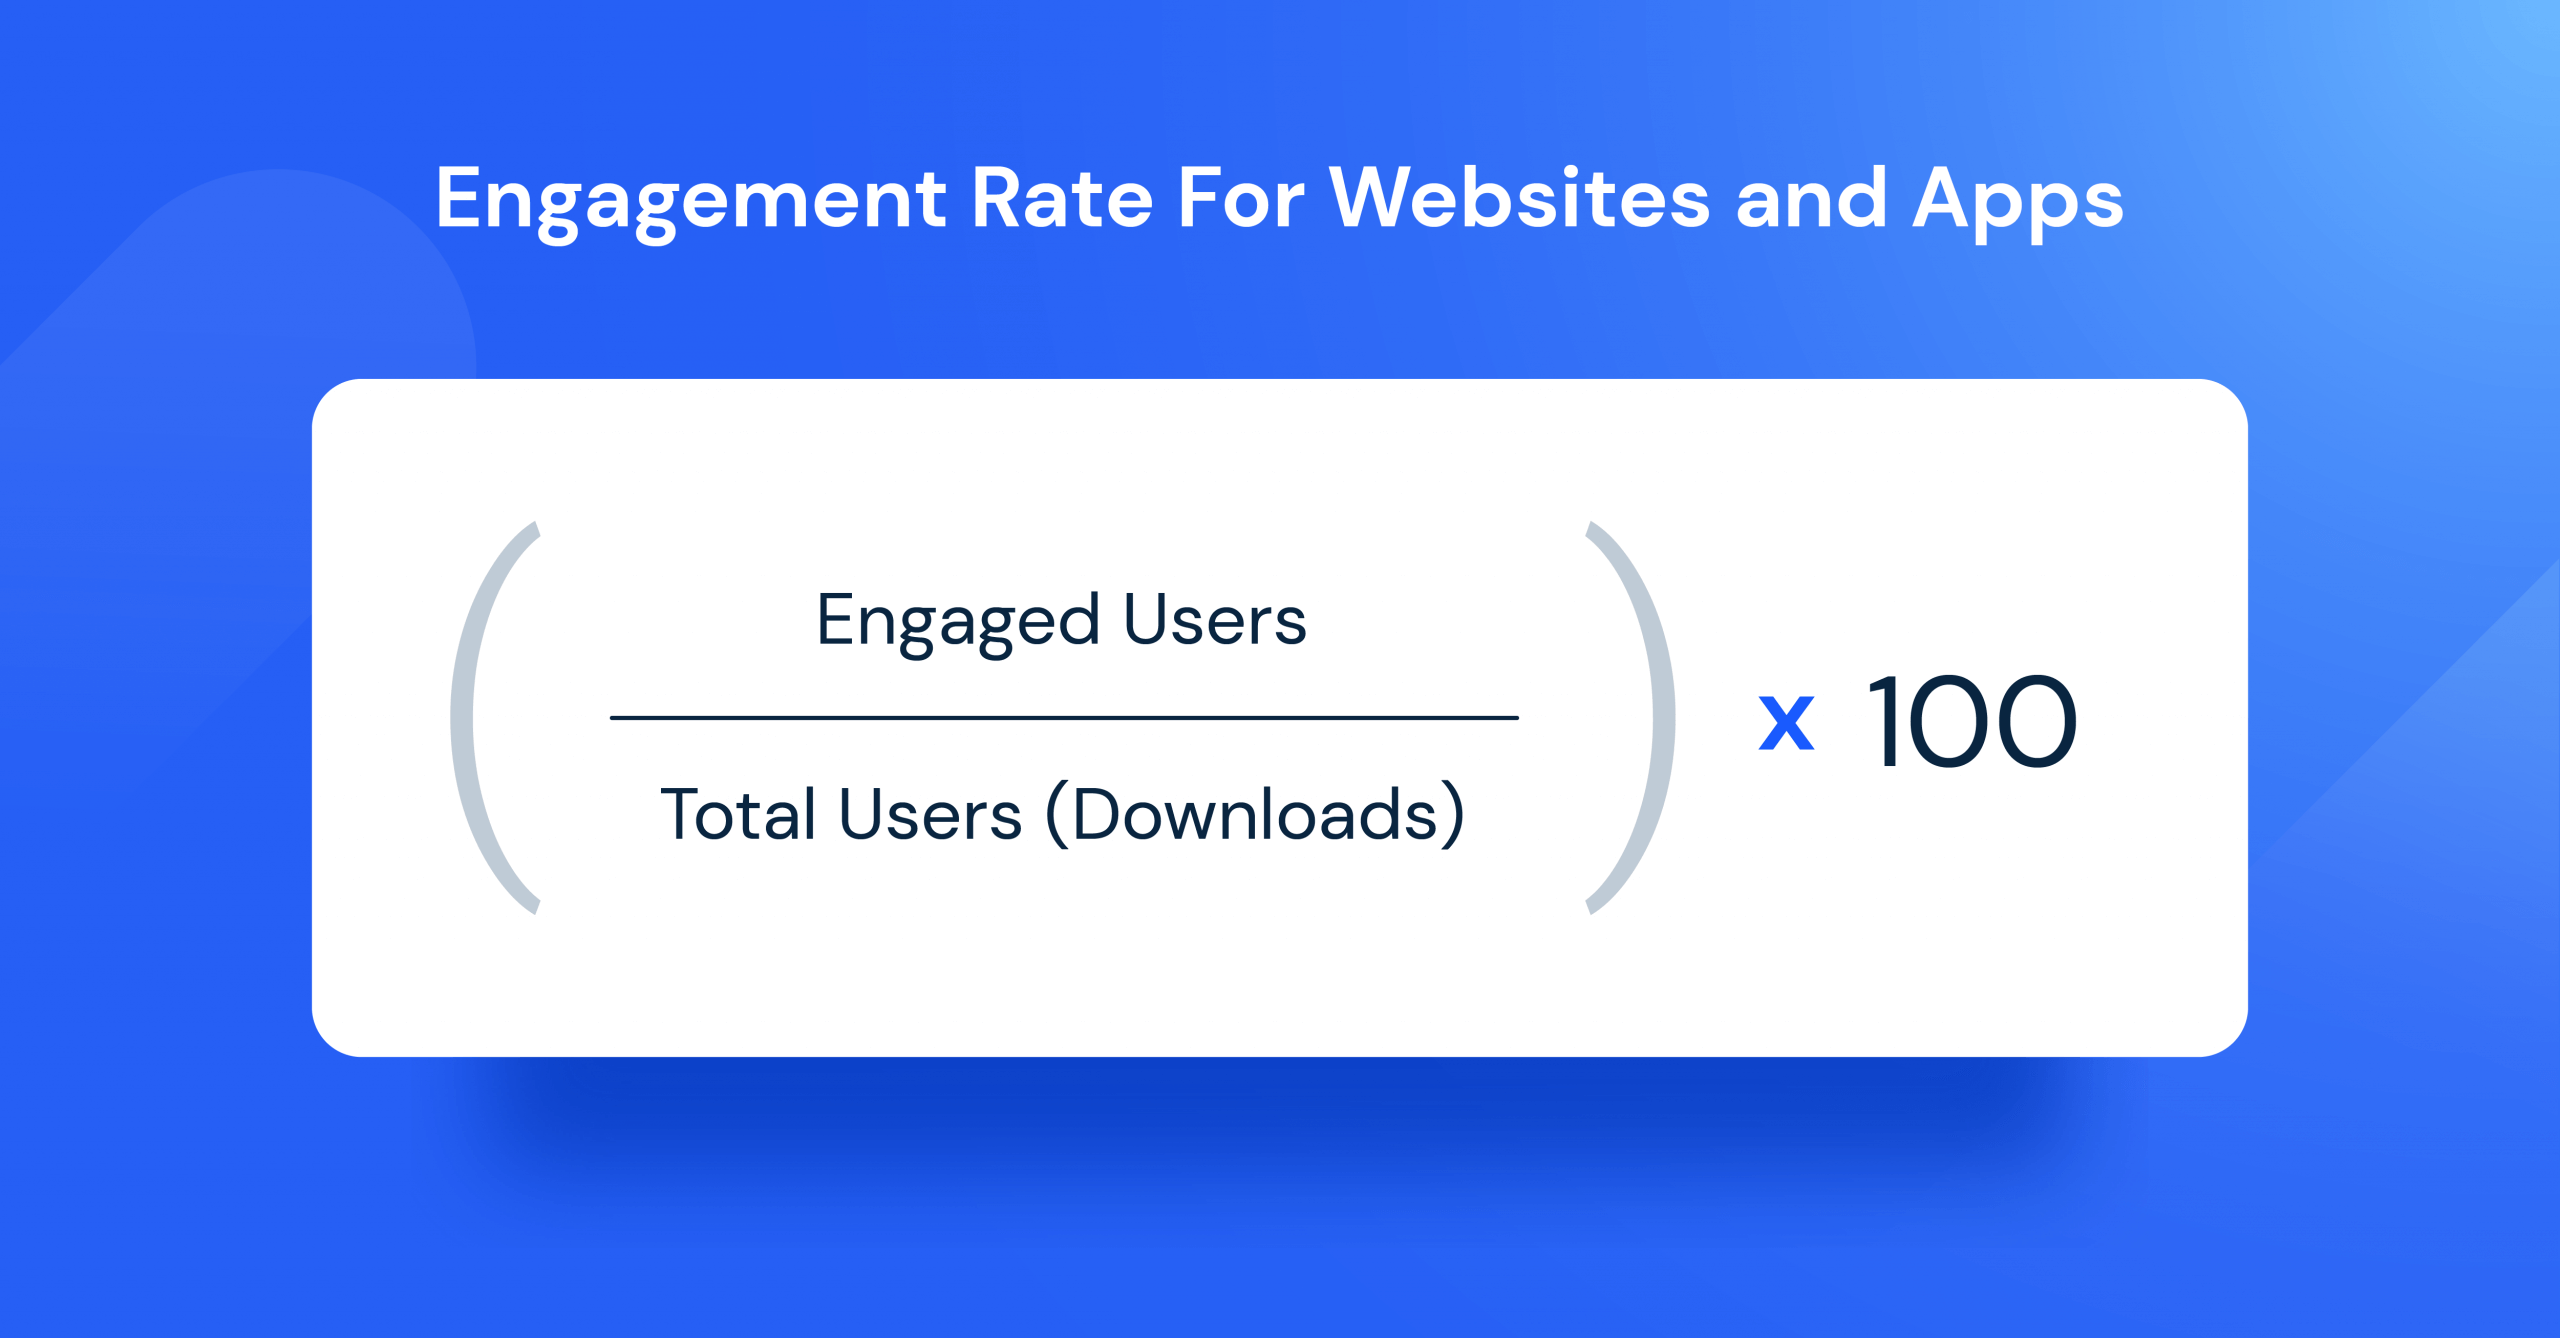
4. Engagement rate
Engagement rate is a difficult metric to measure because it varies depending on the platform. For example, social media platforms will define engagement rate based on likes, comments, and shares. 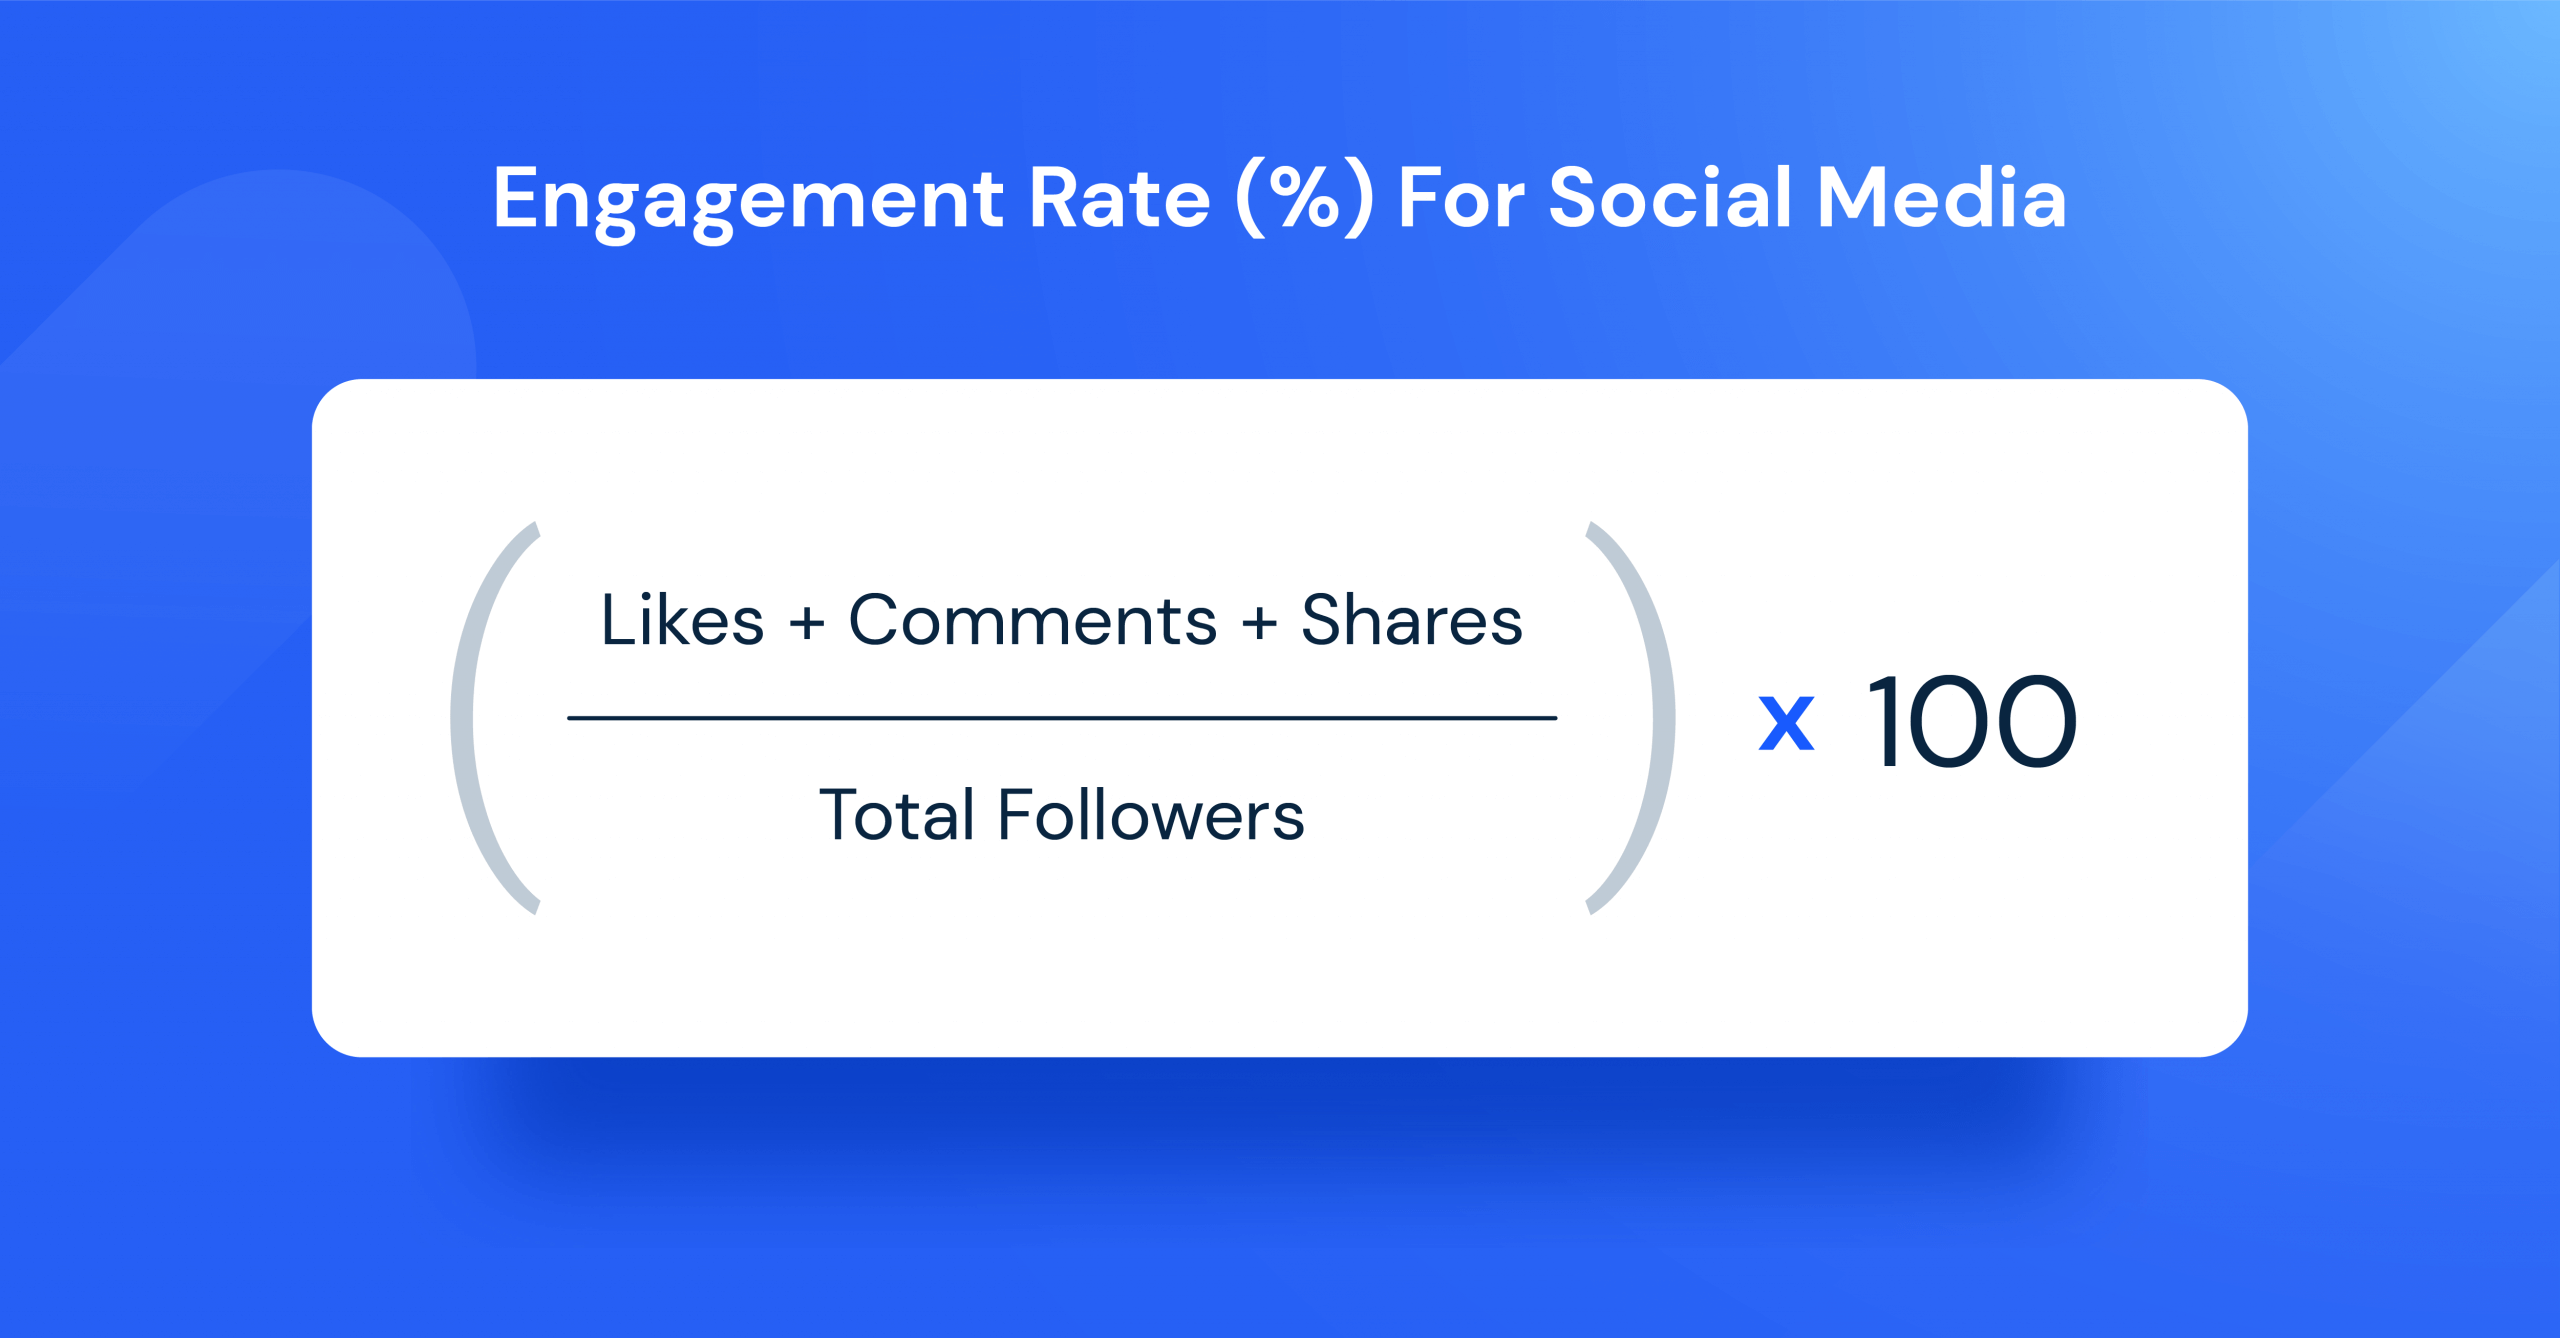
For your website, however, while social sharing buttons should always be included on blog and landing pages to maximize their reach – you’ll typically look at things like session duration, page depth, and bounce rate to determine just how “engaged” your website visitors are and then conversion metrics to see if your content is working.
For instance, if you look at just one of these metrics in isolation, it becomes difficult to get a clear picture of how website visitors are interacting with your website. A high bounce rate could be an indication that your web pages don’t meet the needs of visitors or it loads incredibly slowly – but looking at a low bounce rate in conjunction with a good average page depth means that people are likely to be reading your content.
Of course, this varies from industry to industry, it may be that within the first few minutes of arriving on a page, the visitor has found what they needed. However, if this were the case for a landing page, the best way to see if your content has been successful is to tie visits to bounces and conversions.
5. Average session duration (or time on page)
How long are people staying on your web pages? Are they engaging with your content? A longer time on the page might indicate that people are reading your content word-for-word, but keep in mind that most users skim.
What you want to do is look at this metric with your bounce rate. A high bounce rate and low time on the page mean that your page probably isn’t delivering.
At the same time, think about the keywords you’ve optimized that page for. Top-of-the-funnel (TOFU) content is typically longer and more educational, so it would make more sense for someone at the beginning of their purchase journey (brand awareness) to spend more time on the page.
On the other hand, someone who has been nurtured to a point of purchase and knows exactly what they want to do on your website may skim a product or service page and convert quickly into a paying customer.
So when you look at average session duration, look at it in conjunction with your other engagement and lead generation metrics.

6. Average page depth
This digital marketing metric looks at pages per session (or the average number of pages visited by a user within a session). This metric is a standard option in Google Analytics and Similarweb.
In terms of relevance to your overall website traffic (and how you use page depth to analyze web pages), you can use page depth to determine how much interest users have in the sub-pages of your website.
For example, low page depth can indicate that your website’s architecture (i.e. calls-to-action, navigation, internal linking) doesn’t push users to move deeper into your website. You could look at this digital marketing metric alongside time on page and exit rate to determine if your content is meeting your visitors’ needs.
However, even if your pages have high depth and plenty of views, if the engagement isn’t leading to conversions, you have to look at what offers you are pushing visitors towards. Can they easily find what they are looking for and engage with you in the right way?
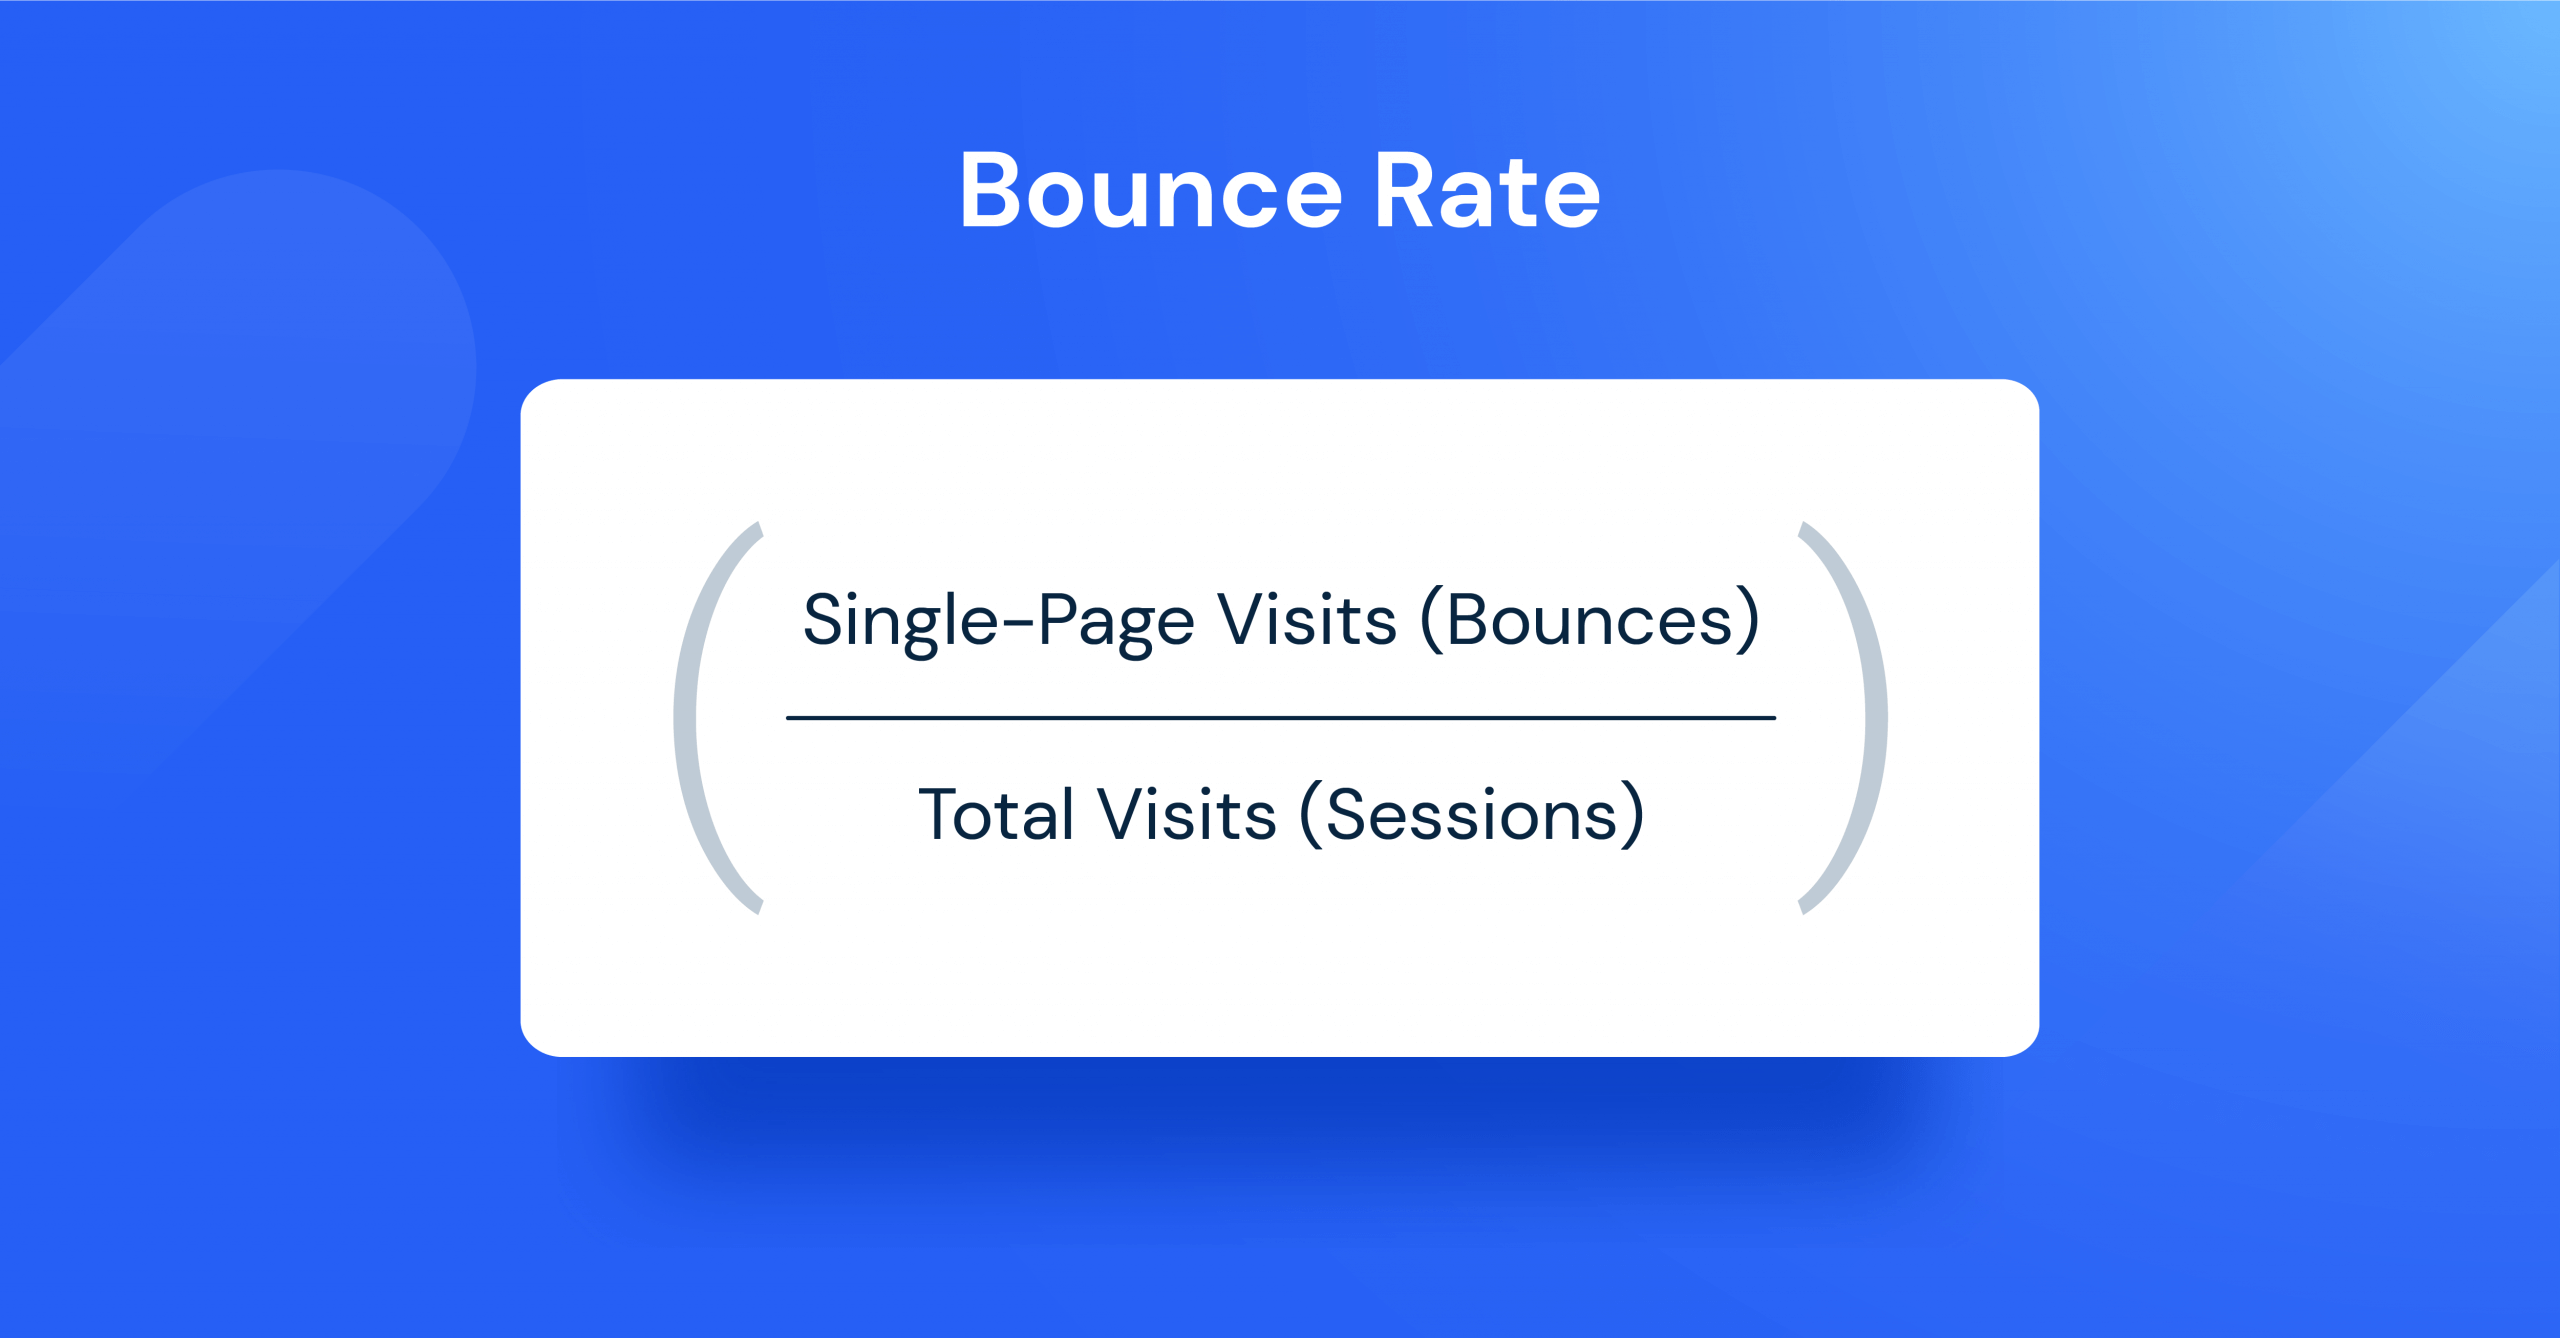
7. Bounce rate
Bounce rate is essentially the percentage of visitors that leave a web page without taking an action, such as clicking on a call-to-action, filling out a form, or making a purchase.
You can track your overall bounce rate using website analytics tools, or for single pages or segments of your site.
But why is this important?
Well, if someone clicks on one of your web pages and leaves without taking any kind of action, that could signal to search engines that your site isn’t what they’re looking for. Subsequently, that web page could move down search engine rankings, which is bad news for you.
Of course, while a high bounce rate is something to avoid — what constitutes a good one? Studies vary, but generally, 50-60% is considered the average. Site-wide bounce rate is an indicator, sure, but it’s too wide to be used as an informative metric. What you want to do is drill down into the data: look at bounce rate by source, web page, and country. Then cross-reference that data with time on page, page depth, new vs. returning visitors, and other digital marketing metrics to identify where you can improve.
Conversion metrics
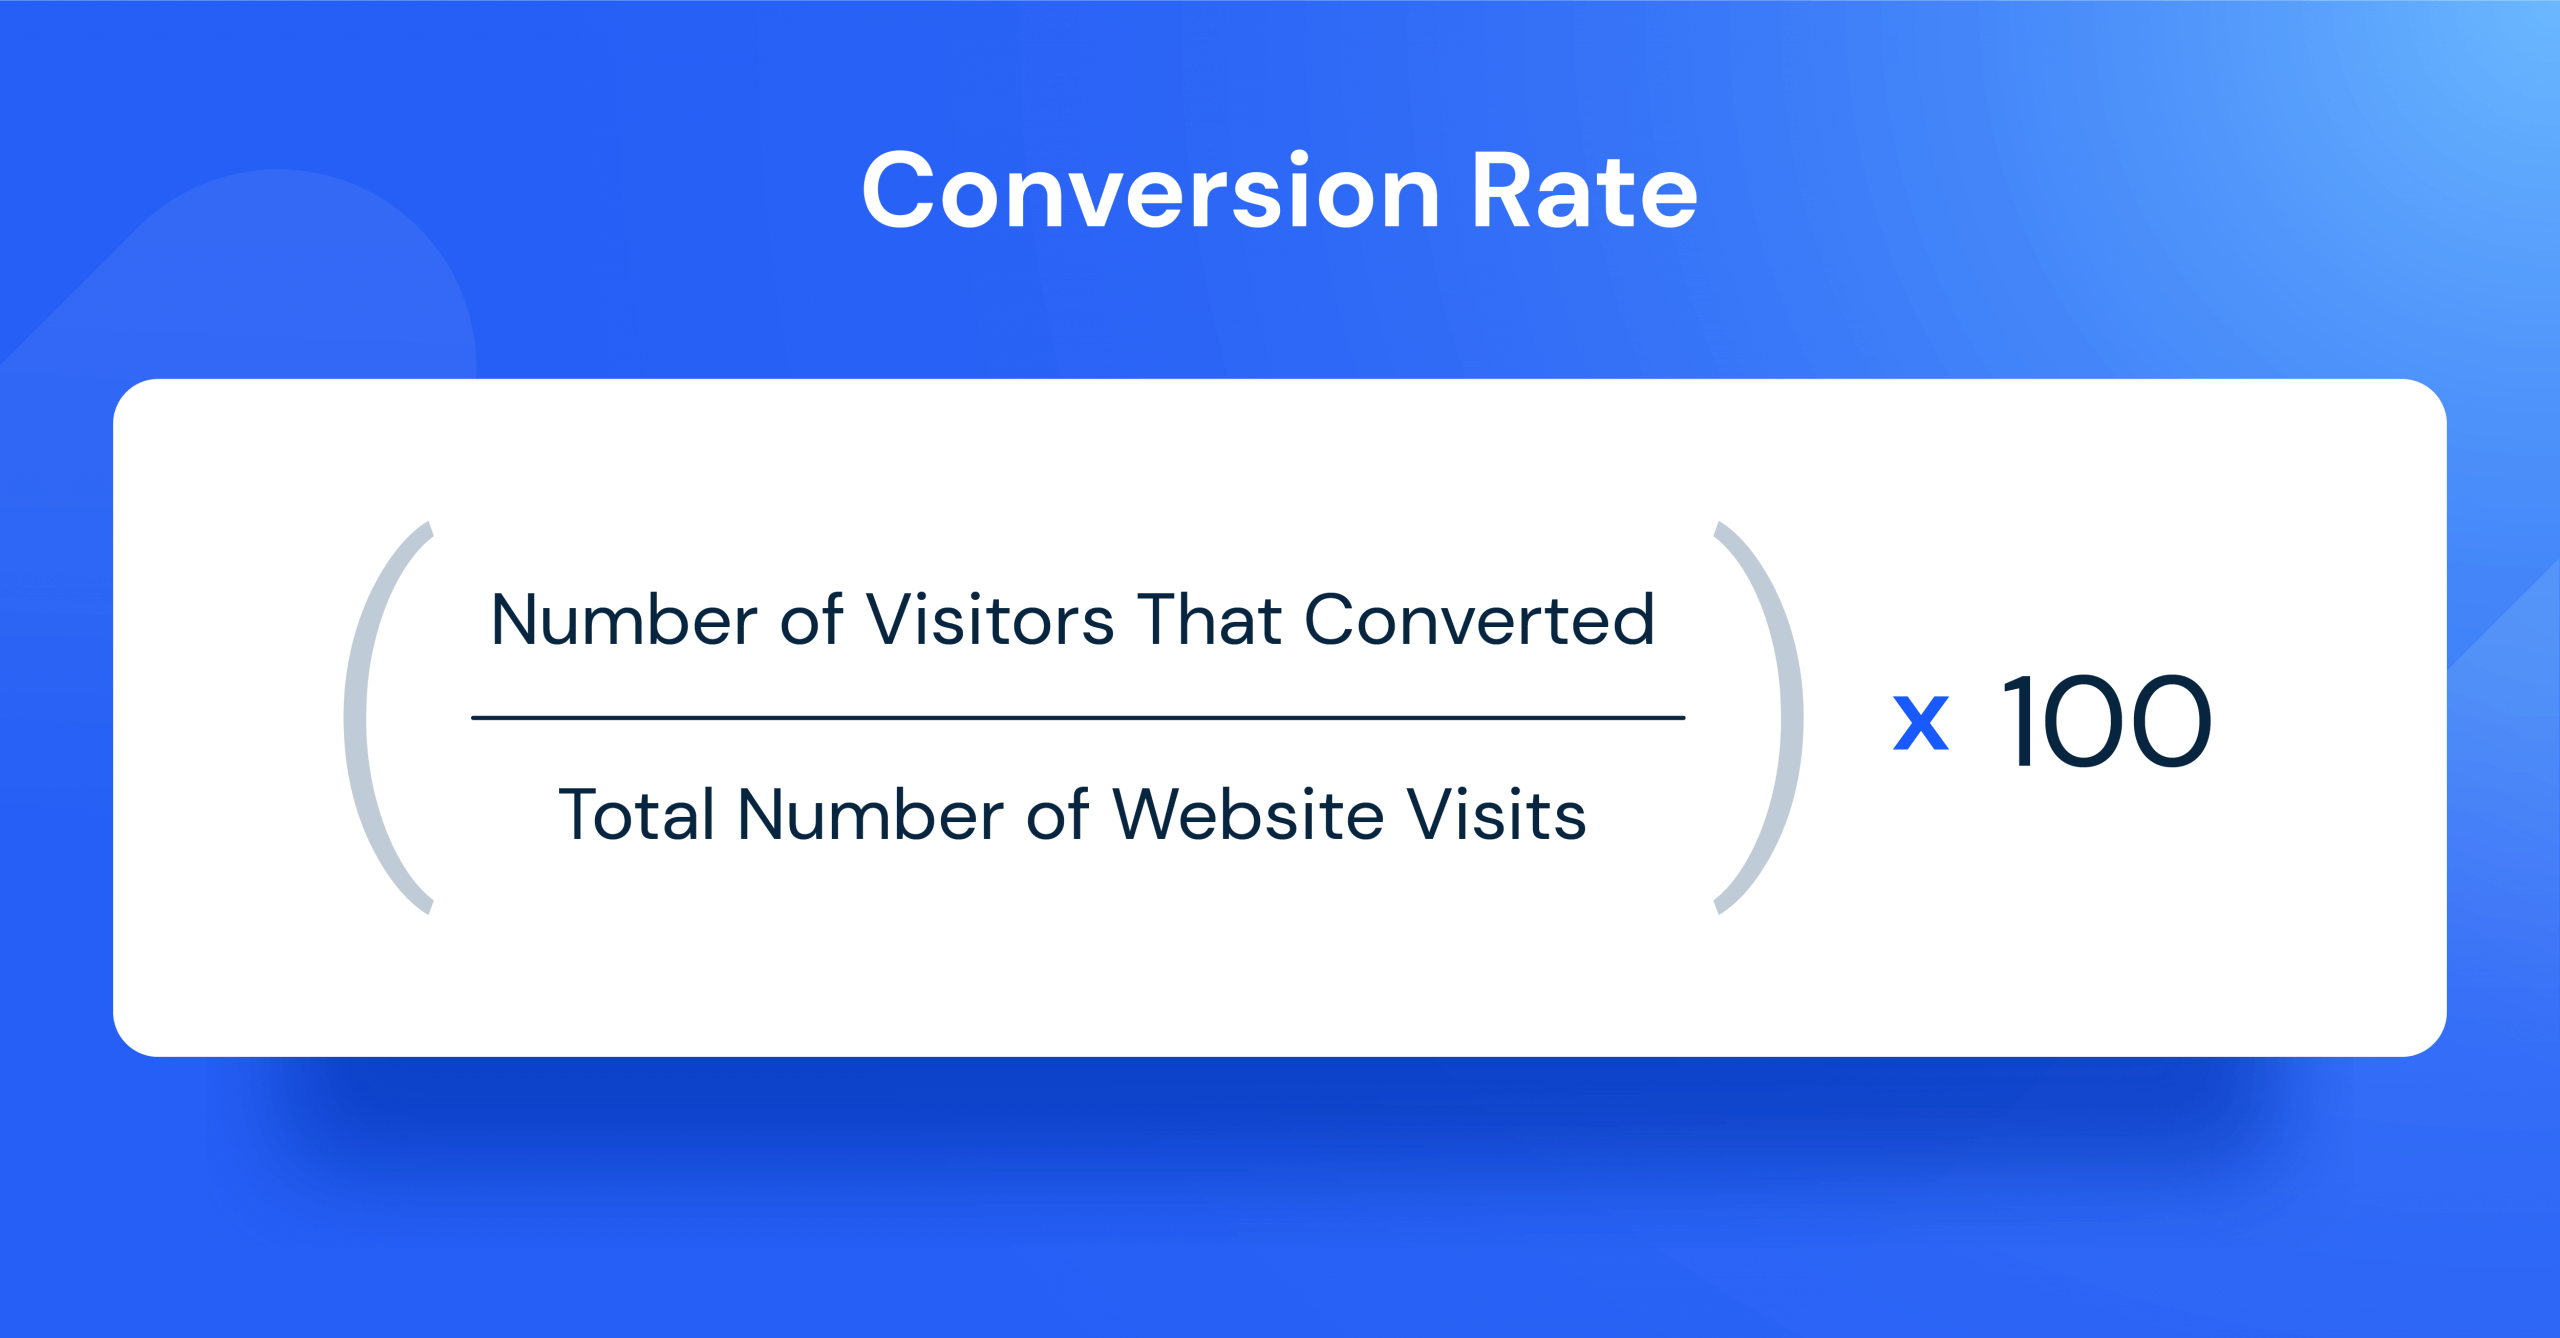
8. Conversion rate
If you want to understand how well your landing pages are performing, this digital marketing metric is the one to track.
The conversion rate tells you the percentage of website visitors who click on your calls-to-action and convert. This could be anything from asking them to contact you via phone, sign up for your blog or newsletter, or download a piece of content.
By looking at your conversion rate (and per web page or asset), you get a granular view of how many people are successfully becoming leads and or customers. Again, you’ll want to combine your conversion rate with other metrics to identify areas of improvement.
For example, if a page has high traffic and engagement but a low conversion rate, the call-to-action could be misplaced or irrelevant to what the page is discussing. You should experiment with the placement, style, and content of the call-to-action to optimize the page.
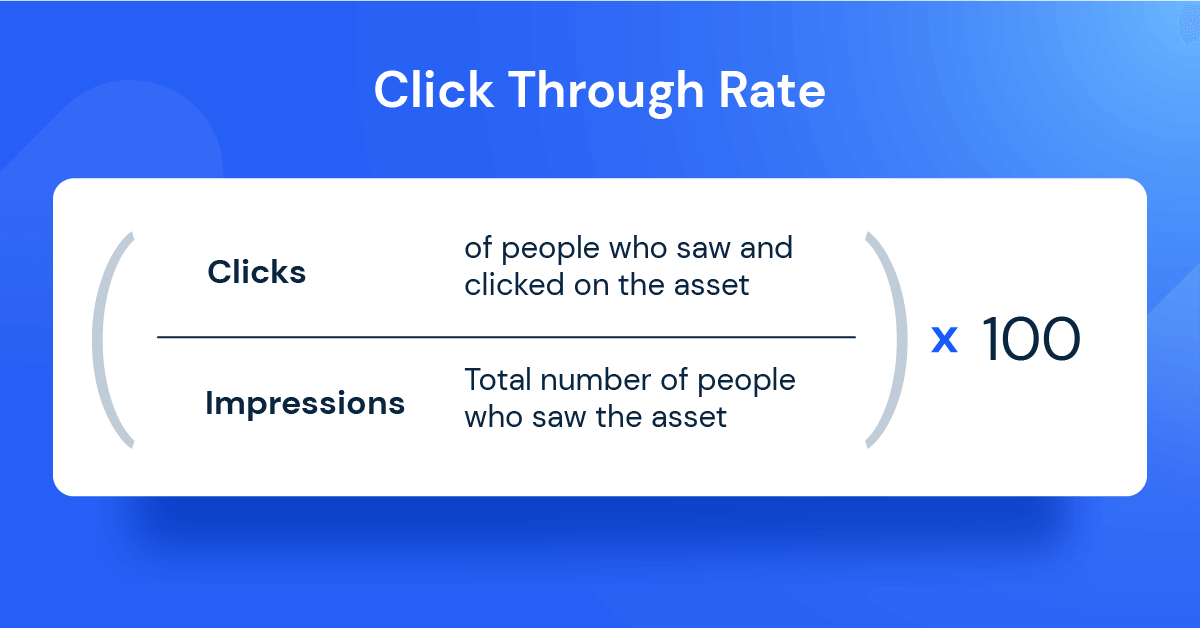
9. Click-through rate
This digital marketing metric shows you how often those who see your ad end up clicking it. You can use click-through rate (CTR) to gauge how well your keywords, ads, and free product listing are performing.
For example, a high CTR is a good indication that searchers find your ads and listings helpful and relevant. A good CTR depends on several variables, your ads position, your industry, and even the pages you are trying to promote.
To achieve strong click-through rates, you want to ensure that the keywords you choose for your ads are relevant to your business, i.e. your product, service, or asset you are trying to advertise. The reason for this is because you pay for every click and, depending on your chosen keywords and desired position, can cost you a lot of money.
This means you’re spending without bringing in any revenue or results.
Overall, the better your CTR, the higher your Quality Score and this is one of the best predictors of success in pay-per-click campaigns (PPC). You can also improve your CTR by making your ads more relevant. This means matching your keywords to your ad’s messaging.
Other ways to improve your CTR include:
- Testing different ad copy
- Creating more compelling offers
- Optimizing your landing page designs
- Including more relevant CTAs and ad extensions
When you make changes, make sure to monitor the performance of your ad campaigns as you may find something that works for your audience.
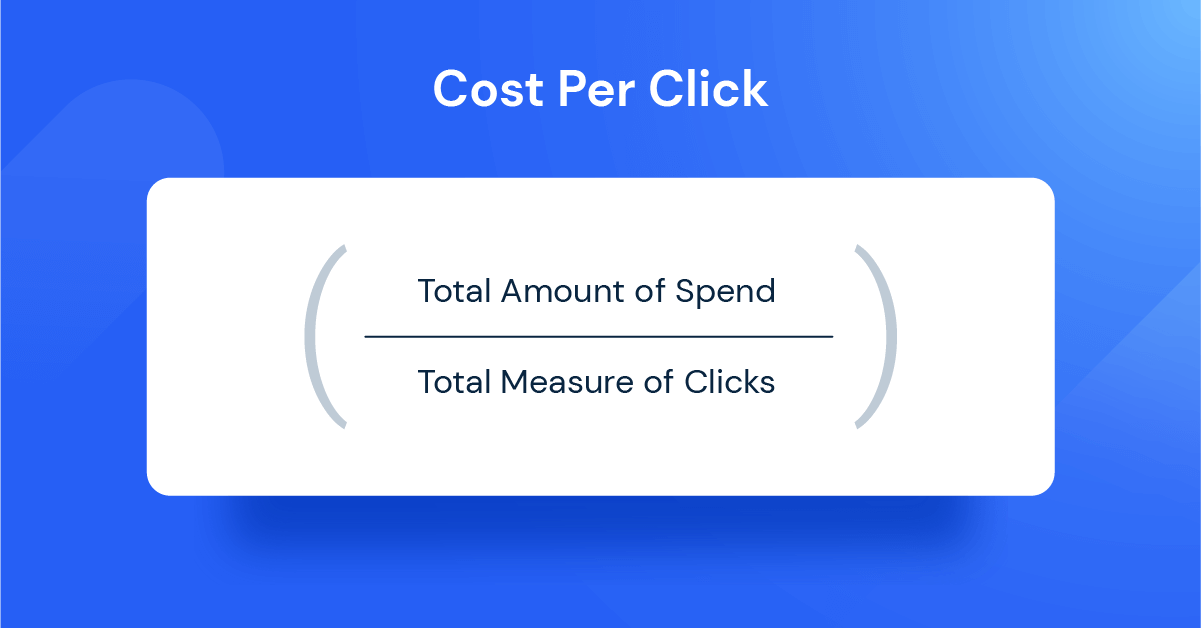
10. Cost per click
Following on from the previous digital marketing metric, the cost per click (CPC) is exactly what it sounds like: How much it costs you for each click of an ad.
While you don’t want to spend an excessive amount for each click, you have to have realistic expectations of how much you’re going to spend for each click. In general, the more “generic” the term, the higher the CPC.
With CPC, you essentially bid against a series of competitors over time, but you’ll never pay more than your max bid. The actual amount you pay for a click is heavily influenced by your ad rank, maximum bid, and quality score.
If you want to lower your CPC, start by raising your Quality Score. Well-managed PPC campaigns with impressive quality scores (6 or higher) are granted discounts of around 16-50% decrease. Those with lower scores pay much more.
To improve your quality score, create relevant ads, build out related ad groups and optimize your ad text and landing pages so that they speak to the searcher. You can also expand your reach by adding new keyword groups and advertising opportunities or identify negative keywords and refine your targeting to ensure you drive only the most relevant searchers to your ads.
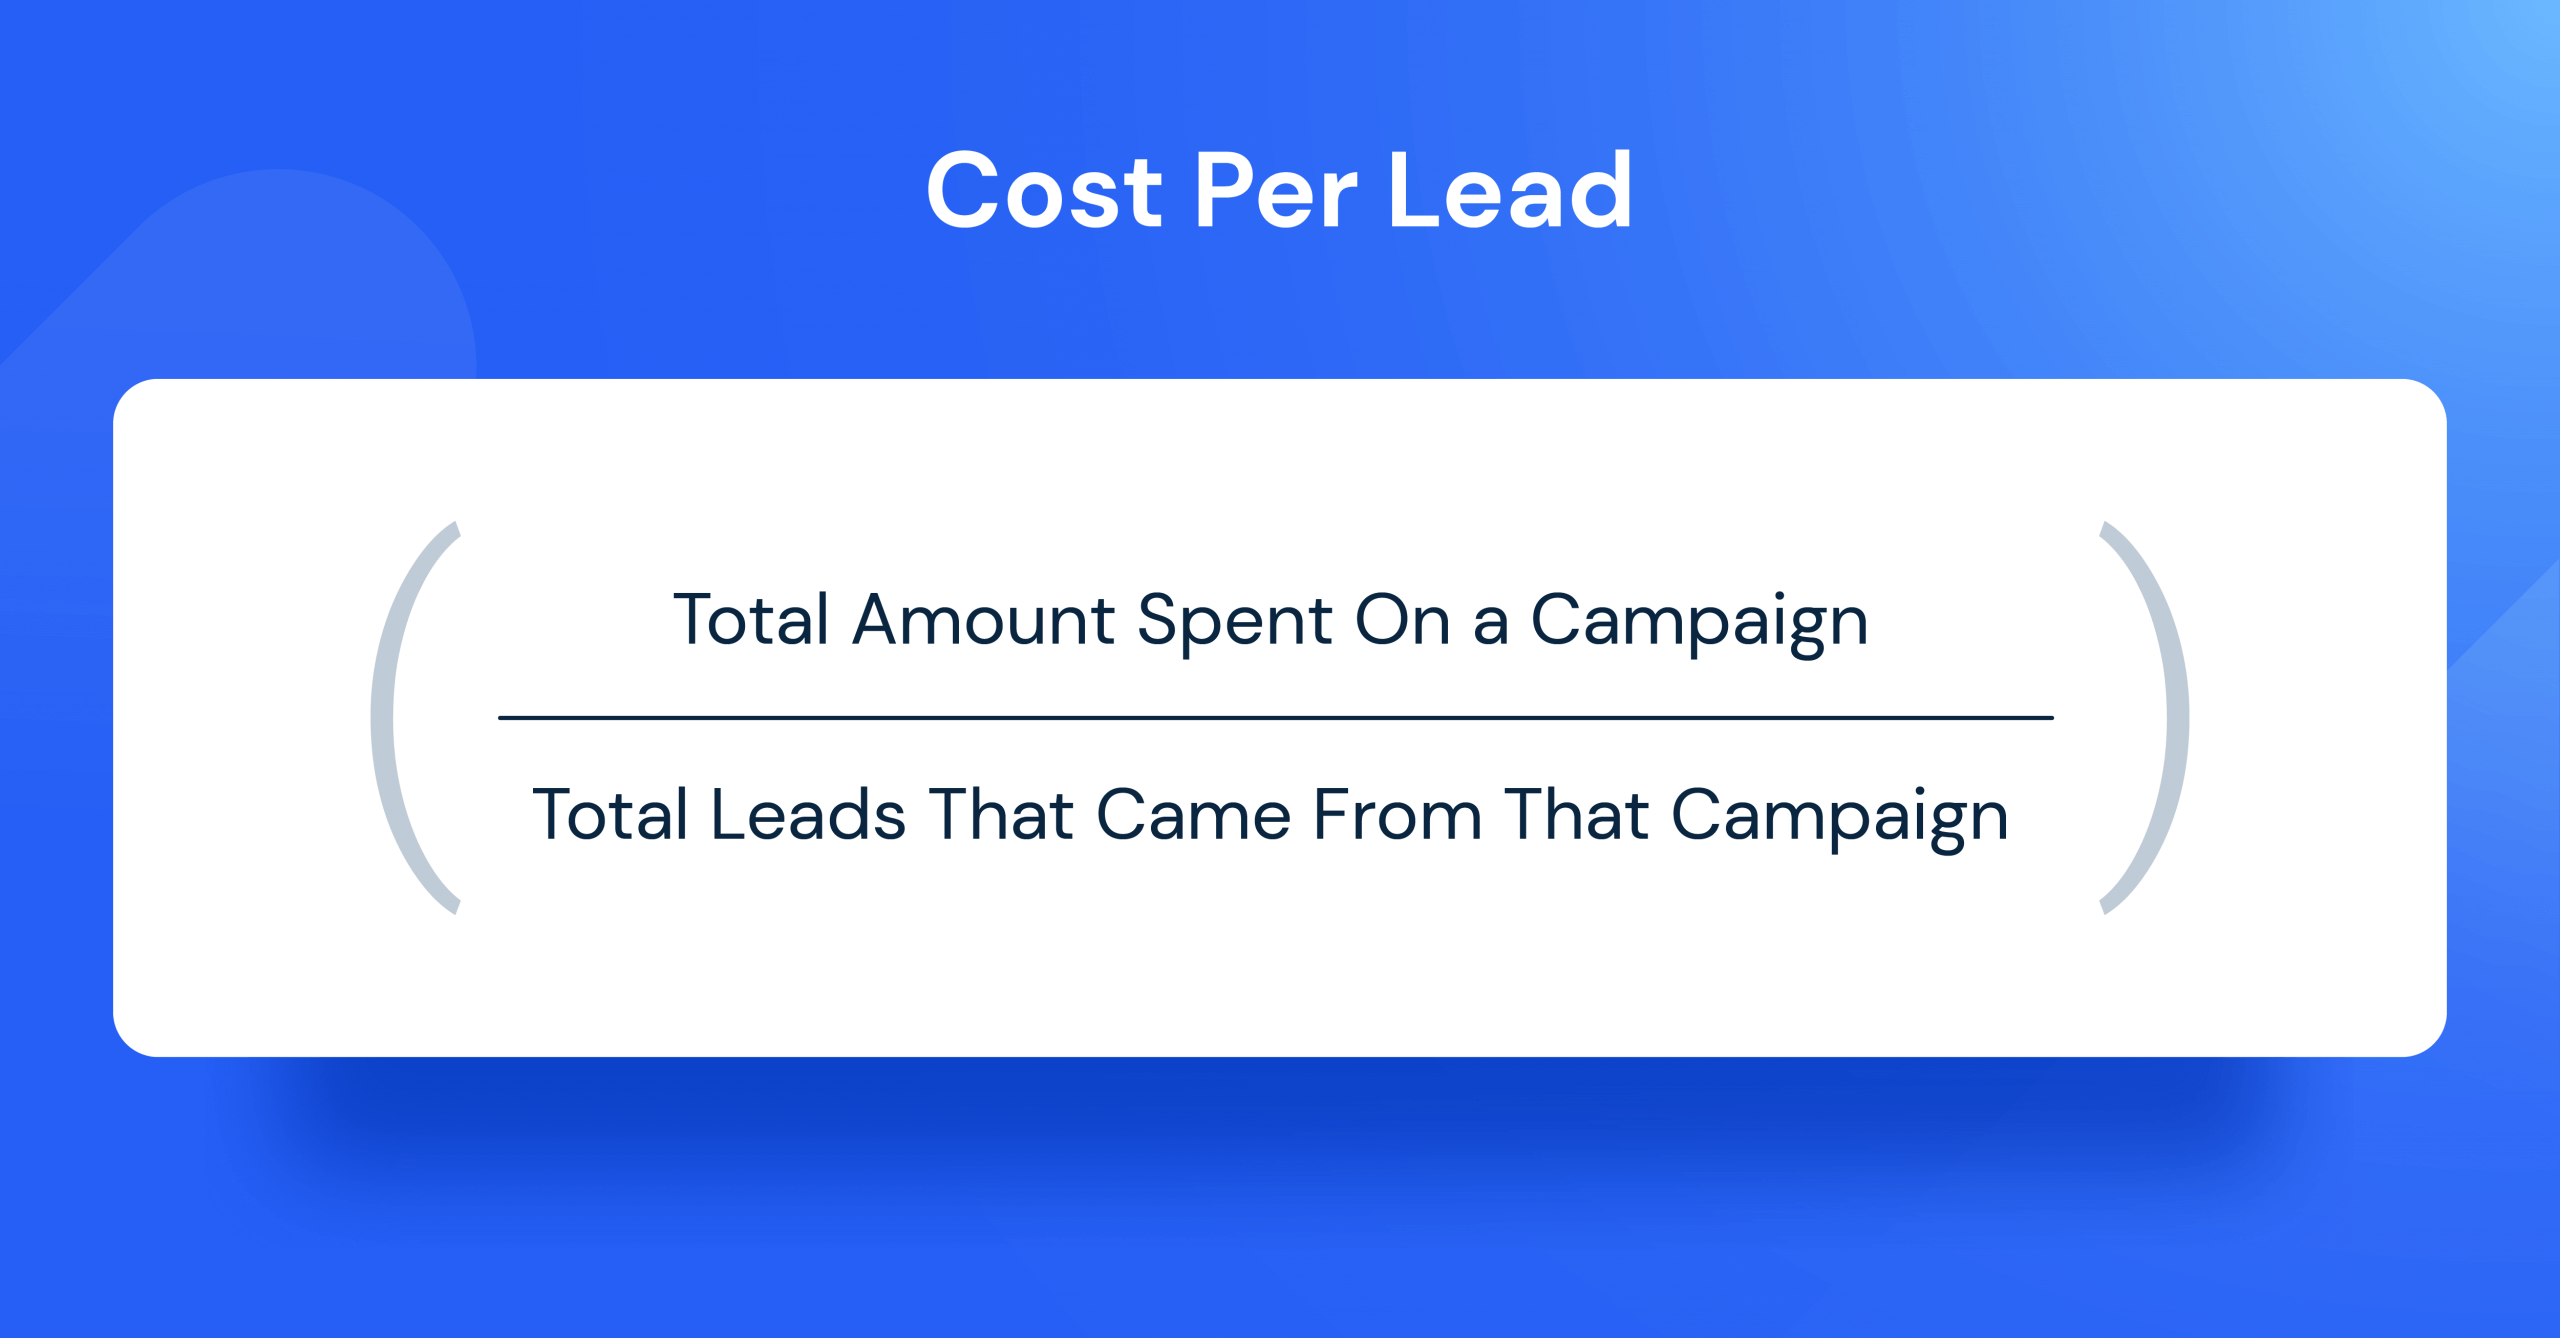
11. Cost per lead
The cost per lead (CPL) digital marketing metric measures how much you pay, overall, for each lead you generate.
Ultimately, it tells you just how effective your campaigns are at generating new sales leads and helps with understanding your overall return on investment (but more on that later).
If you want to be granular with it, you can set up attribution models to see which channels contribute the most to lead generation and therefore assign more money to activities or campaigns on those channels.
For instance, if you were to use a first-touch attribution model, the first channel that the lead used to find your business would be allocated 100% of the revenue gained (if they become a customer). You can then use this information to improve, optimize, or scale up your efforts on that channel.
Revenue metrics
12. Customer acquisition cost
This digital marketing metric differs from CPL in that it focuses on how much it costs to generate a customer, rather than a lead. Though these terms are sometimes used interchangeably, customer acquisition is much further down the sales funnel. It’s also referred to as “cost per acquisition” (CPA).
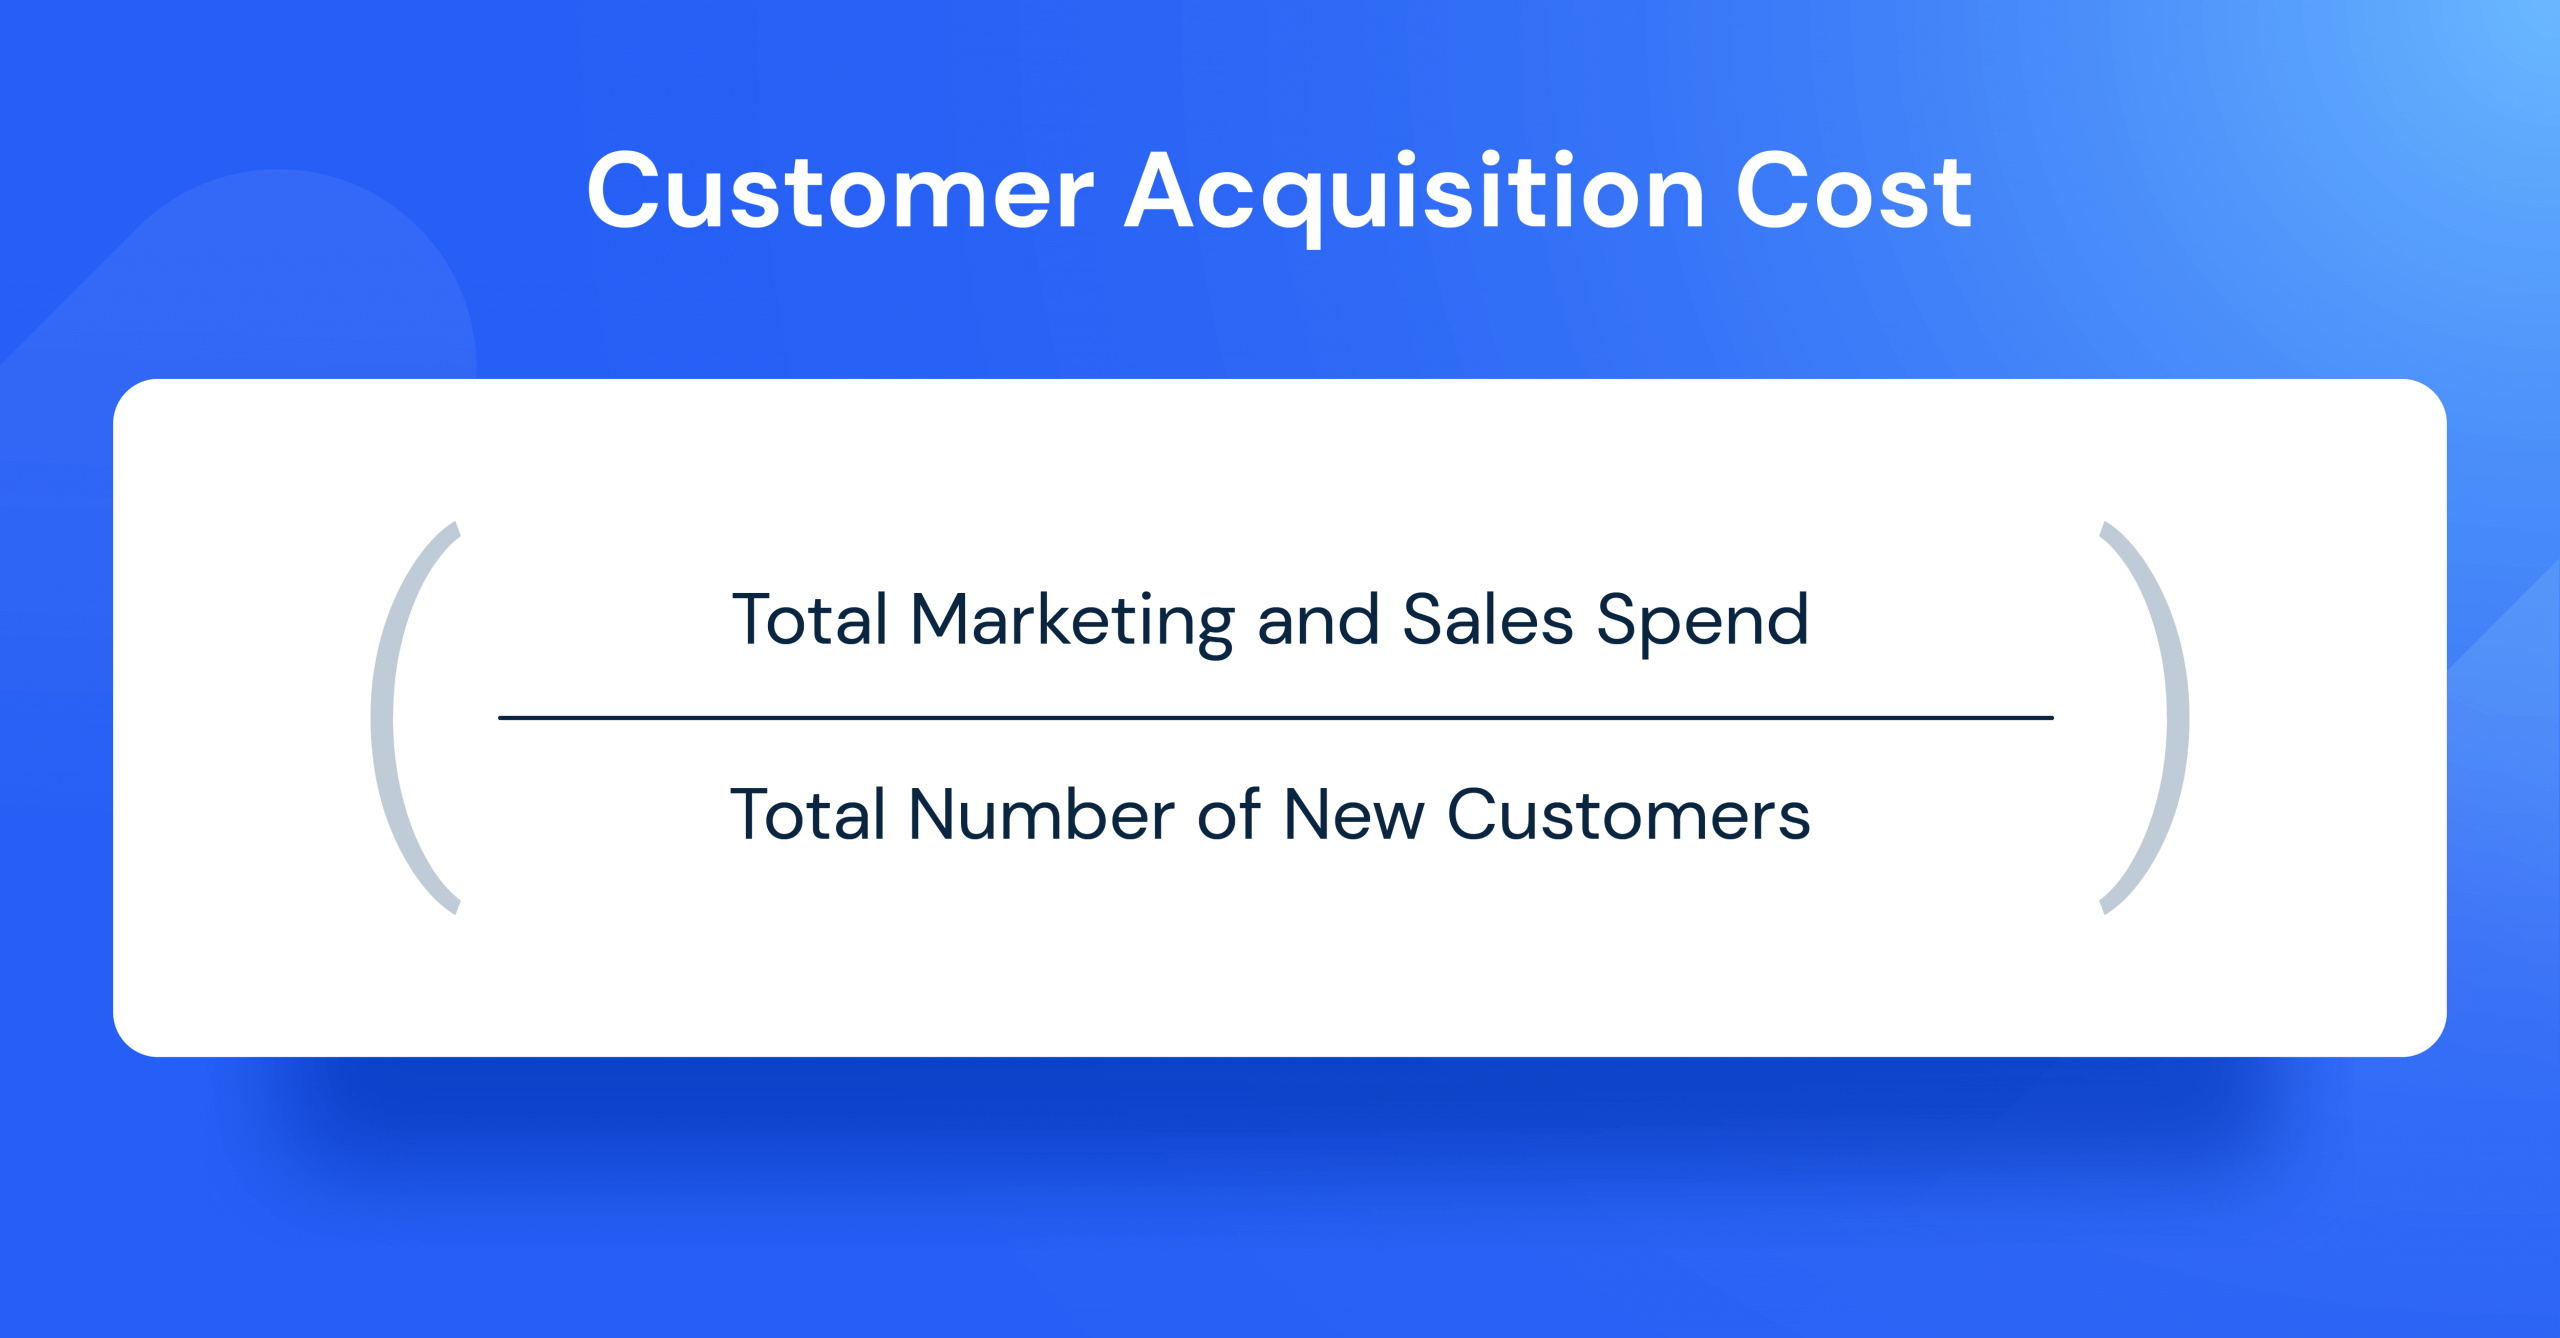
So how do you go about calculating customer acquisition? Well, you divide the total money spent to acquire new customers via a specific channel/campaign with the total number of new customers acquired via that channel.
For example, you might spend $200 to get 30 leads and get five customers. However, each customer is worth thousands to your business if they buy your product or service. So that cost might be seen as sustainable.
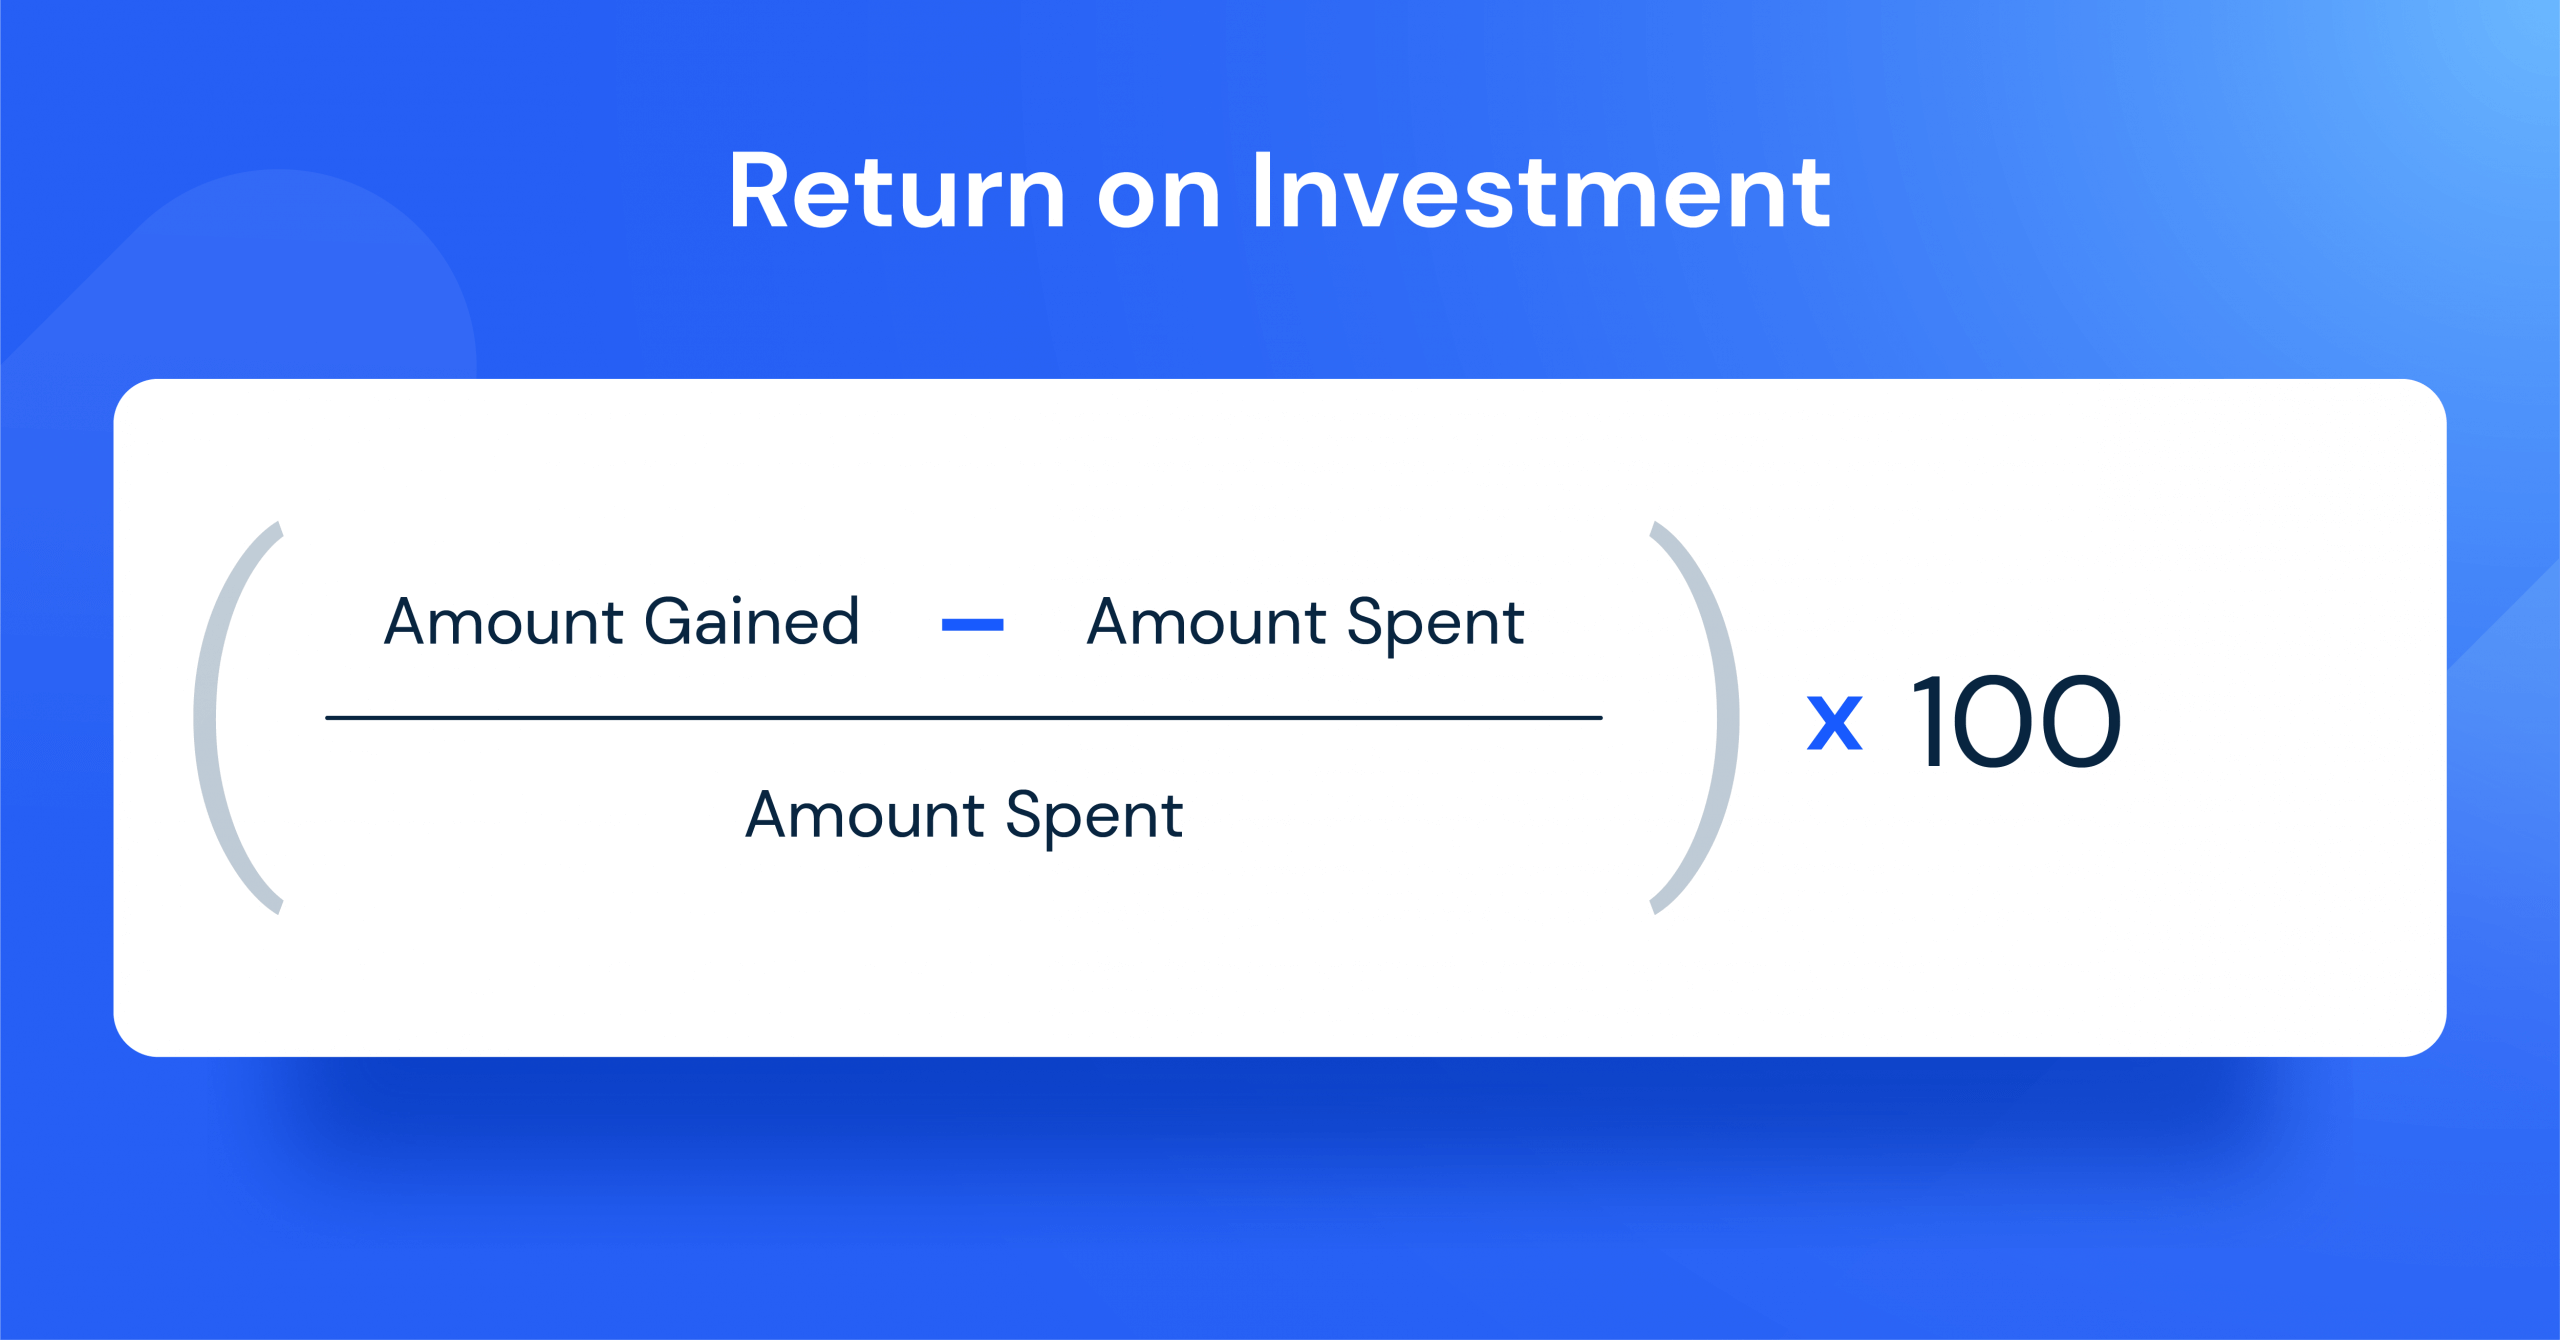
13. Return on investment
The main digital marketing metric for the board – the one that everyone’s talking about and wants to see every quarter: return on investment (ROI).
ROI tells you whether you’re getting your money’s worth from your marketing campaigns, but to measure it accurately you need the right tools as not every campaign will be focused on conversion.
For example, do you know which channels drive the most leads and customers for your business, as well as how much it costs you to generate those leads and customers? Similarly, you might find it difficult to attribute social activity and content marketing to your overall revenue. Where do you start?
Ultimately, you can use a combination of conversion metrics: conversion rate, cost per lead, and cost per acquisition, for instance, to get a better idea of your overall ROI based on specific activities.
Improve your digital marketing strategy by benchmarking metrics
With our digital marketing intelligence solution, your entire marketing team has access to the insights they need to create successful campaigns and the largest global behavior data set in the world, allowing them to react to trends in real time.
Benchmark your paid and organic traffic and engagement performance against your competitors and industry, reveal your competitors’ ads (search, PLAs, display, and video) for any period, and see which publishers and ad networks work best for your competitors.
Digital marketing metrics bottom line
Armed with the right real-time data, analytics, and behavioral information, our competitive marketing intelligence solution will help you to continually improve your marketing activities.
If you want to understand your customers and optimize your campaigns, just make sure to reference this article from time to time plus use the appropriate tools, like Similarweb.
This blog post was written with Aaron Carpenter.
Digital marketing metrics FAQs
What are digital marketing metrics?
Digital marketing metrics are the values used to measure and track the performance of marketing campaigns. Marketers use several tools to track this performance of website traffic, engagement, conversion, and revenue metrics.
Which are the most important digital marketing metrics?
The four core pillars of digital marketing metrics you should measure are: traffic (all and channel mix), engagement (engagement rate, bounce rate, pages per session), conversion (conversion rate, click-through rate and cost per conversion) and revenue (cost and ROI).
How do I calculate my engagement rate for social media?
You can calculate your engagement rate by dividing the total amount of likes, comments, and shares by your total followers, and multiplying your answer by 100.
How do I calculate the cost per click?
You can calculate the cost per click by dividing the total amount of spend by the total measure of clicks.

Related Posts


Your full marketing toolkit for a winning strategy
The ultimate solution to help you build the best digital strategy