Big Data Visualization: Turn Complex Data into Insights

Your report deadline is looming. You’re wading through endless rows and columns of spreadsheet data. The numbers are there, but how do you make them speak? How do you celebrate the wins and explain the losses in a way that sparks better strategies? Enter big data visualization. With the right tools, you can transform dry, lifeless tables into dynamic charts and graphs that not only make sense of the data but also drive action. Let’s dive into how you turn this chaos into clarity.
What is big data visualization?
Big data visualization is all about turning numbers into narratives. It uses graphics—charts, graphs, and maps—to represent complex datasets. By analyzing and translating raw numbers into visual formats, you can uncover trends, patterns, and anomalies at a glance.
Thanks to an array of visualization tools, even the most overwhelming spreadsheets can be
Why APIs Are Game-Changers for Big Data Visualization
APIs (Application Programming Interfaces) act as the glue that connects data from multiple sources, feeding your visualization tools with the information they need. Here’s how they elevate the process:
- Real-Time Data Integration
APIs enable your visualizations to reflect real-time changes. Whether you’re tracking website datasets or sales numbers, APIs ensure the data you’re seeing is always current. - Handling Complex Data Loads
APIs are designed to handle massive datasets without breaking a sweat. They allow visualization tools to process raw, structured, or unstructured data seamlessly. - Improving Data Quality
With the right API integration, data is filtered and secured before visualization, ensuring what you see is accurate and meaningful.
In essence, APIs make big data visualization more dynamic, scalable, and reliable—essential for complex data management.
Why Is Big Data Visualization Important?
They say a picture is worth 1000 words. One study says that 65% of the human population are visual learners and that graphics transmit messages faster. So, visualizing big data is key when it comes to serving up the insights the numbers represent. It’s about clarity, speed, and better decision-making. Here’s why it’s indispensable:
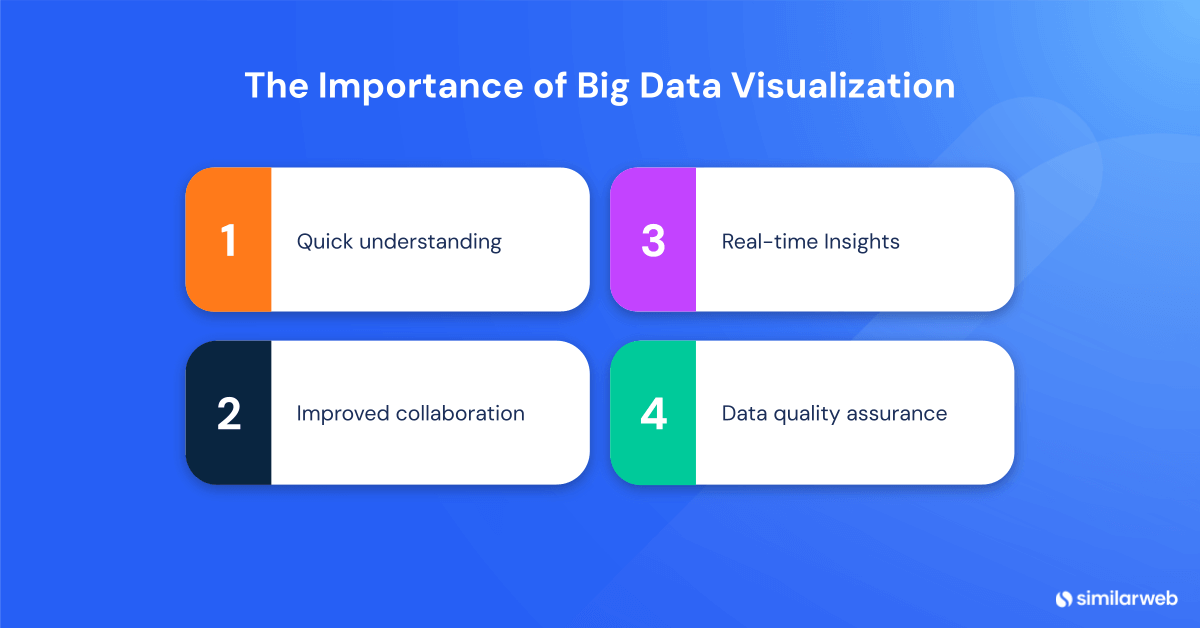
- Quick understanding
Charts and graphs reveal trends and anomalies instantly, cutting through the noise and enabling faster decisions. - Improved collaboration
Visuals simplify complex data, making it easier for cross-functional teams to grasp insights and act together. - Real-time insights
Modern visualization tools integrate live data, helping businesses react quickly to changing circumstances. - Data quality assurance
Visualizing data can flag errors—like unexpected spikes or anomalies—early in the process, maintaining data integrity.
Big data visualization using Similarweb datasets
When it comes to actionable insights, Similarweb’s datasets are unmatched. With our Data as a Service solution, businesses can access vast amounts of real-time digital data and feed it directly into their visualization tools.
Similarweb’s APIs automate the flow of data, ensuring real-time updates and seamless integration with your preferred visualization frameworks. With our Google Looker Studio Connectors or implementing our data with the tool of your choice, you can transform Similarweb’s data into visually compelling insights.
Whether it’s website traffic trends, audience demographics, or keyword performance, Similarweb’s DaaS lets you extract and visualize the data you need to make smarter decisions.
Ready to Bring Your Data to Life?
Big data doesn’t have to feel overwhelming. By transforming raw datasets into meaningful visuals, you unlock new opportunities for smarter, more effective decision-making. That’s the power of Data as a Service (DaaS)—providing the flexibility to access, analyze, and visualize the data that matters most to your business.
Whether you’re diving into website traffic trends, audience demographics, or keyword performance, Similarweb’s DaaS solution ensures you have the data you need, delivered seamlessly via APIs, to create the custom visualizations that drive insights.
Curious about how DaaS can work for your business? Speak with a Similarweb data expert today to explore how real-time, high-quality datasets can help you turn complex data into actionable intelligence. Let’s chart your path to smarter decision-making.
FAQs
How does data visualization facilitate better decision-making?
Whether by graph or chart, data visualization conveys raw numbers in a more comprehensible way so that stakeholders can easily spot underlying trends, patterns, or anomalies. This clarity promotes faster, more accurate, and more informed decision-making, yielding better business outcomes.
What are the common visualization types used in big data?
Big data is often visualized in line charts, bar charts, heatmaps, pie charts, and scatter plots. Each type is used to interpret different types of data, such as depicting trends in time, comparing categories, distribution, or relationships between variables.
Why should businesses prioritize data quality in visualization?
Maintaining high data quality thus assures that visualizations comply with high standards for clarity, legibility, and reliability. Reliable visualizations are fundamental as they directly affect the insights you draw from them, which will then be used to make business decisions and strategize.
What are the challenges of big data visualization?
Key challenges for big data visualization involve coping with the complexity and variability of data (e.g., data quality, multi-source data integration, meaningful visualization techniques), as well as performance and scalability. Without the right tools, expertise, and strategies, visualizations may fall short of delivering the value that big data promises.
How can someone start with big data visualization?
First, try big data visualization with tools and techniques that are right for your type of data and your analysis tasks. Start with simple visualizations, such as bar charts, line graphs, and tables, and later move on to more dynamic formats, such as interactive dashboards, as you get more comfortable with them and become more skilled.
Maximize your growth potential
Harness the power of data with Similarweb’s APIs to drive smarter business decisions


