May Update: What’s New in Digital Research Intelligence

Check out what’s new for data-driven digital researchers, from the latest enhancements in Industry Analysis to powerful new ways to analyze website segments.
Boost your industry research with fresh data, search trends, and channel leaders
1. Month-to-Date filter
Analyze fresh insights on market trends and view the latest data.
Now you can filter by Month-to-Date on the Industry Trends page to analyze the latest insights, stay up-to-speed on how traffic share changes over time, and identify new trends in near real-time.
Let’s look at an example of how analyzing Month-To-Date across the travel industry unlocks actionable insights for market researchers. You can see in the chart below, performance in the U.K. has dipped significantly since December 2020 but as the industry recovers, strategy teams and BI analysts can quickly identify who is gaining traffic share for weekly reporting and how it’s changing over time.
2. Search trends
Identify the search interests of your audience within your industry.
With this new feature you can discover which keywords are trending in your website category, based on the search interests of your audience and the market demand for a specific category, brand, or product.
When analyzing what people search for on the web, consumer insights professionals can use search interests to understand online behavior and what is trending. For example, below you can see the trend for diet-related search terms within the Nutrition industry in the U.S. over the last 12 months. Notice how the volume of searches changed in May with top search terms including ‘diet plans’ and ‘weight loss diet’, as well as branded keywords of the traffic leaders for these terms.
3. Industry rankings
Discover market leaders per channel to identify top players and monitor changes.
Analyze the top leaders in search, social, display, referral, direct, and email within your industry to track competitors and partners across each marketing channel. With our Industry Ranking feature you can quickly spot which player is gaining traction for each channel and make strategic investments and real-time shifts in your digital marketing strategy.
In the example below, we can see the top Email Leaders for the TV, Movies, and Streaming Industry in the U.S. You can see that YouTube has 57% of the traffic share, followed by Xfinity (22%), and Netflix (2.5%) which provides an instant snapshot of how the top players perform across the marketing mix and where they are gaining traction.
Analyze website segments across regions to understand market demand
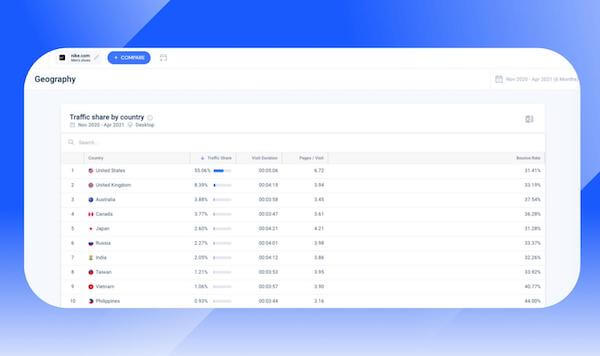
We recently released Geography for Segment Analysis, enabling researchers and digital strategists to analyze traffic share per country for a subsection of a website. This gives you a unique view when analyzing segments for a specific product, brand, or topic and details how they gain traction in each region over time.
Check out these latest features by logging into your Similarweb account or get in touch with our product and data experts for a live demo.
Stay tuned for upcoming releases each month.
The post is subject to Similarweb legal notices and disclaimers.
Wondering what Similarweb can do for you?
Here are two ways you can get started with Similarweb today!


