Top Ecommerce Companies (and Top Fastest-Growing Companies) – The Global List
Selling to ecommerce companies? Then, you’ll want to keep a close eye on the top performers in the space.
That’s exactly why we compile — and regularly update — these two lists of the top ecommerce companies in the world and the fastest-growing ecommerce companies. (If you want more, we’ve got lists for the UK’s top ecommerce companies and the US’s top ecommerce companies, too). After all, you’ve got to keep that digital sales strategy sharp to win big.
Through our traffic data, we saw the following trends in January 2025:
🛍️ Marketplaces continue to dominate the top five ecommerce companies
🎯 Paid search is less of a priority
🌎 Regional traffic is key to a company’s continued growth
So, which ecommerce brands are leading in website traffic? And which ones are rising fast? This blog presents the top 50 ecommerce companies and the top 50 fastest-growing ones, with granular insights for the top five of each.
Top ecommerce companies in the world
Here’s a brief look into what you’ll find in the full downloadable list of the top 50 ecommerce companies in the world:
| Rank | Company | Monthly Visits | HQ country |
| 1 | Amazon.com, Inc. | 5,861,325,134 | United States |
| 2 | eBay | 1,149,346,877 | United States |
| 3 | Temu | 1,077,634,080 | United States |
| 4 | Samsung Electronics | 1,009,328,464 | Korea, Republic of |
| 5 | AliExpress limited | 752,096,995 | China |
| 6 | Shopee Pte. Ltd. | 749,827,410 | Singapore |
| 7 | Rakuten | 708,369,727 | Japan |
| 8 | Walmart Inc. | 536,420,757 | United States |
| 9 | Apple, Inc. | 512,097,368 | United States |
| 10 | Ozon | 436,713,095 | Russian Federation |
| 11 | Etsy, Inc. | 428,353,733 | United States |
| 12 | Wildberries | 365,997,148 | Russian Federation |
| 13 | IKEA | 267,642,818 | Netherlands |
| 14 | SHEIN | 235,740,809 | Singapore |
| 15 | The Home Depot, Inc. | 208,674,477 | United States |
The key data points we used to create this top 50 list of global ecommerce companies (so you can do it too with Similarweb Sales Intelligence) are:
- Geography: Worldwide
- Company Type: Ecommerce
- Ranked by monthly desktop & mobile visits in January 2025
The new Company Tab allows you to easily search prospects by company and access all their regional websites in one place. This streamlined view saves time and helps you identify top prospects more efficiently. To see the full list on the platform, scroll to the bottom of the filter options, select By Suppression Lists, and uncheck Exclude websites.
How can you make the most of this list as a salesperson?
- Getting familiar with the types of ecommerce sites bringing in the most traffic at the moment
- Sharpen your ecommerce industry expertise. Then, educate and inspire the rest of your sales team
- Spot emerging ecommerce challengers, and recognize the ones to watch
- Speak with greater authority to your prospects and clients in the ecommerce space
Download the full list here:
The world’s top 5 ecommerce companies
Using data from Similarweb Sales Intelligence, let’s examine why these five companies dominate the market and how they sustain their success.
1) Amazon
Amazon maintains the first-place spot. What is surprising is that year-over-year (YoY) Amazon traffic to its sites (35 domains) continues to drop, down another 3.75%. Month-over-month (MoM) visits also decreased considerably, falling 10.07%. With this decline, it’s important to factor in that the month-over-month comparison is with the end of the 2024 holiday shopping season in December. Monthly visits in January 2025 did reach 5.86B.
Let’s break it down by region.
United States
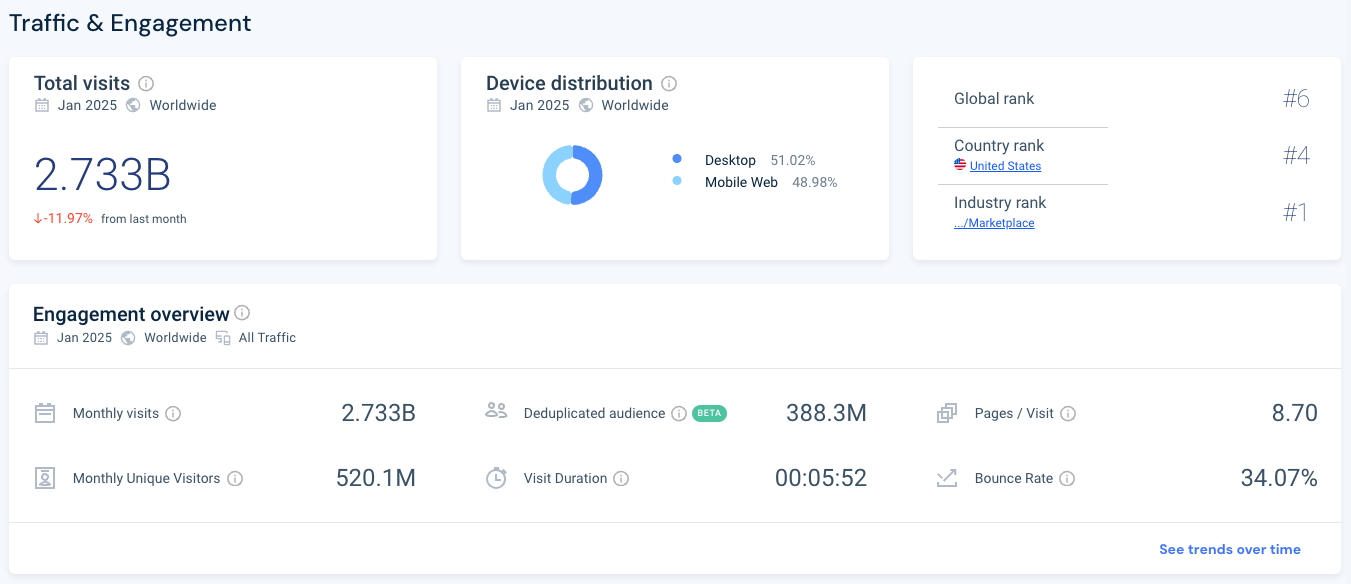
Amazon.com saw 2.7B visits in January, but that is a 4.5% decline YoY and an 11.97% decline MoM. Between January 22-31, the site saw its most significant decline, with visits dropping from 584M to 244M.
Japan
Visits to amazon.co.jp increased slightly, .97%, from 572M to 577M. However, visits declined by 4.03% MoM.
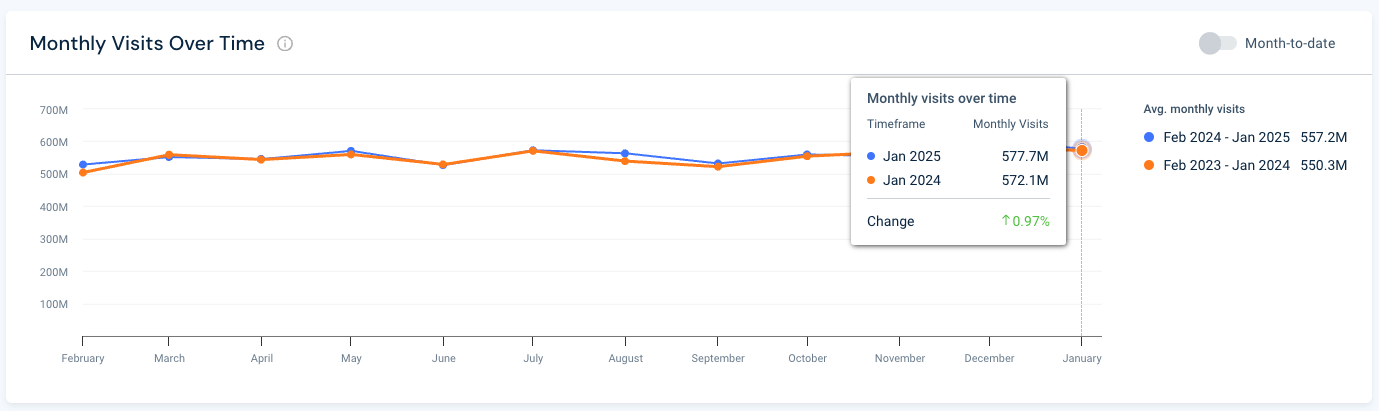
When looking at desktop visits, only 1.85M are new to the site. 24.69M are return visitors.
India
Amazon.in had 437.5M visitors in January, down only .41% MoM. What’s interesting is the drop in direct search traffic and the increase in organic traffic.
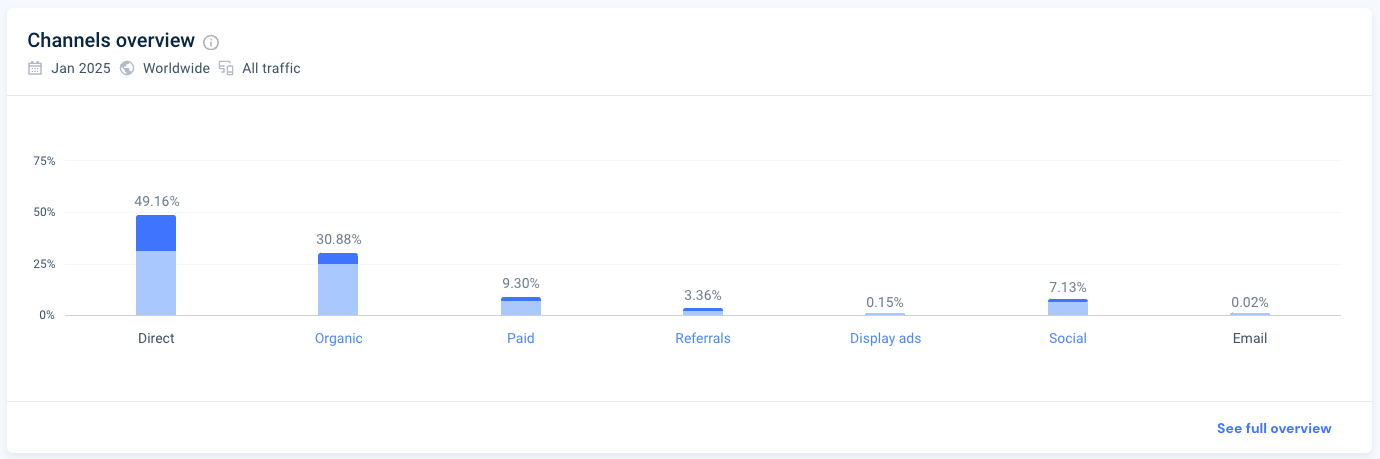
49.16% of its traffic is direct, and 30.88% is organic. In the US, 60.25% of visitors come from direct search vs. 22.98% from organic search. In a country of over 1.4B, Amazon faces a more competitive landscape, so it places more weight on its paid search and social strategies. Compared to the US, where 4.79% of traffic comes from paid search, Amazon.in gets 9.3% of its traffic from paid search.
Europe
Let’s take a look at how the UK and Germany factor into Amazon’s European landscape. All countries don’t have country-specific Amazon domains, although Amazon.ie 🇮🇪 will be launching this year.
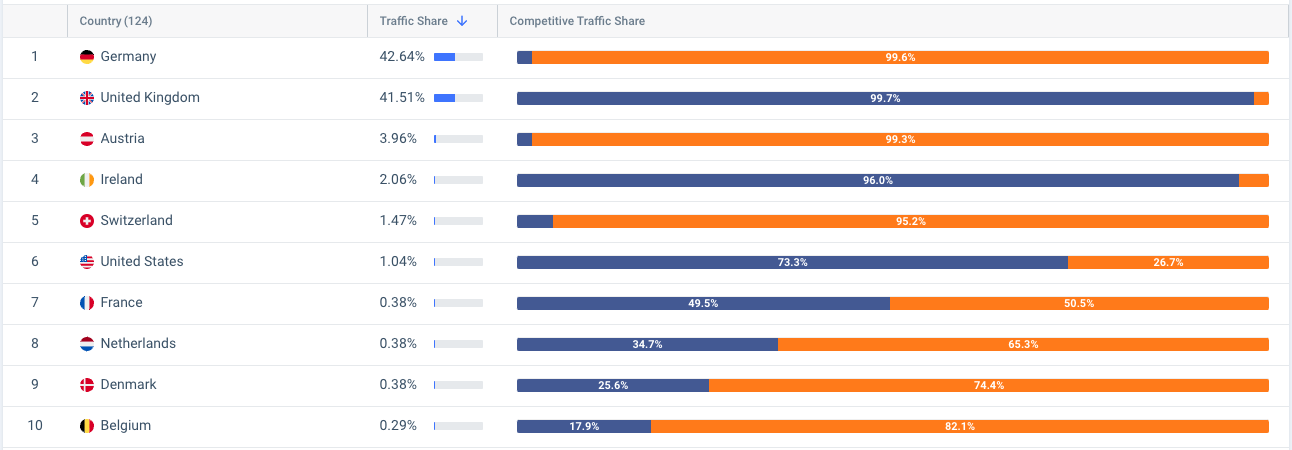
- Amazon.co.uk’s UK Traffic Share was 86.21% in January, down 14.28% MoM. The domain also pulls traffic from Ireland, which equals 4.13% of its traffic share, down 13.10% MoM.
- Amazon.de’s German Traffic Share stands at 81.7% but decreased 10% MoM. It also pulls traffic from Austria (7.55%, down 9.82% MoM), Switzerland (2.57%, down 3.16% MoM), and Denmark (.52%, down 3.18% MoM).
With Amazon’s vastly expanded offering as a general retailer, they have come to own the online retail business and continue to expand.
2) eBay
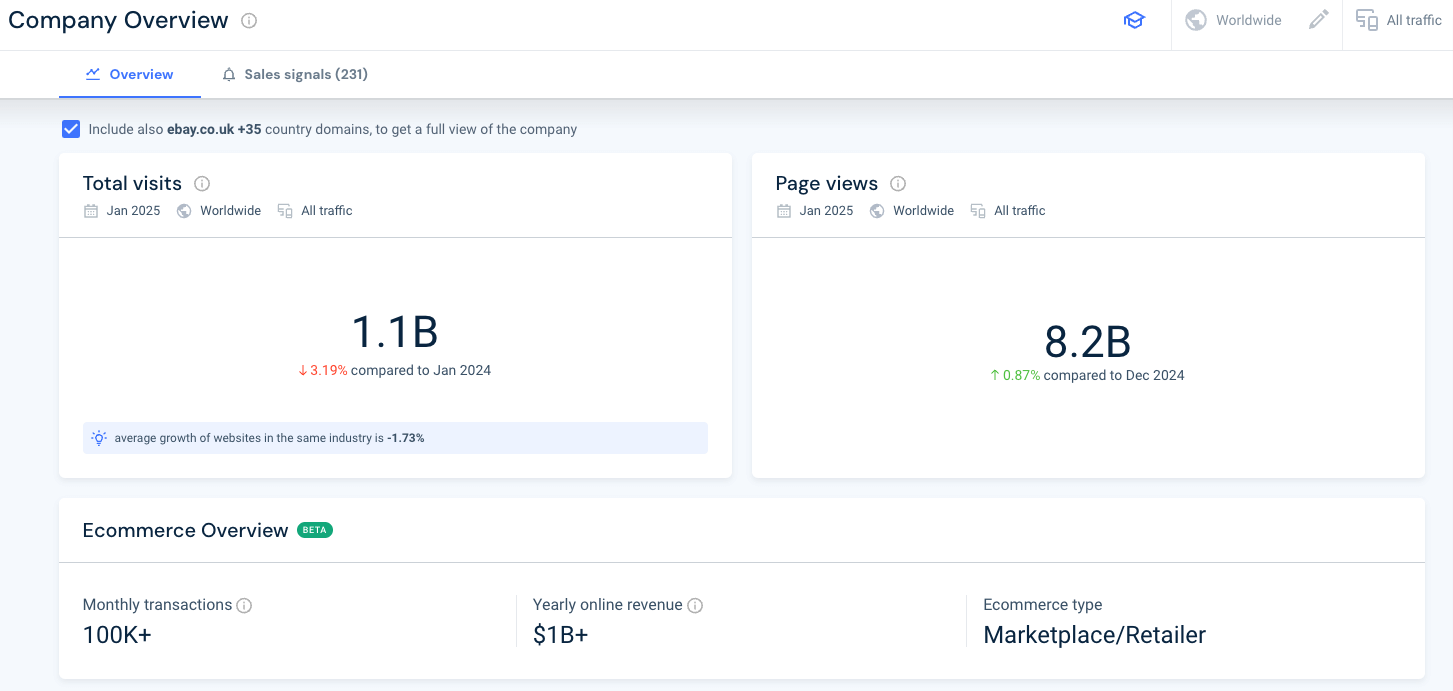
EBay has moved into the #2 spot, up from #4 six months ago, hitting 1.1B visits across its domains in January. eBay Traffic is down 3.19% YoY but is up .87% MoM.
The company’s partnership with Meta will see eBay listings tested on Facebook’s Marketplace platform, presenting a unique opportunity for the aptly nicknamed ‘recommerce’ giant. This is being piloted on specific listings in the US, Germany, and France, but so far, incoming referral traffic is coming from elsewhere.
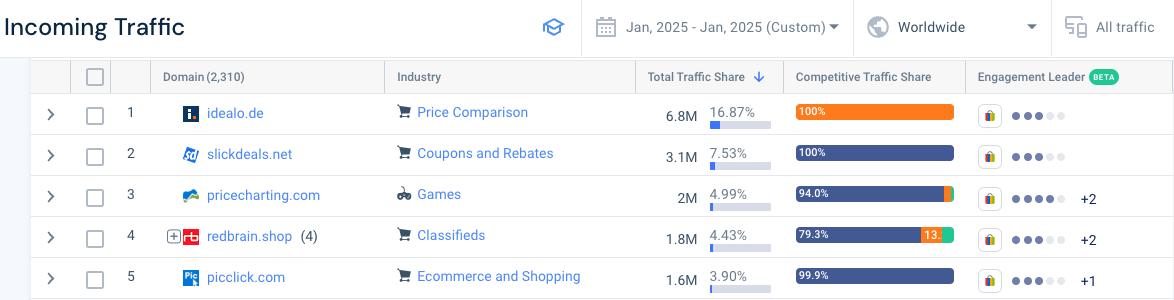
100% of traffic from idealo.de, a price comparison site, goes to Germany. 100% of traffic from slickdeals.net goes to the US. Redbrain.shop refers 79.3% to the US, 13.2% to Germany, and 7.5% to France.
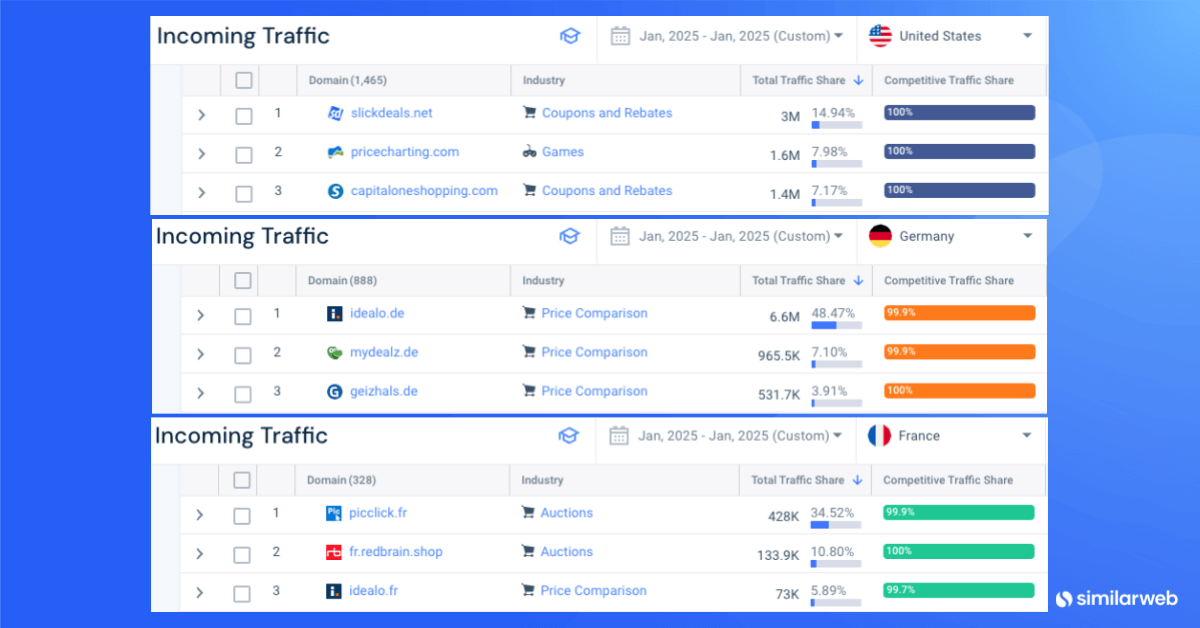
- In the US, the top three domains referring traffic to ebay.com are slickdeals.net and coupons and rebates site, pricecharting.com, a games site, and capitaloneshopping.com, also a coupons and rebates sit
- In Germany, the top three domains referring traffic to ebay.de are idealo.de, mydealz.de, and geizhals.de, all price comparison sites
- In France, the top three are picclick.fr and fr.redbrain.shop, both auction sites, and idealo.fr, the price comparison site
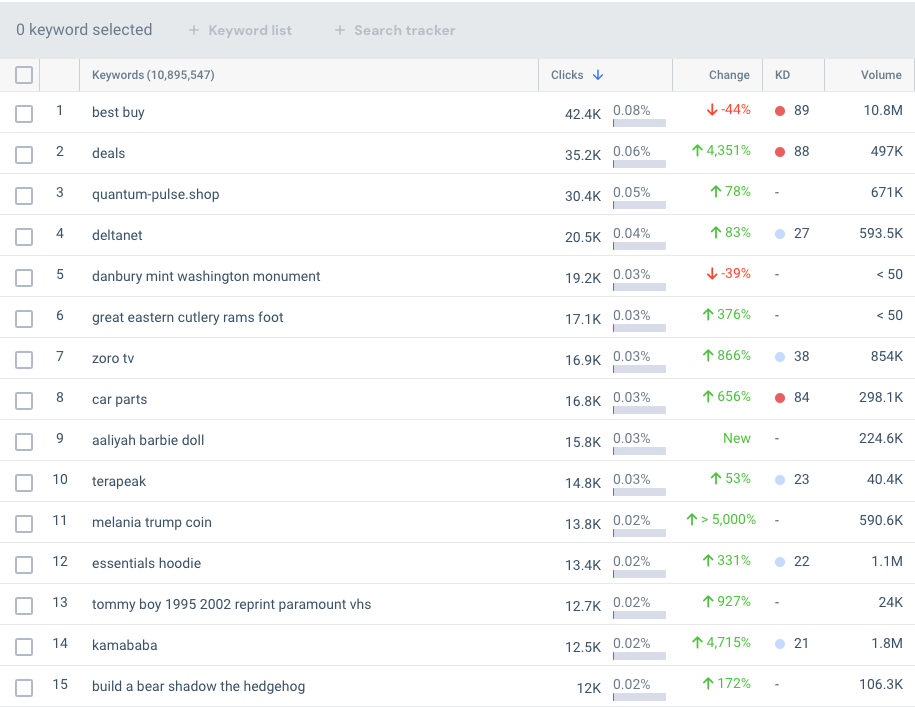
What keywords are driving global traffic to the ecommerce marketplace giant? Looking at non-branded keywords, “best buy” brought in the most traffic in January with 42.4K visits but saw a 44% MoM drop in performance. In second place is “deals,” bringing in 35.2K visits, and its MoM increased dramatically by 4,351%! Both are difficult to rank for in Google’s top 20.
The real insights come from the Similarweb Sales Intelligence Chrome extension and SAM, our Sales AI Model. SAM provides dozens of real-time, actionable insights for ebay.com, like:
“Understanding and analyzing these traffic patterns is crucial for eBay, as they directly impact market share and revenue potential. Recognizing where eBay stands among competitors can highlight areas for strategic improvement and opportunities to capture more of the online marketplace.”
Utilizing web traffic metrics and SAM’s actionable insights can positively impact revenue.
How else does eBay keep the revenue flowing?
Here are the most recently installed website technology:
- Advertising: LoopMe (installed September 2024) uses AI to improve brand advertising performance and outcomes
- Conversion & Analytics: Amplitude (installed June 2024) is a product analytics tool for web and mobile
3) Temu
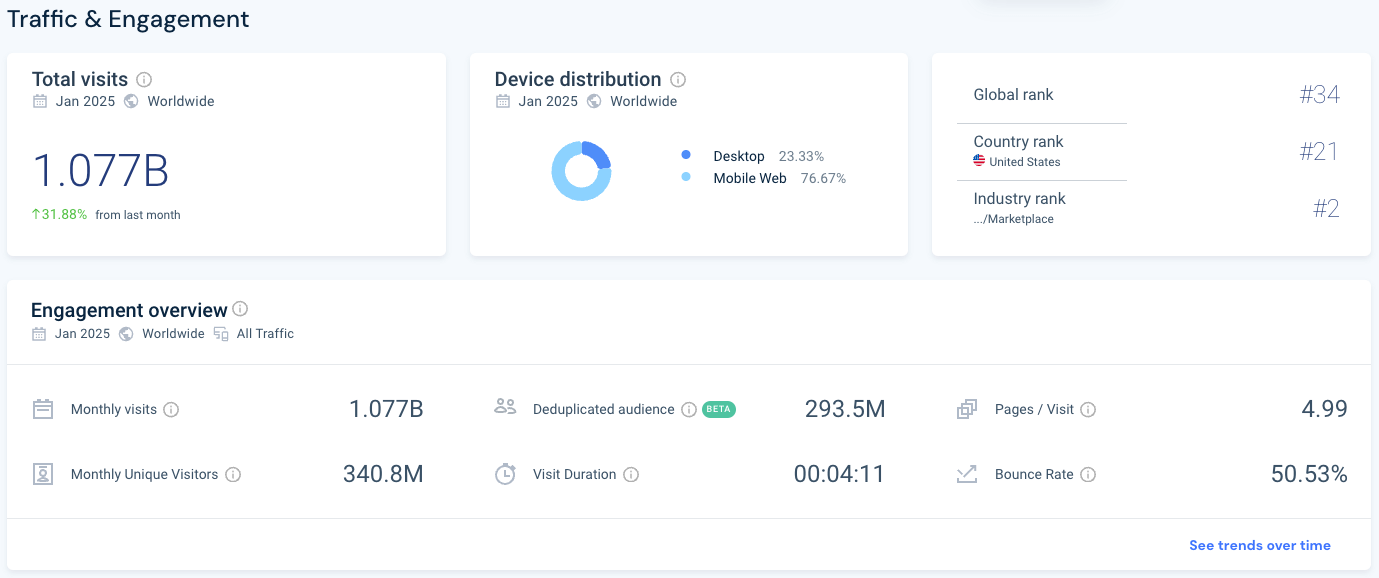
Temu keeps the #3 spot as the ecommerce marketplace remains a favorite with consumers worldwide. Temu.com’s MoM and YoY traffic continue their exponential growth—31.88% and 89.77%, respectively.
Where are all of these visits coming from? Temu has global appeal because, as its tagline proclaims, consumers want to shop like billionaires and can fill their carts to overflow without breaking the bank.
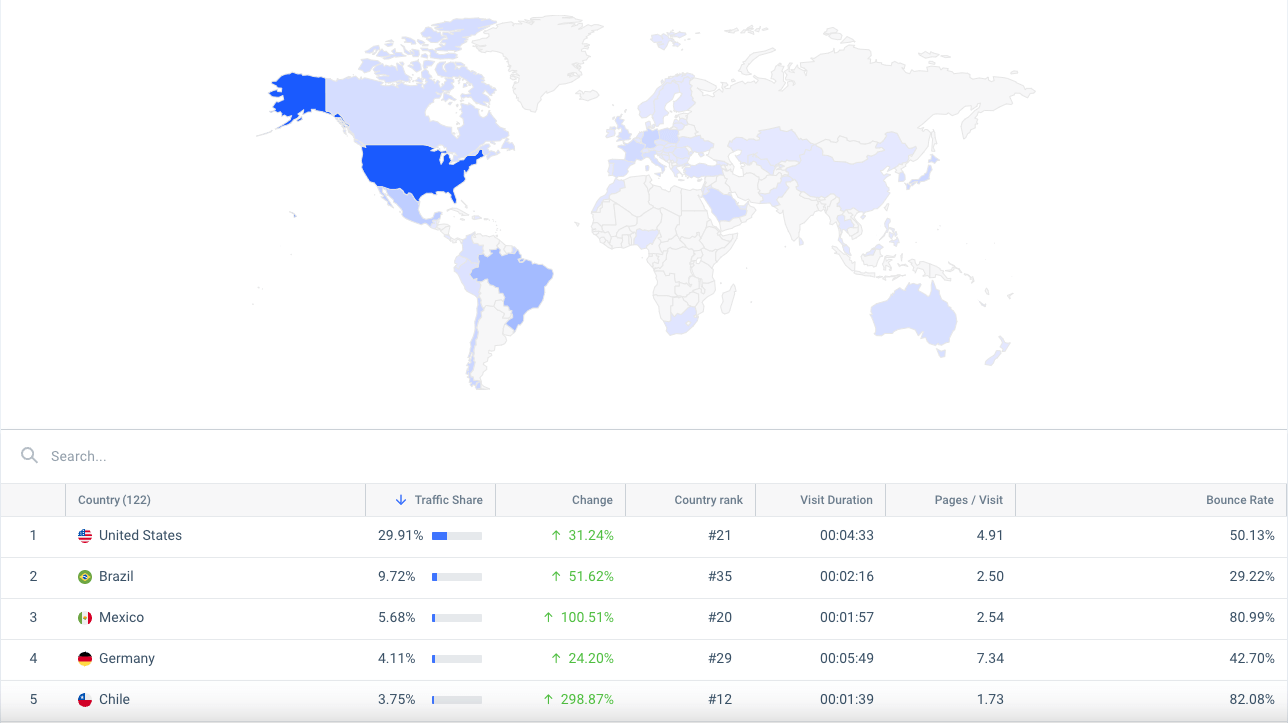
The top 5 countries feeding temu.com’s rising traffic in January 2025 are:
- US at 29.91%
- Brazil at 9.72%
- Mexico at 5.68%
- Germany at 4.11%
- Chile at 3.75%
But interestingly, those countries aren’t spending the most time in the marketplace. Zambia’s visit duration averages just under 26 minutes and 9 pages per visit. Azerbaijan’s visit duration averages just over 22 minutes and 31 pages per visit. Rounding out the top three for visit duration is Angola, averaging 19.5 minutes with 14 pages per visit.
So, who are these consumers, and where are they coming from? If you said social media, you’d be correct. This isn’t surprising when looking at temu.com’s marketing channels overview.
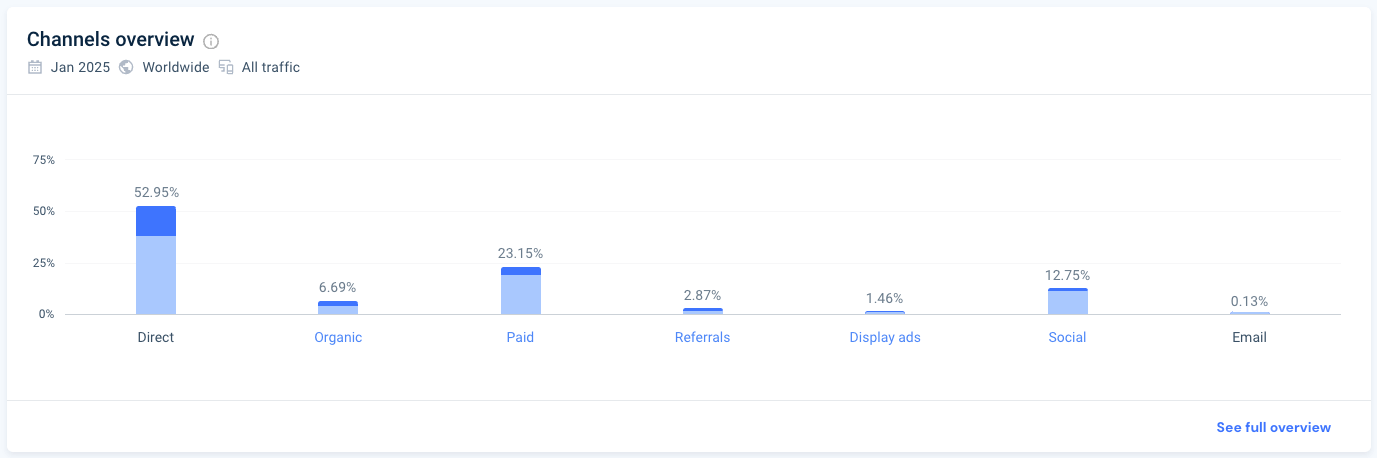
Direct search is the website’s main source of traffic, similar to Amazon and eBay. However, its paid search traffic is significantly higher, at 23.15%, and its social traffic is also significantly higher, at 12.75% (vs. amazon.com’s 4.79% and 5.7% and ebay.com’s 4.29% and 4.66%).
Digging deeper into the social media channel, eight of the top 15 domains of interest to Temu’s audience are the top social platforms:
- Facebook.com has a cross-visitation of 29.72%
- Instagram.com has a cross-visitation of 14.85%
- Reddit.com has a cross-visitation of 10.92%
- X.com has a cross-visitation of 9.10%
- Tiktok.com has a cross-visitation of 5.83%
What does SAM have to say about this (as seen in the Similarweb Sales Intelligence Chrome extension)?
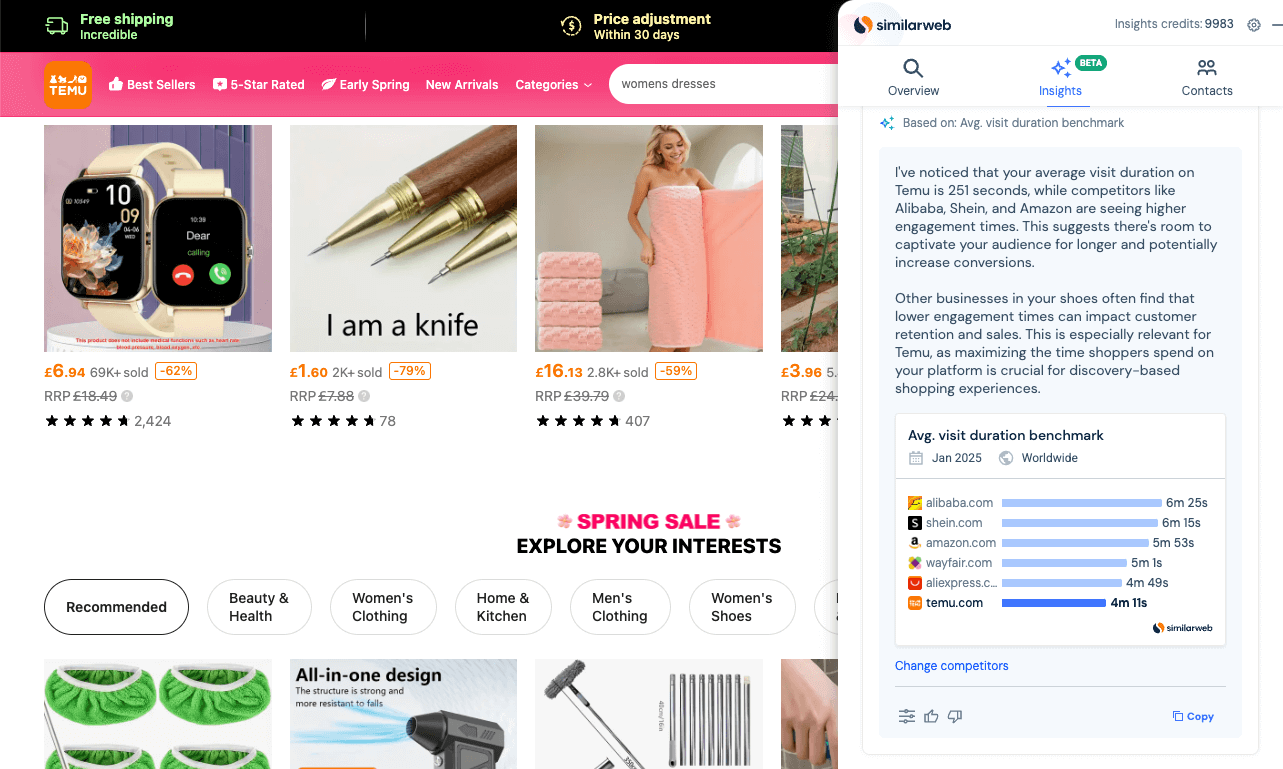
“I’ve noticed that your average visit duration on Temu is 251 seconds, while competitors like Alibaba, Shein, and Amazon are seeing higher engagement times. This suggests there’s room to captivate your audience for longer and potentially increase conversions.”
“Other businesses in your shoes often find that lower engagement times can impact customer retention and sales. This is especially relevant for Temu, as maximizing the time shoppers spend on your platform is crucial for discovery-based shopping experiences.”
These insights are key when your biggest competitor is Amazon.
Here are a few of the website technologies most recently added by Temu:
- Content Delivery Network: CloudFlare (installed December 2024) is a global CDN and DNS provider that can speed up and protect any site online
- Security: CloudFlare Bot Management (installed December 2024) ensures amazing web experiences for visitors and stops bots from performing credential and credit card stuffing, inventory hoarding, and price scraping, freeing up security teams to focus on other projects
4) Samsung Electronics
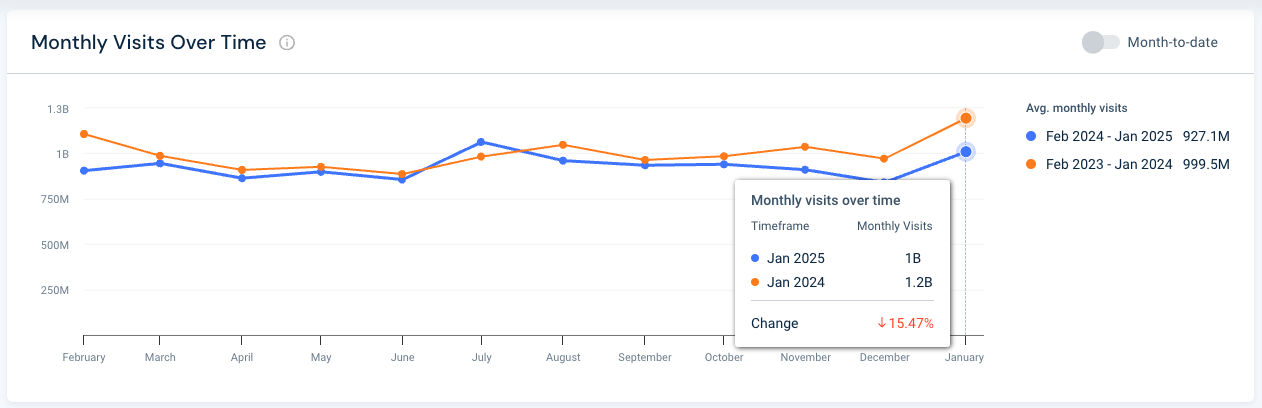
Samsung, the only company that is not a marketplace in the top five, moves to the fourth spot. Samsung’s traffic declined 15.47% YoY across all its domains compared to January 2024, but its -8.01% average growth is currently the industry standard. Its 20.17% MoM growth is stellar, considering Electronics Retail traffic curtails somewhat when holiday shopping ends.
Compared to some of its biggest competitors, Samsung ranks #45 globally, Apple ranks #85, Sony ranks #1,605, and LG ranks #2,066. However, based on product offerings, it’s not a 100% apples-to-apples comparison.
When it comes to samsung.com’s marketing channels overview, its biggest driver continues to be organic traffic over direct, 45.40% vs. 3037%.
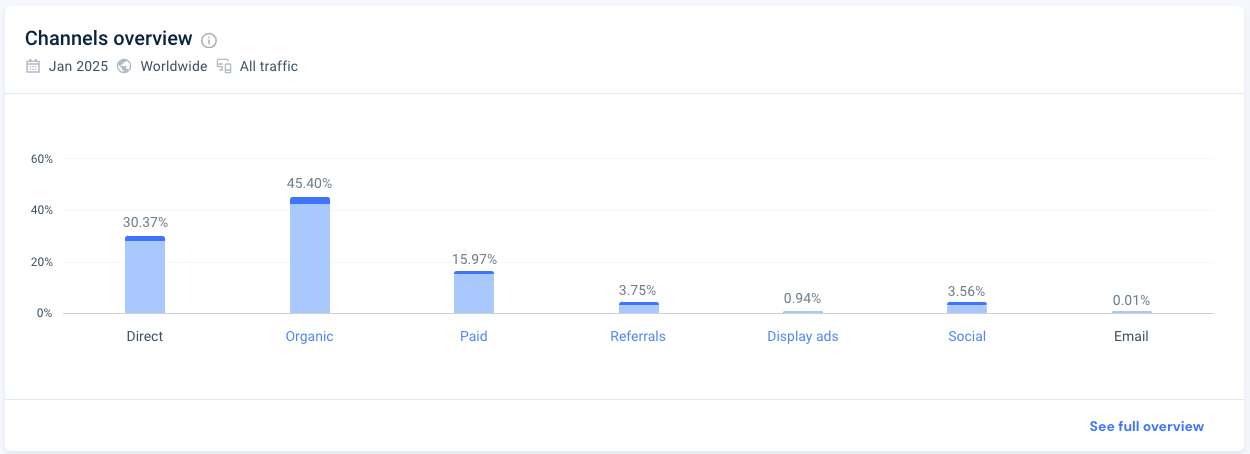
Paid search delivers 15.97% of traffic, followed by referrals and social, which deliver 3.75% and 3.56%, respectively.
Digging deeper into Samsung’s paid search strategy, we see that its paid search traffic is up 29% from last month. The company’s $56.8M spend was smart.
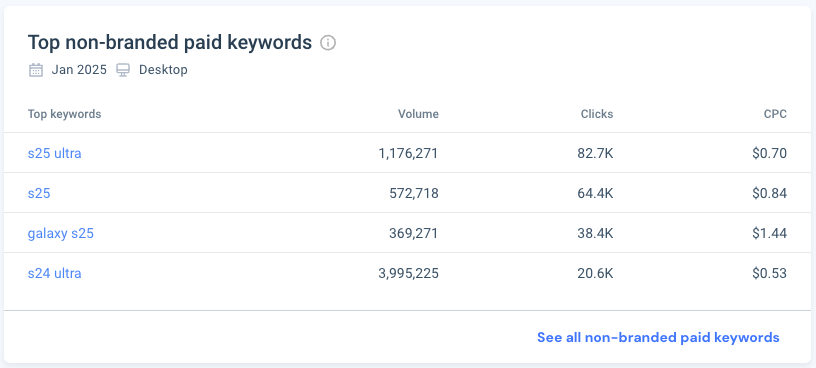
The company’s strategy still revolves around its smartphones. Its other products don’t rank in the top 20 non-branded paid keywords. “Samsung tablet” comes in at 21, “samsung watch” at 22, and “samsung tv” at 25.
While Samsung’s paid search spend accrued more traffic, was that traffic viable? Here’s what SAM has to say:
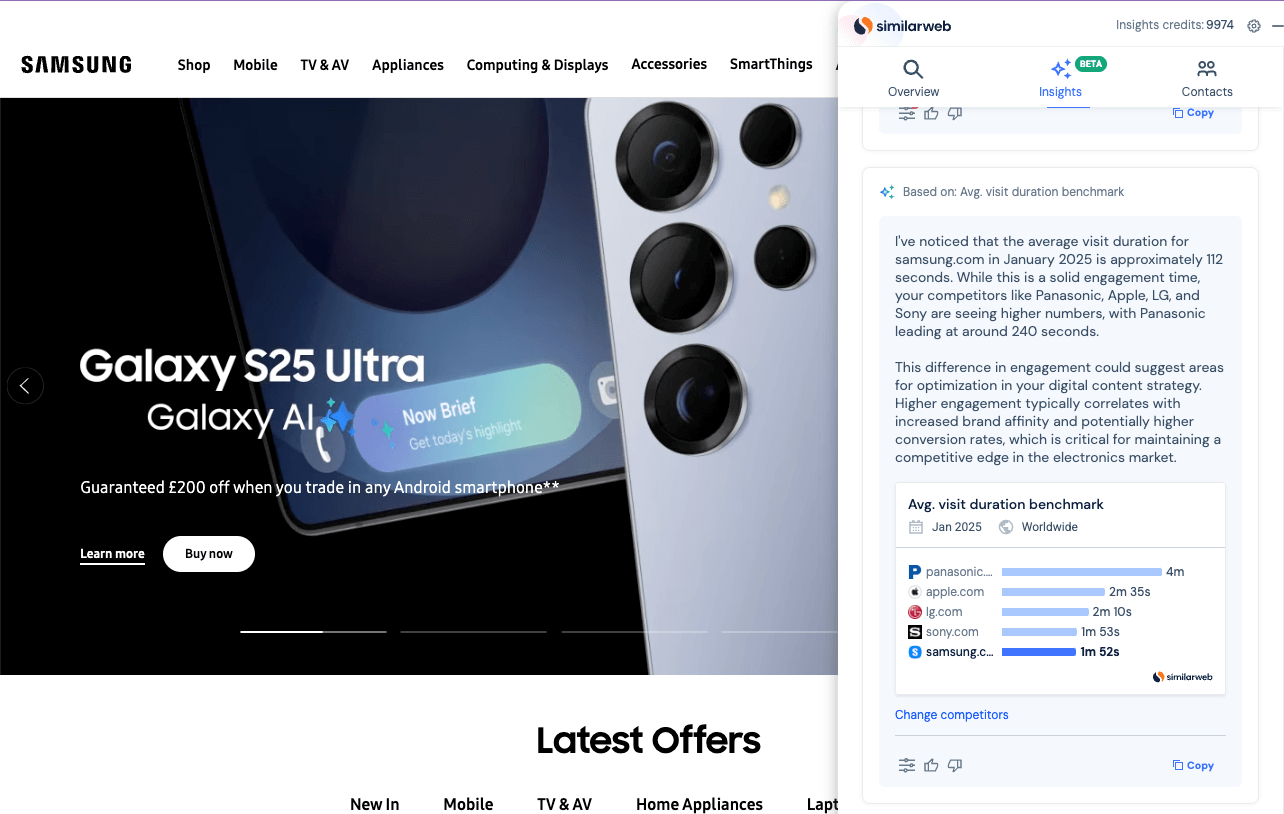
“I’ve noticed that the average visit duration for samsung.com in January 2025 is approximately 112 seconds. While this is a solid engagement time, your competitors like Panasonic, Apple, LG, and Sony are seeing higher numbers, with Panasonic leading at around 240 seconds.”
“This difference in engagement could suggest areas for optimization in your digital content strategy. Higher engagement typically correlates with increased brand affinity and potentially higher conversion rates, which is critical for maintaining a competitive edge in the electronics market.”
Now that’s a conversation starter.
What are some of the web technologies recently added by this electronics behemoth?
- Conversion & Analytics: Clarity (installed February 2025) is a behavioral analytics tool that turns user data into visual insights and shows which part of your website gets the most engagement
- Server: Microsoft (installed February 2025) develops software, services, and hardware devices that deliver new opportunities, greater convenience, and enhanced value
5) Aliexpress Limited
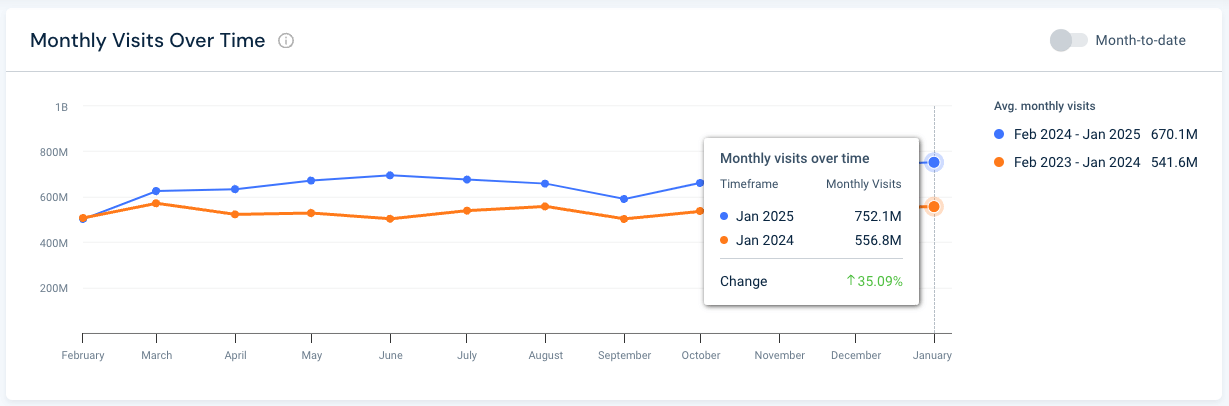
Finally, AliExpress Limited, with 752 M total visits, has moved into the #5 spot (previously at #4). This is up 35.09% YoY and 1.67% MoM. Aliexpress’ traffic continues to grow faster than the industry average (-1.73%).
Looking across all of the company’s domains, Russia has the largest traffic share, at 8.14%, up 3.45% MoM.
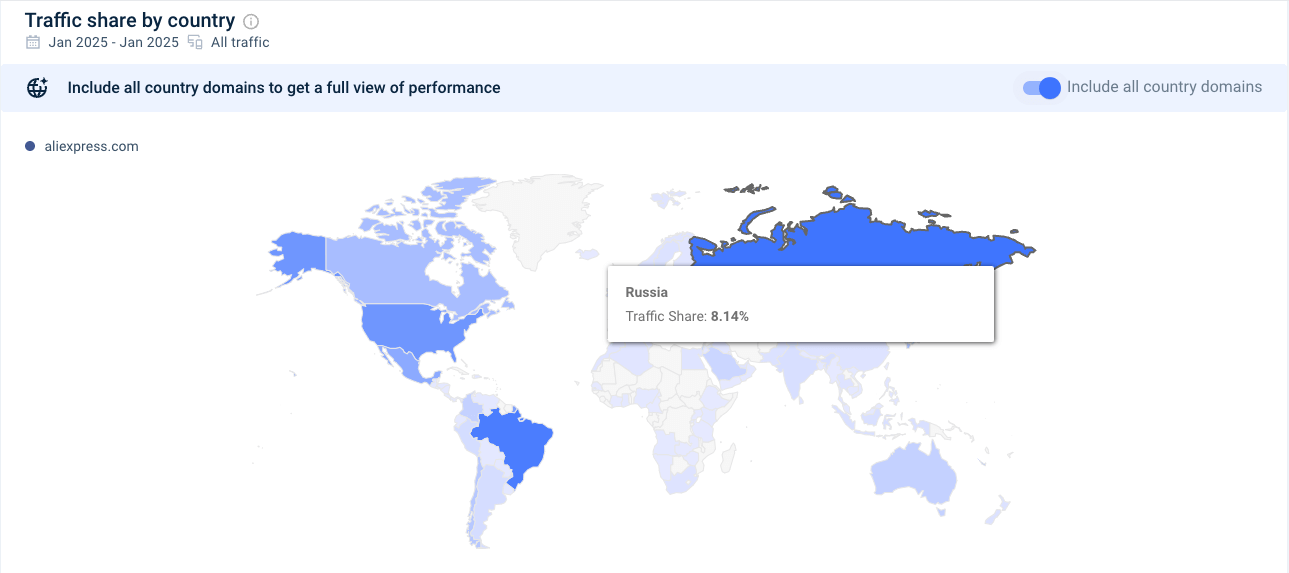
In comparison, when we look at the rest of the world, we can see that:
- Brazil represents 7.57% of the traffic share, up 6.53% MoM
- Republic of Korea represents 7.30% of the traffic share, down 10.97% MoM
- Spain represents 5.85% of the traffic share, down 2.53% MoM
- US rounds out the top 5 with 5.83% of the traffic share, down 2.54% MoM
Aliexpress.com gets 65.12% (445.1M) of its traffic from direct search, which is pretty evenly split between desktop and mobile web. Only 16.87% (115.3 M) comes from organic search, and 66% of that derives from mobile web.
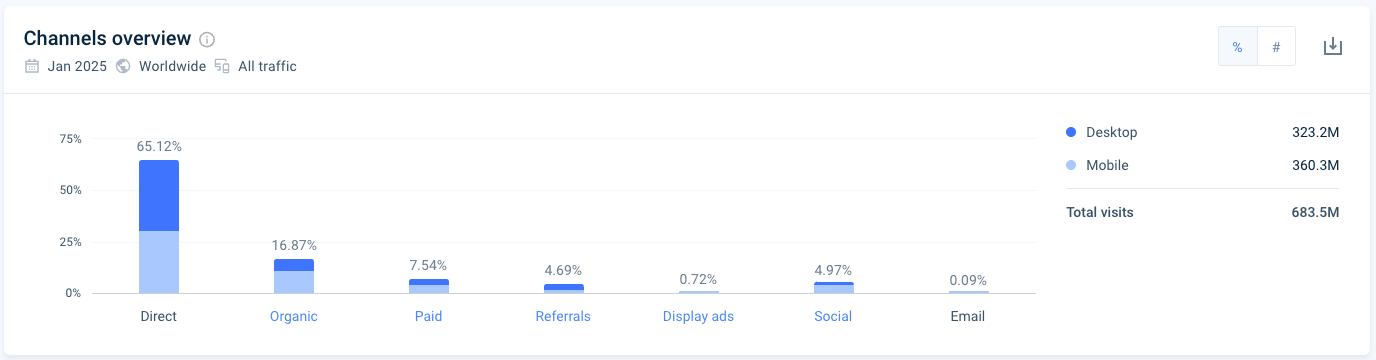
Only 4.97% of its traffic comes from social media, but the breakdown there is interesting.

68.56% of the 4.1M desktop visits referred by social media platforms in January 2025 came from YouTube. Facebook, in second place, makes up 12.55% of the social referring traffic share. This points to AliExpress’ building its marketing strategy around influencers, affiliate marketers, and product reviewers.
What does SAM have to say about AliExpress’ traffic and trends?
“I noticed that your annual growth in visits is quite strong at nearly 49%, outperforming competitors like Ozon, Shopee, Allegro, and Alibaba by a significant margin. While your growth is impressive, it’s essential to understand the underlying factors that contribute to this performance and how it can be sustained.”
Knowing is only a piece of the puzzle. It’s taking that knowledge and crafting a data-driven strategy to win your market.
Top fastest-growing ecommerce companies list in the world
Ready to meet our January 2025 winners? Here are the top 15 of the 50 fastest-growing global ecommerce companies:
| Rank | Company | MOM Change | Monthly Visits | HQ country |
| 1 | 키오스킨 (Kioland) | 6,366.23% | 1,372,553 | Korea, Republic of |
| 2 | Ollies | 4,066.95% | 1,755,927 | United States |
| 3 | GameSir | 1,367.73% | 1,404,841 | United States |
| 4 | Maha Kumbh Mela 2025 | 1,270.91% | 1,135,873 | India |
| 5 | Norelie | 879.25% | 1,562,471 | United States |
| 6 | Ner LeTzadik Printing Foundation | 713.89% | 1,065,182 | Israel |
| 7 | Bobbie | 606.03% | 1,810,386 | United States |
| 8 | Nationaal Archief | 456.99% | 1,026,361 | Netherlands |
| 9 | FDL: Food, Drink, Life | 441.51% | 1,705,706 | United States |
| 10 | Mindful Advantage | 424.79% | 1,521,185 | United States |
| 11 | Vastrado | 401.40% | 1,734,269 | India |
| 12 | 샤르드 | 345.29% | 1,336,079 | Korea, Republic of |
| 13 | La Herradero | 317.44% | 1,277,301 | United States |
| 14 | BL Fabric | 282.52% | 1,062,137 | India |
| 15 | EMeals, Inc. | 275.72% | 1,075,580 | United States |
Here’s the criteria we used to create this list (so you can do it, too, with Similarweb Sales Intelligence):
- Geography: Worldwide
- Company type: Ecommerce
- Filter: Company
- Monthly Visits: Over 1 million
- Ranked by monthly visits increase, January 2025 vs. December 2024
Download the full list here:
The top 5 fastest-growing ecommerce companies worldwide
Here’s what we found out about these up-and-comers using Similarweb Sales Intelligence:
1) Kioland
The fastest-growing company in January 2025 is Kioland, a Korean beauty company that designs skincare products specifically for its customers based on skin types and preferences. This month, Kioland’s web traffic saw 1.37M visits, up 6,366.23% MoM.
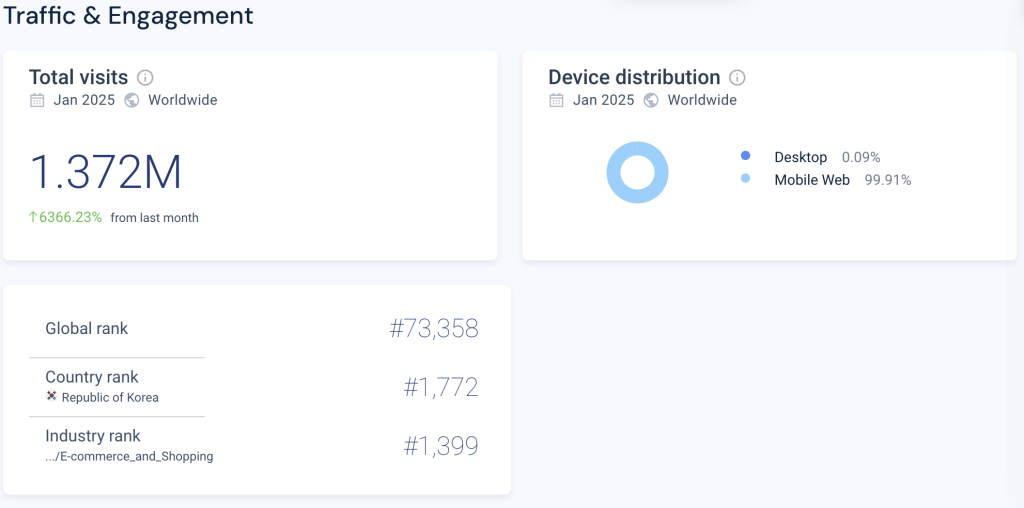
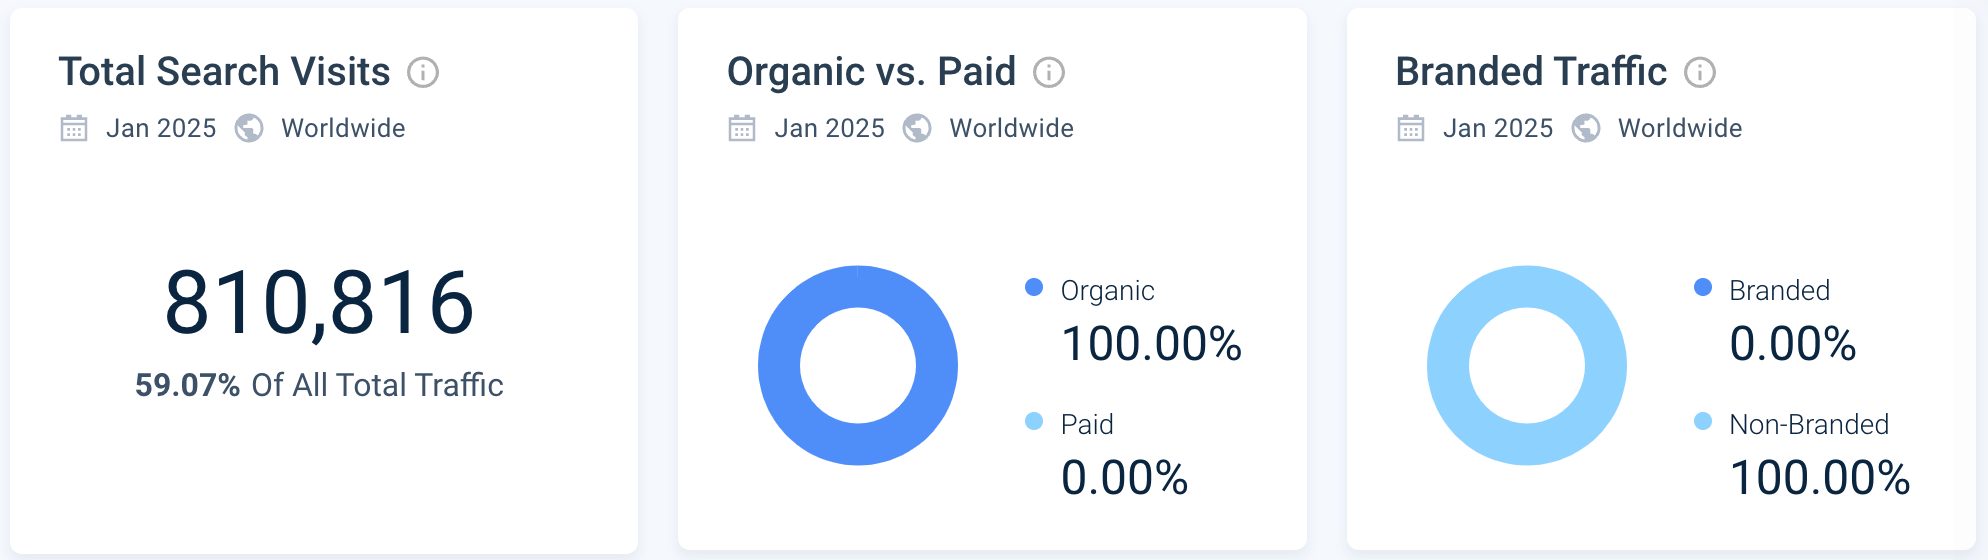
Currently, 99.9% of its traffic comes from mobile web, with 59.07% from organic search and 27.87% from direct search—indicating that the company is still building its brand recognition.
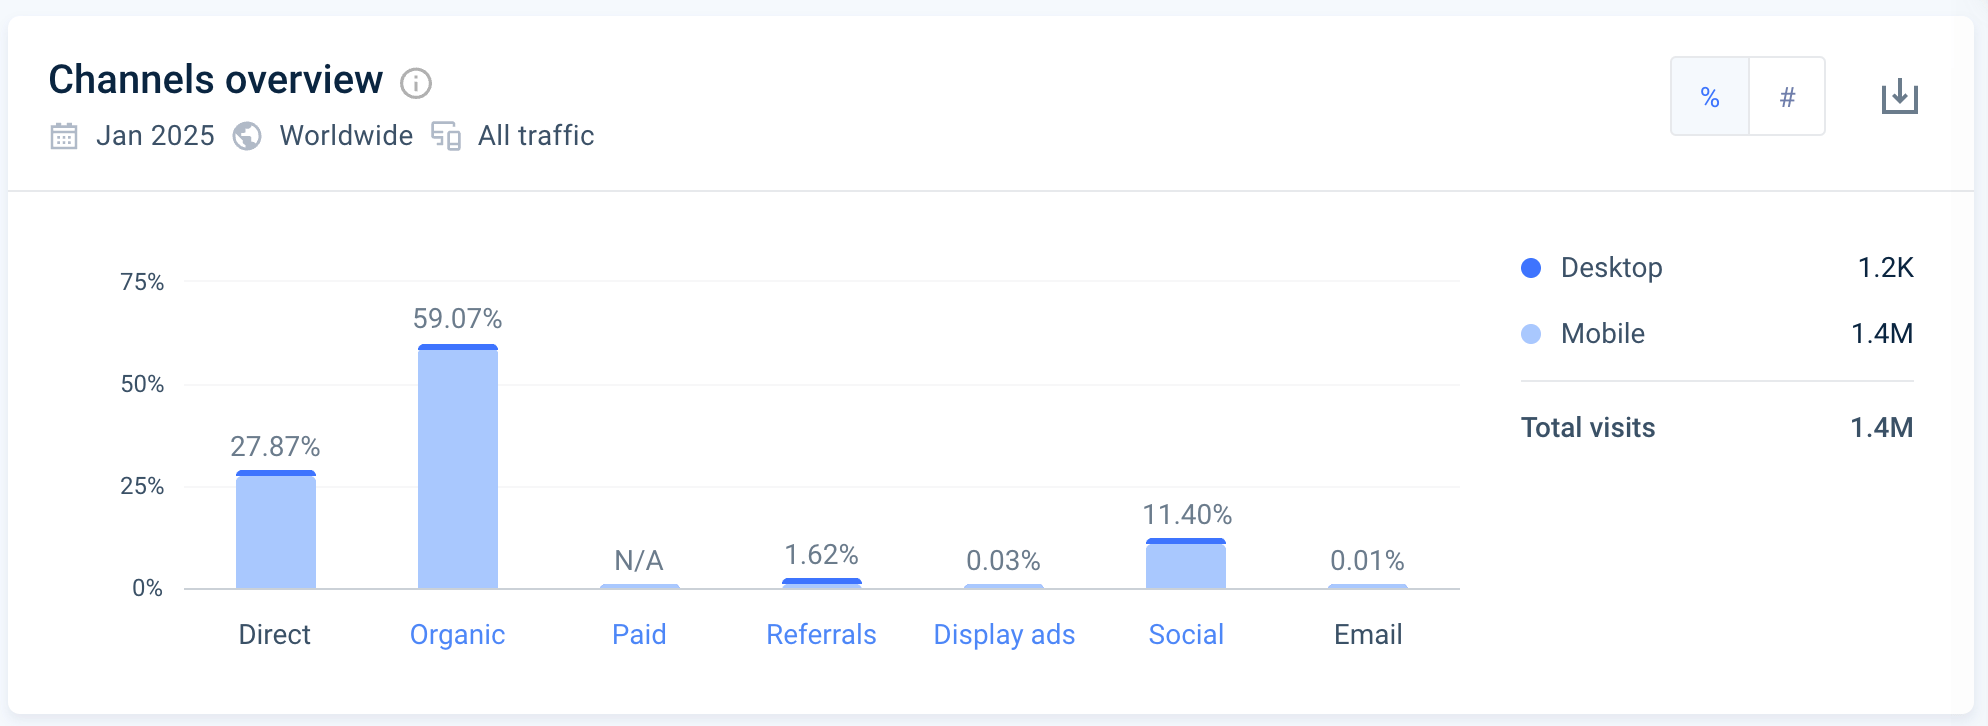
As the company works to establish itself, Kioland isn’t spending on paid search.
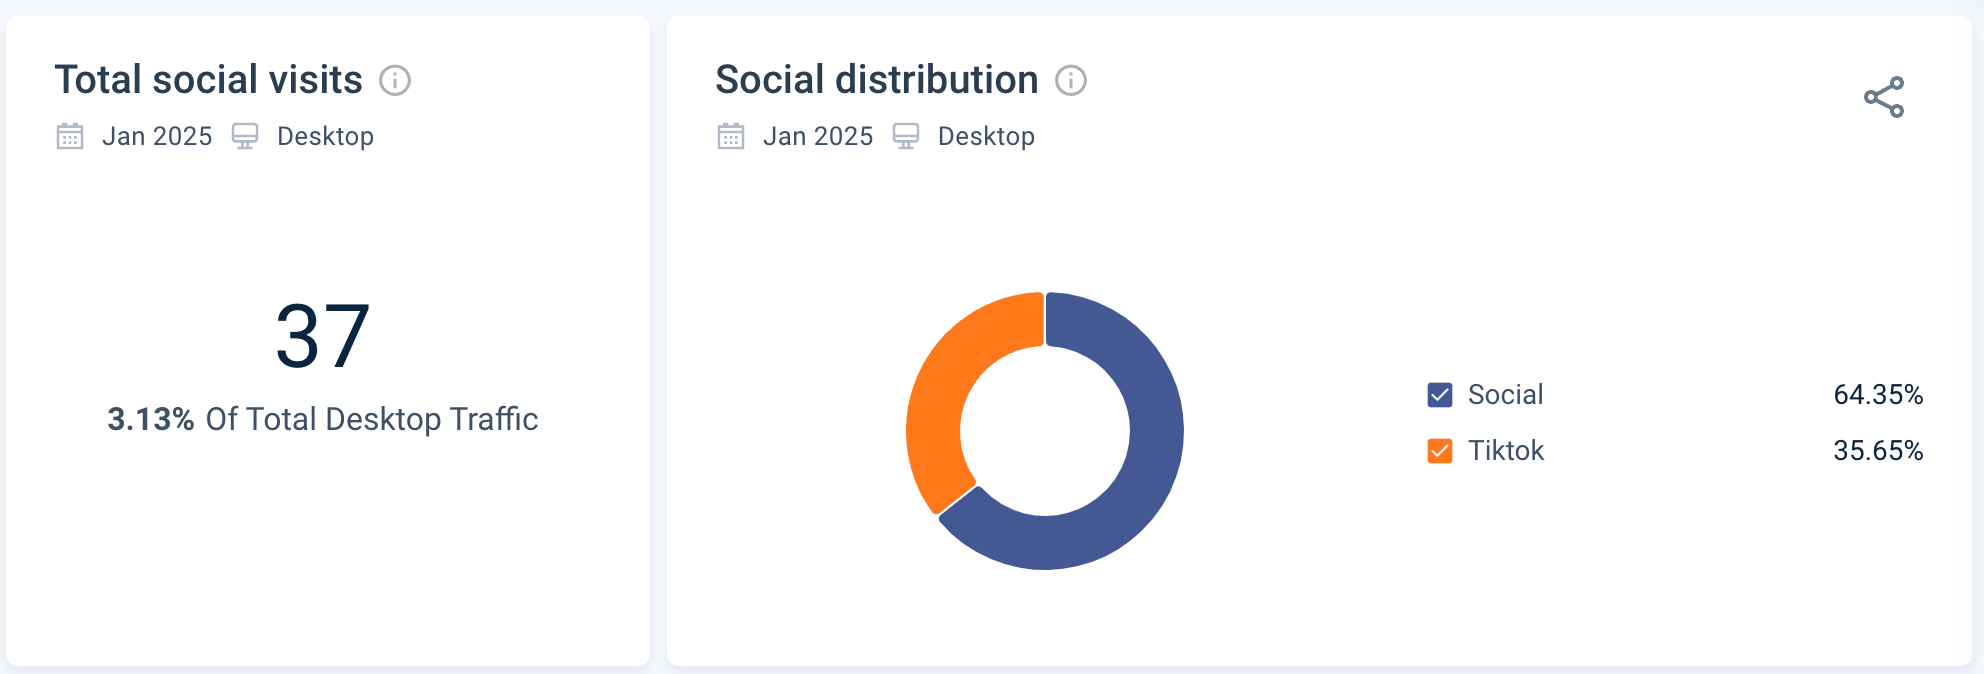
Most of its focus is on social media, with a third of its traffic coming from TikTok.
What does SAM have to say about this?
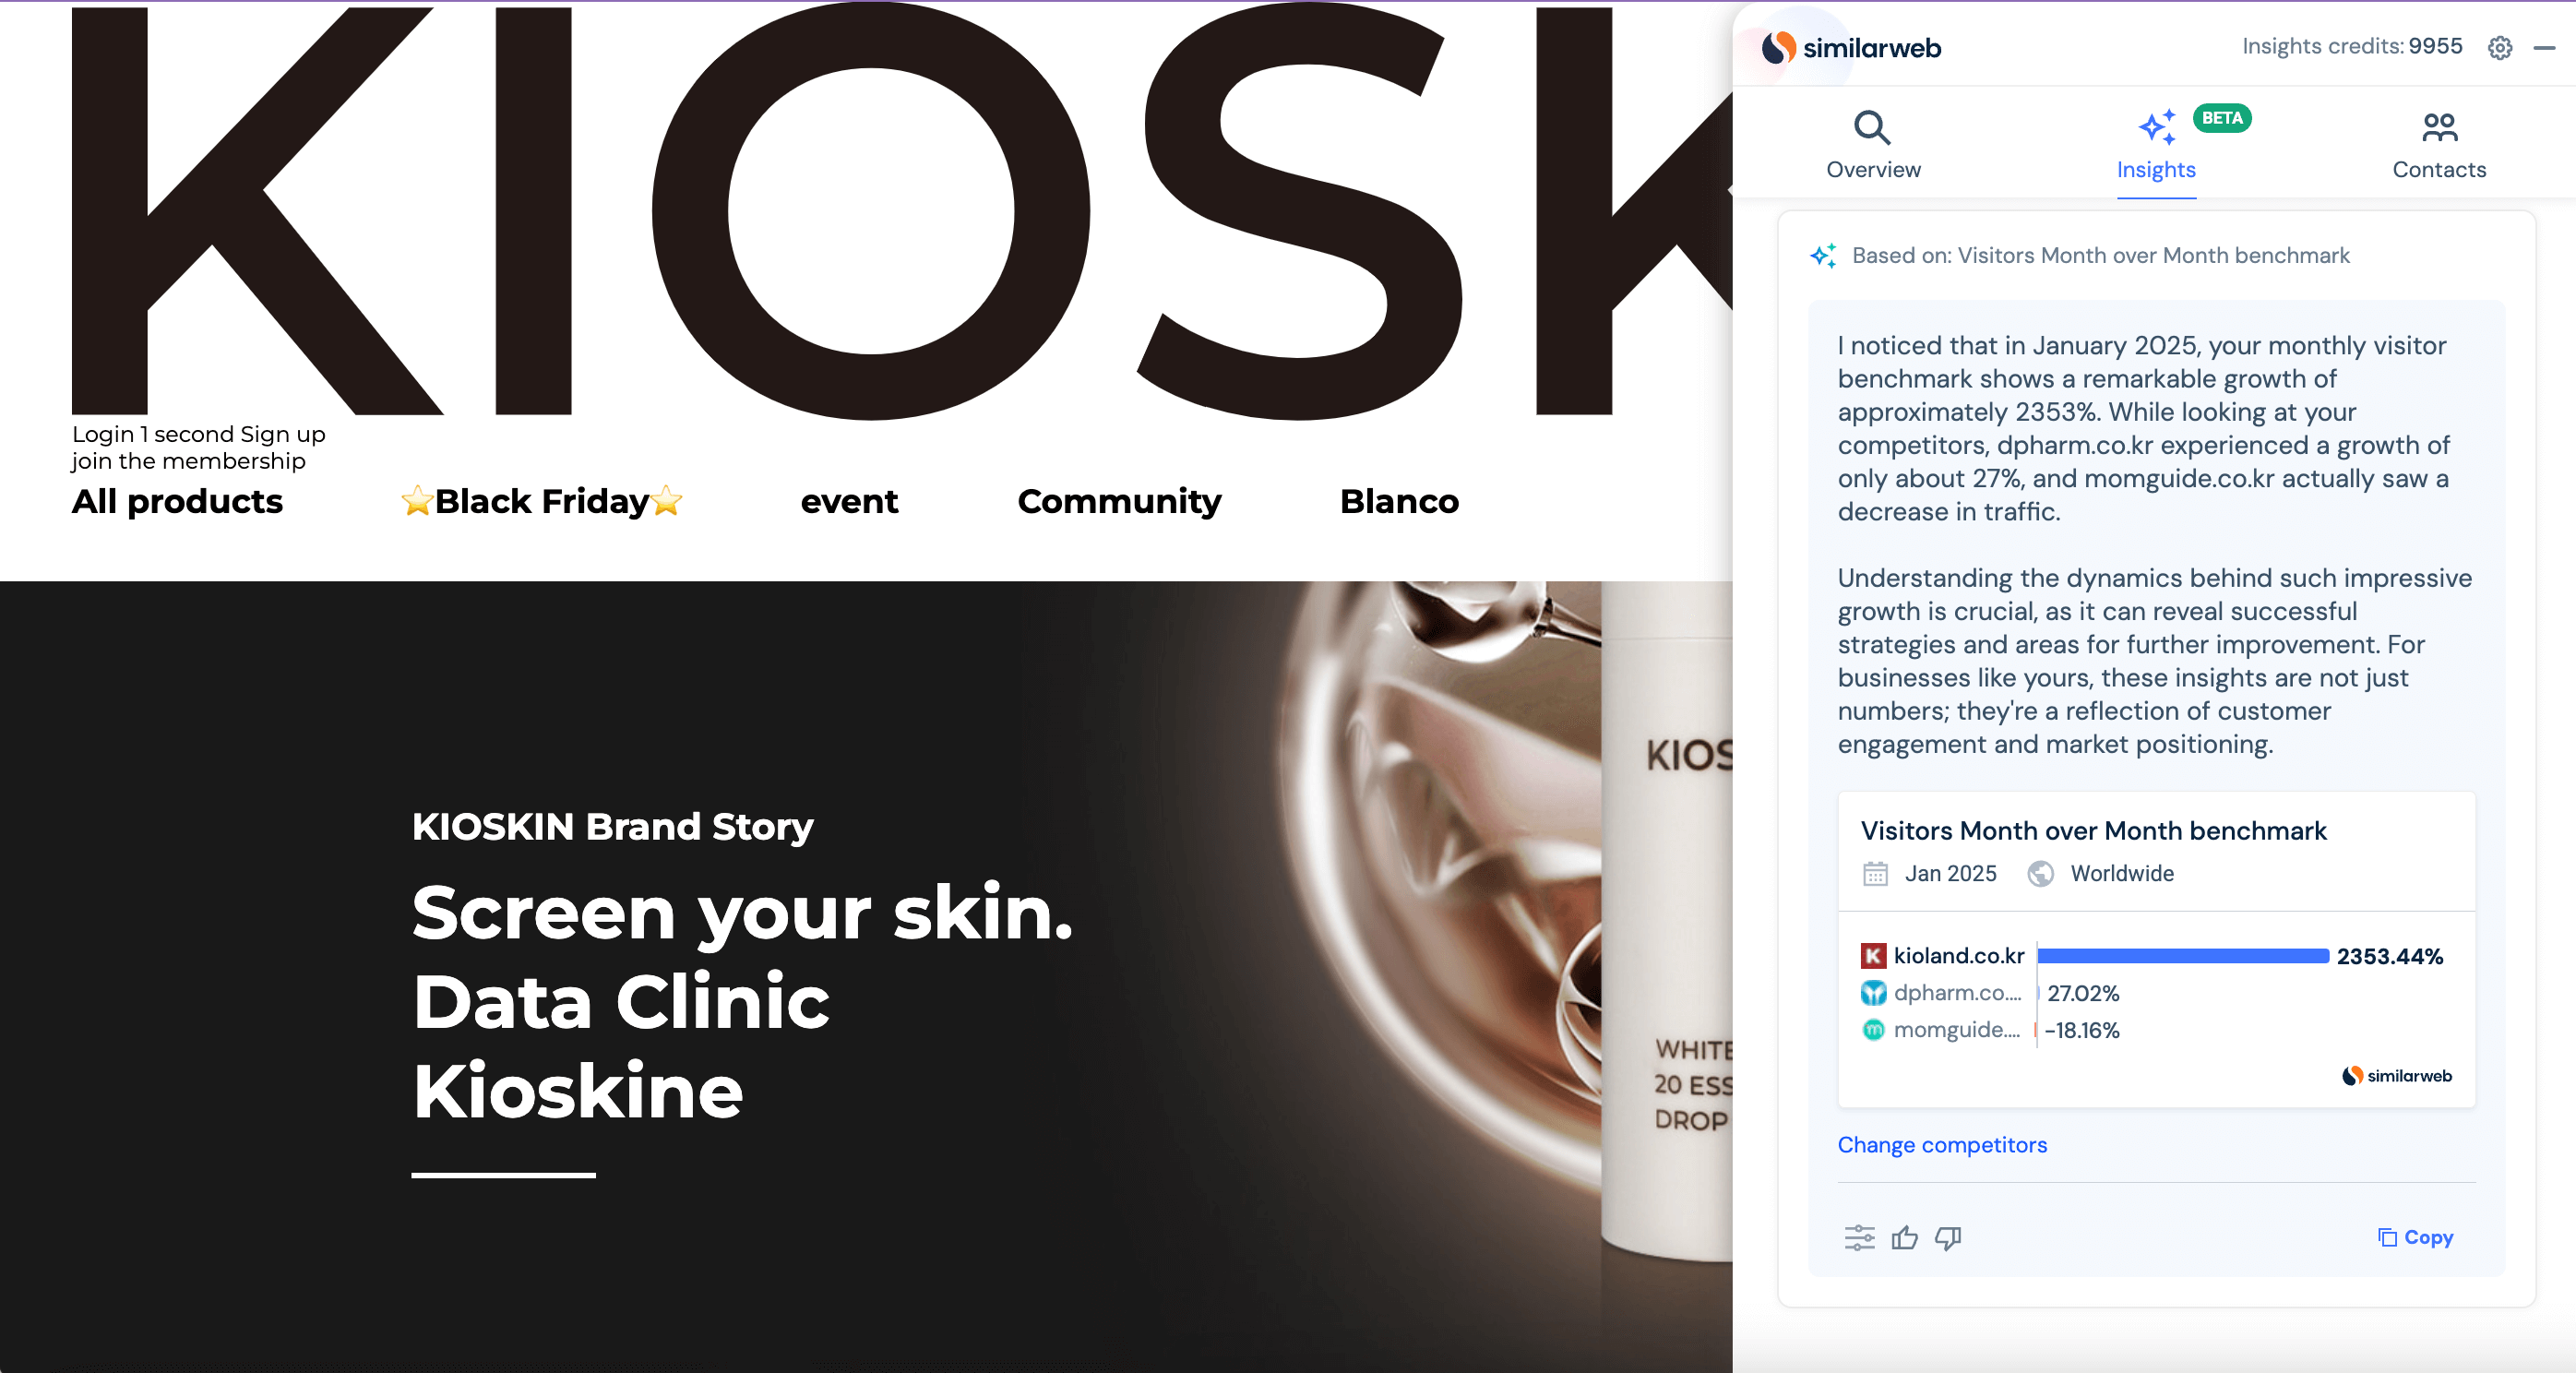
“Understanding the dynamics behind such impressive growth is crucial, as it can reveal successful strategies and areas for further improvement. For businesses like yours, these insights are not just numbers; they’re a reflection of customer engagement and market positioning.”
But, when a company like Kioland has only recently launched its skincare product line, SAM points out:
“Understanding web traffic is crucial, but it’s just one piece of the puzzle. Without deep insights into customer behavior and market trends, businesses might miss out on opportunities to connect with their audience effectively and optimize their digital strategy.”
These are great insights to start building effective strategies to continue the momentum and increase traffic share.
We can also see that the company has been prioritizing advertising technologies over the last couple of years:
- Criteo Advertiser (installed April 2023)
- Facebook Advertiser (installed February 2023)
- Google Ads Advertiser (installed February 2023)
- Doubleclick (installed February 2023)
2) Ollies
In second place is an ecommerce marketplace that specializes in closeout merchandise and excess inventory. The company has been around since 1982, operates 500 brick-and-mortar stores, and launched its website in 2009. In January 2025, US consumers were looking for deeper discounts and alternatives to overseas ecommerce platforms due to new tariffs being implemented.
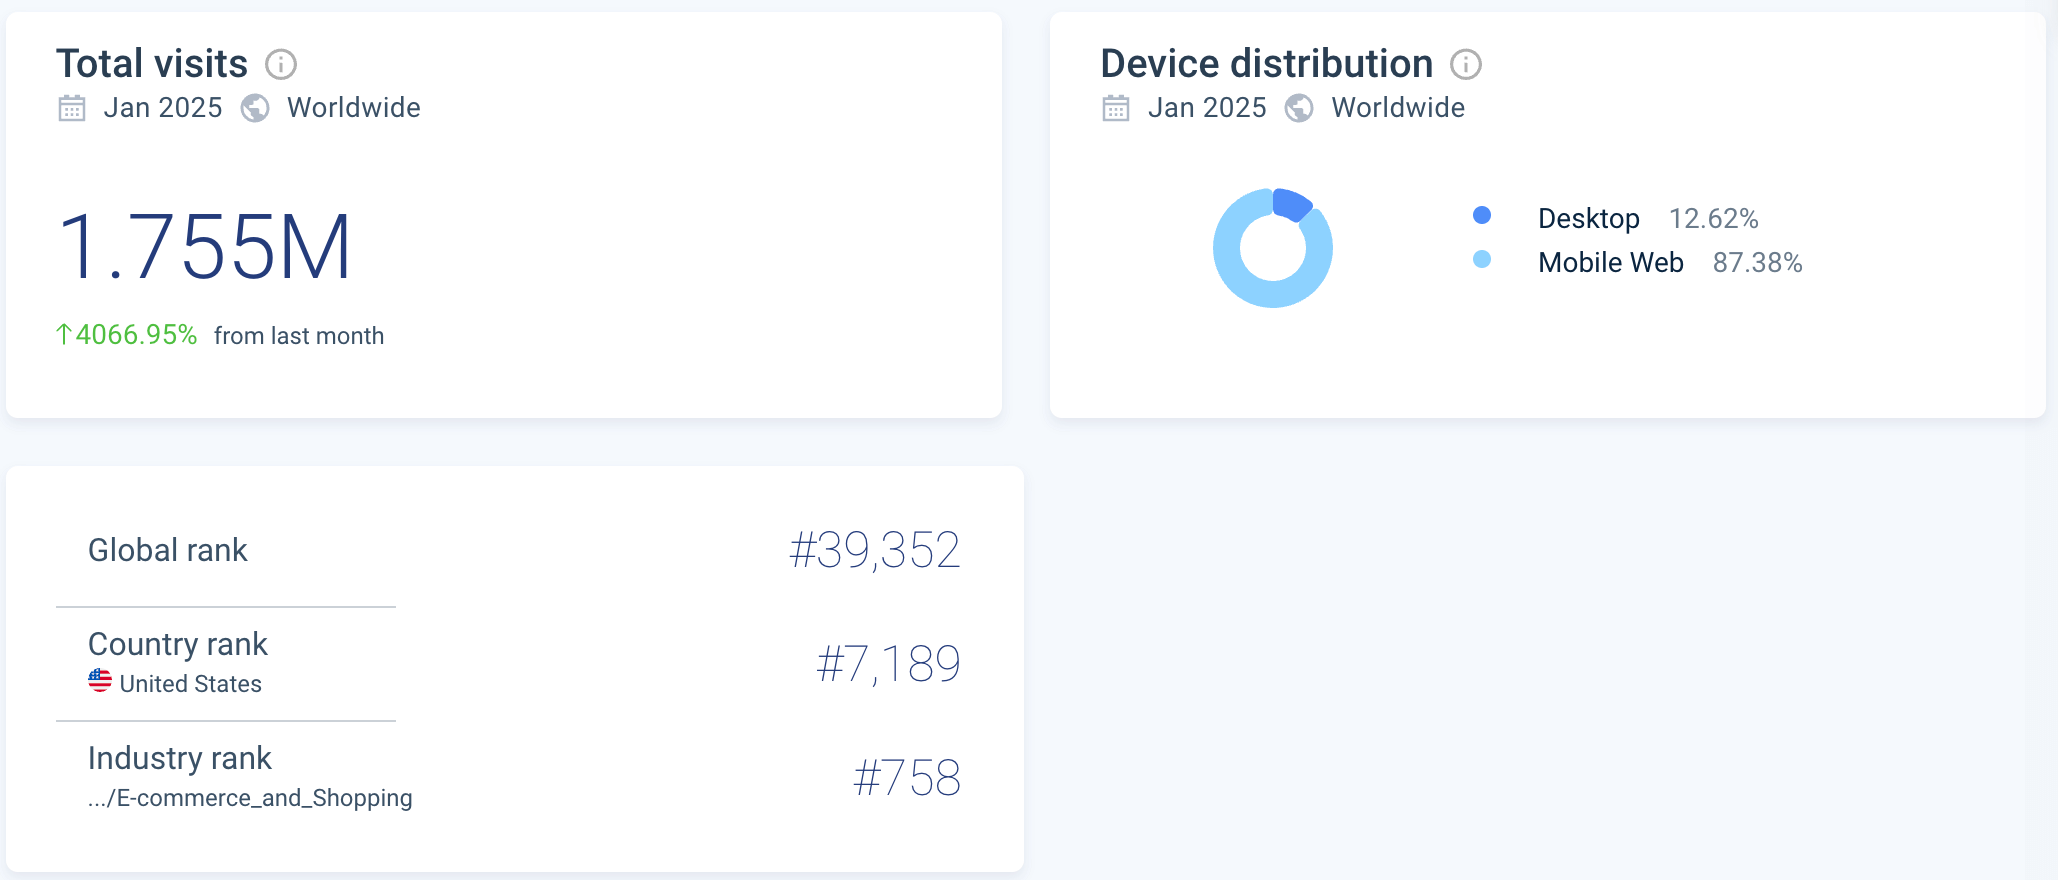
As a result, Ollie’s traffic reached 1.75M visits, a 4,066.95% MoM increase. Ollie’s is growing significantly faster than the industry average of -16.68%.
The company is banking on its brand recognition, with 62.42% of search traffic coming from direct sources.
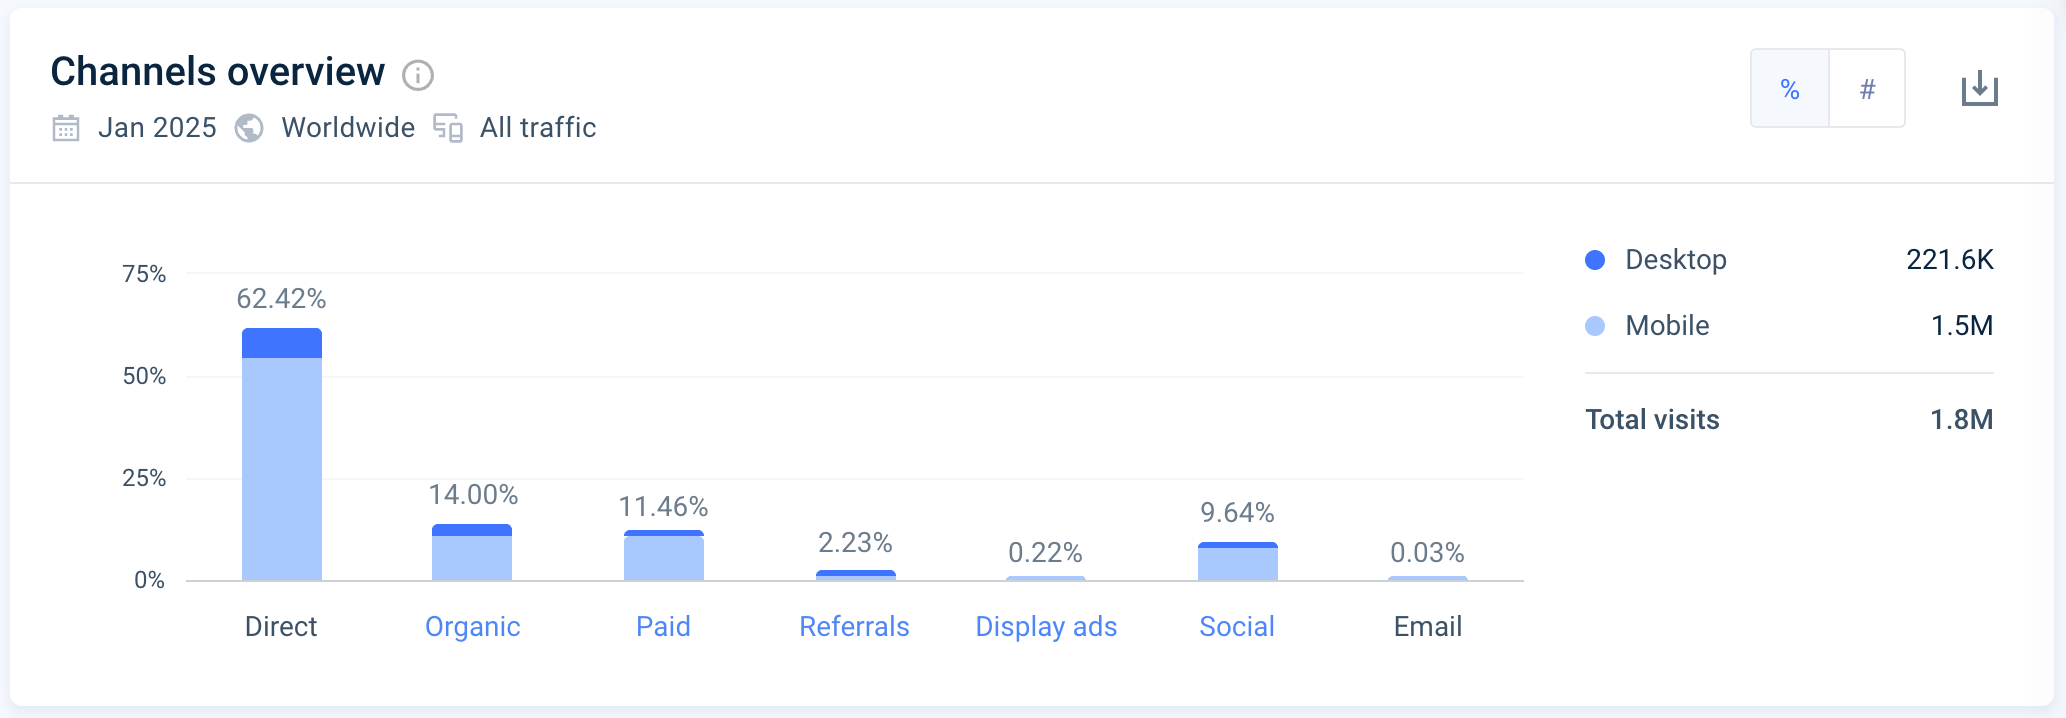
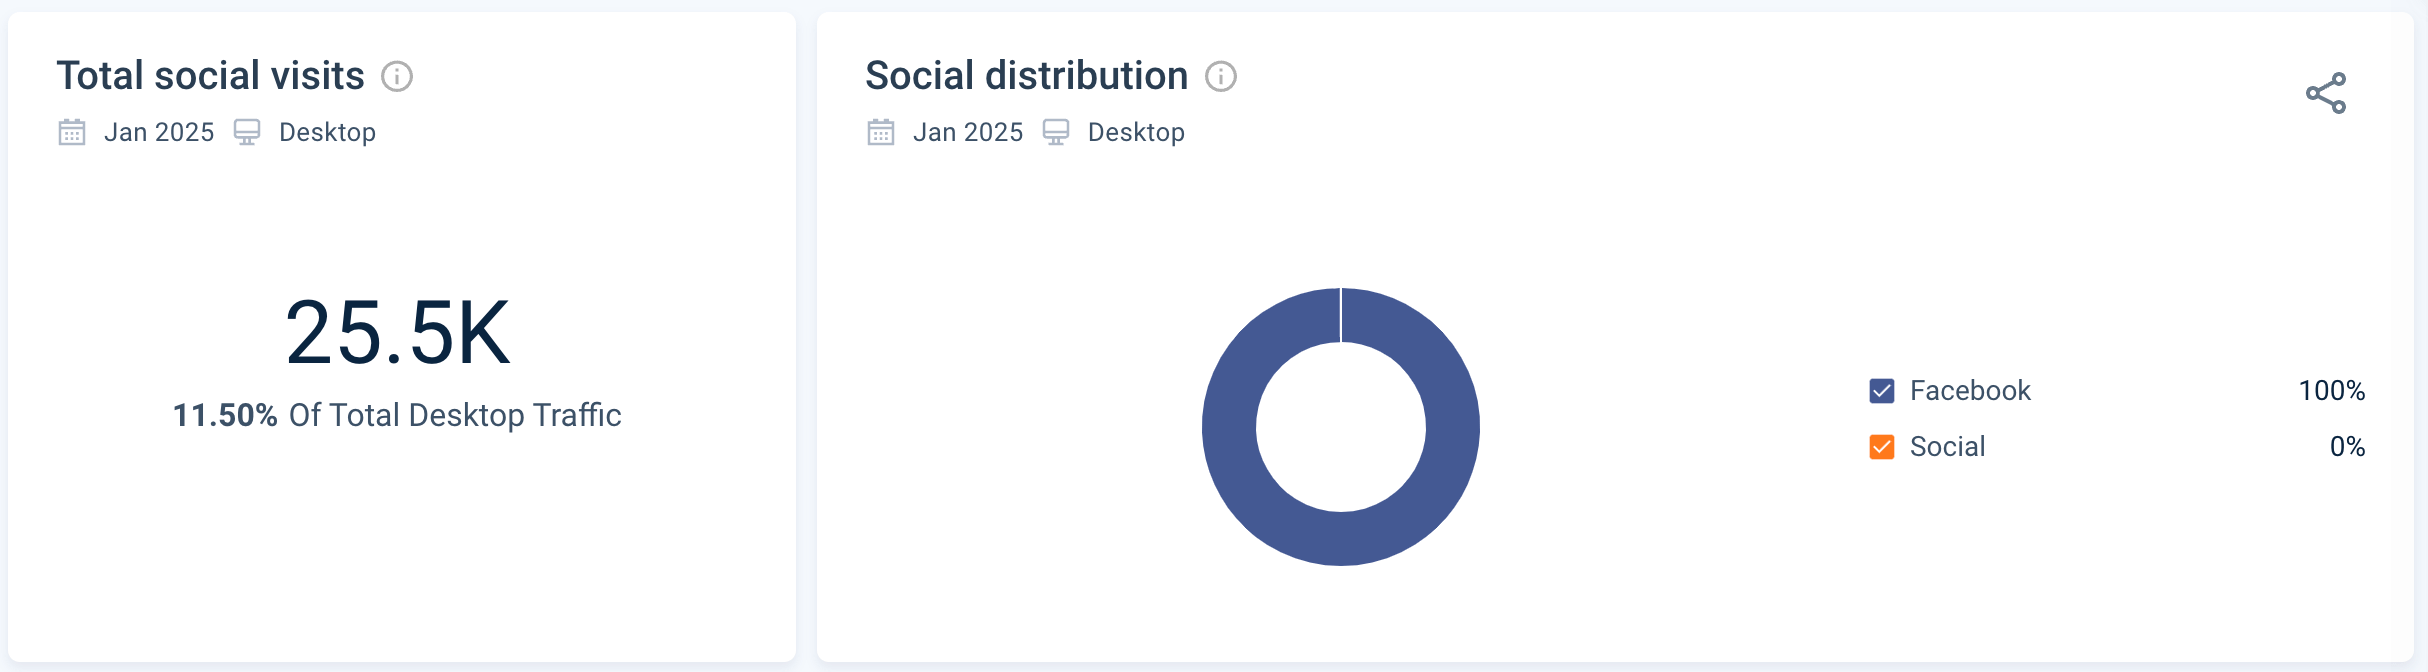
Organic search contributes only 14% of website traffic, while paid search (11.46%) and social media (9.64%) also drive traffic. Notably, 100% of Ollie’s social traffic comes from Facebook.
What does this say about Ollie’s demographics?
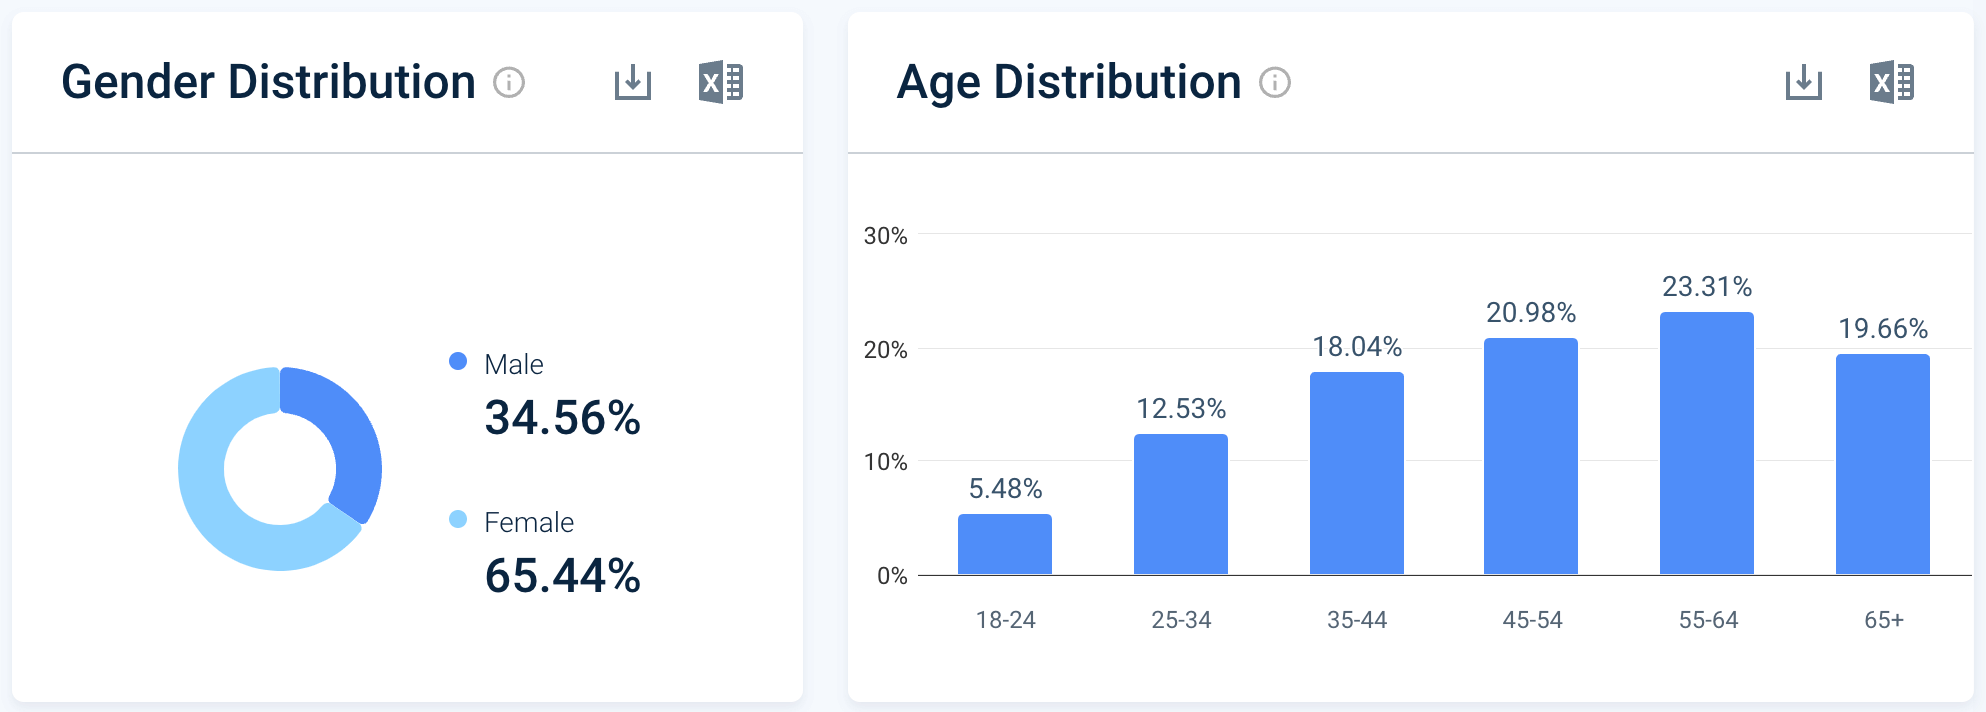
The majority of shoppers at Ollie’s, 65.44%, identify as female, while 34.56% identify as male. The largest age groups are:
- 55-64 years old: 23.31%
- 45-54 years old: 20.98%
- 35-44 years old: 18.04%
And here’s what SAM is saying about ollies.com’s performance:
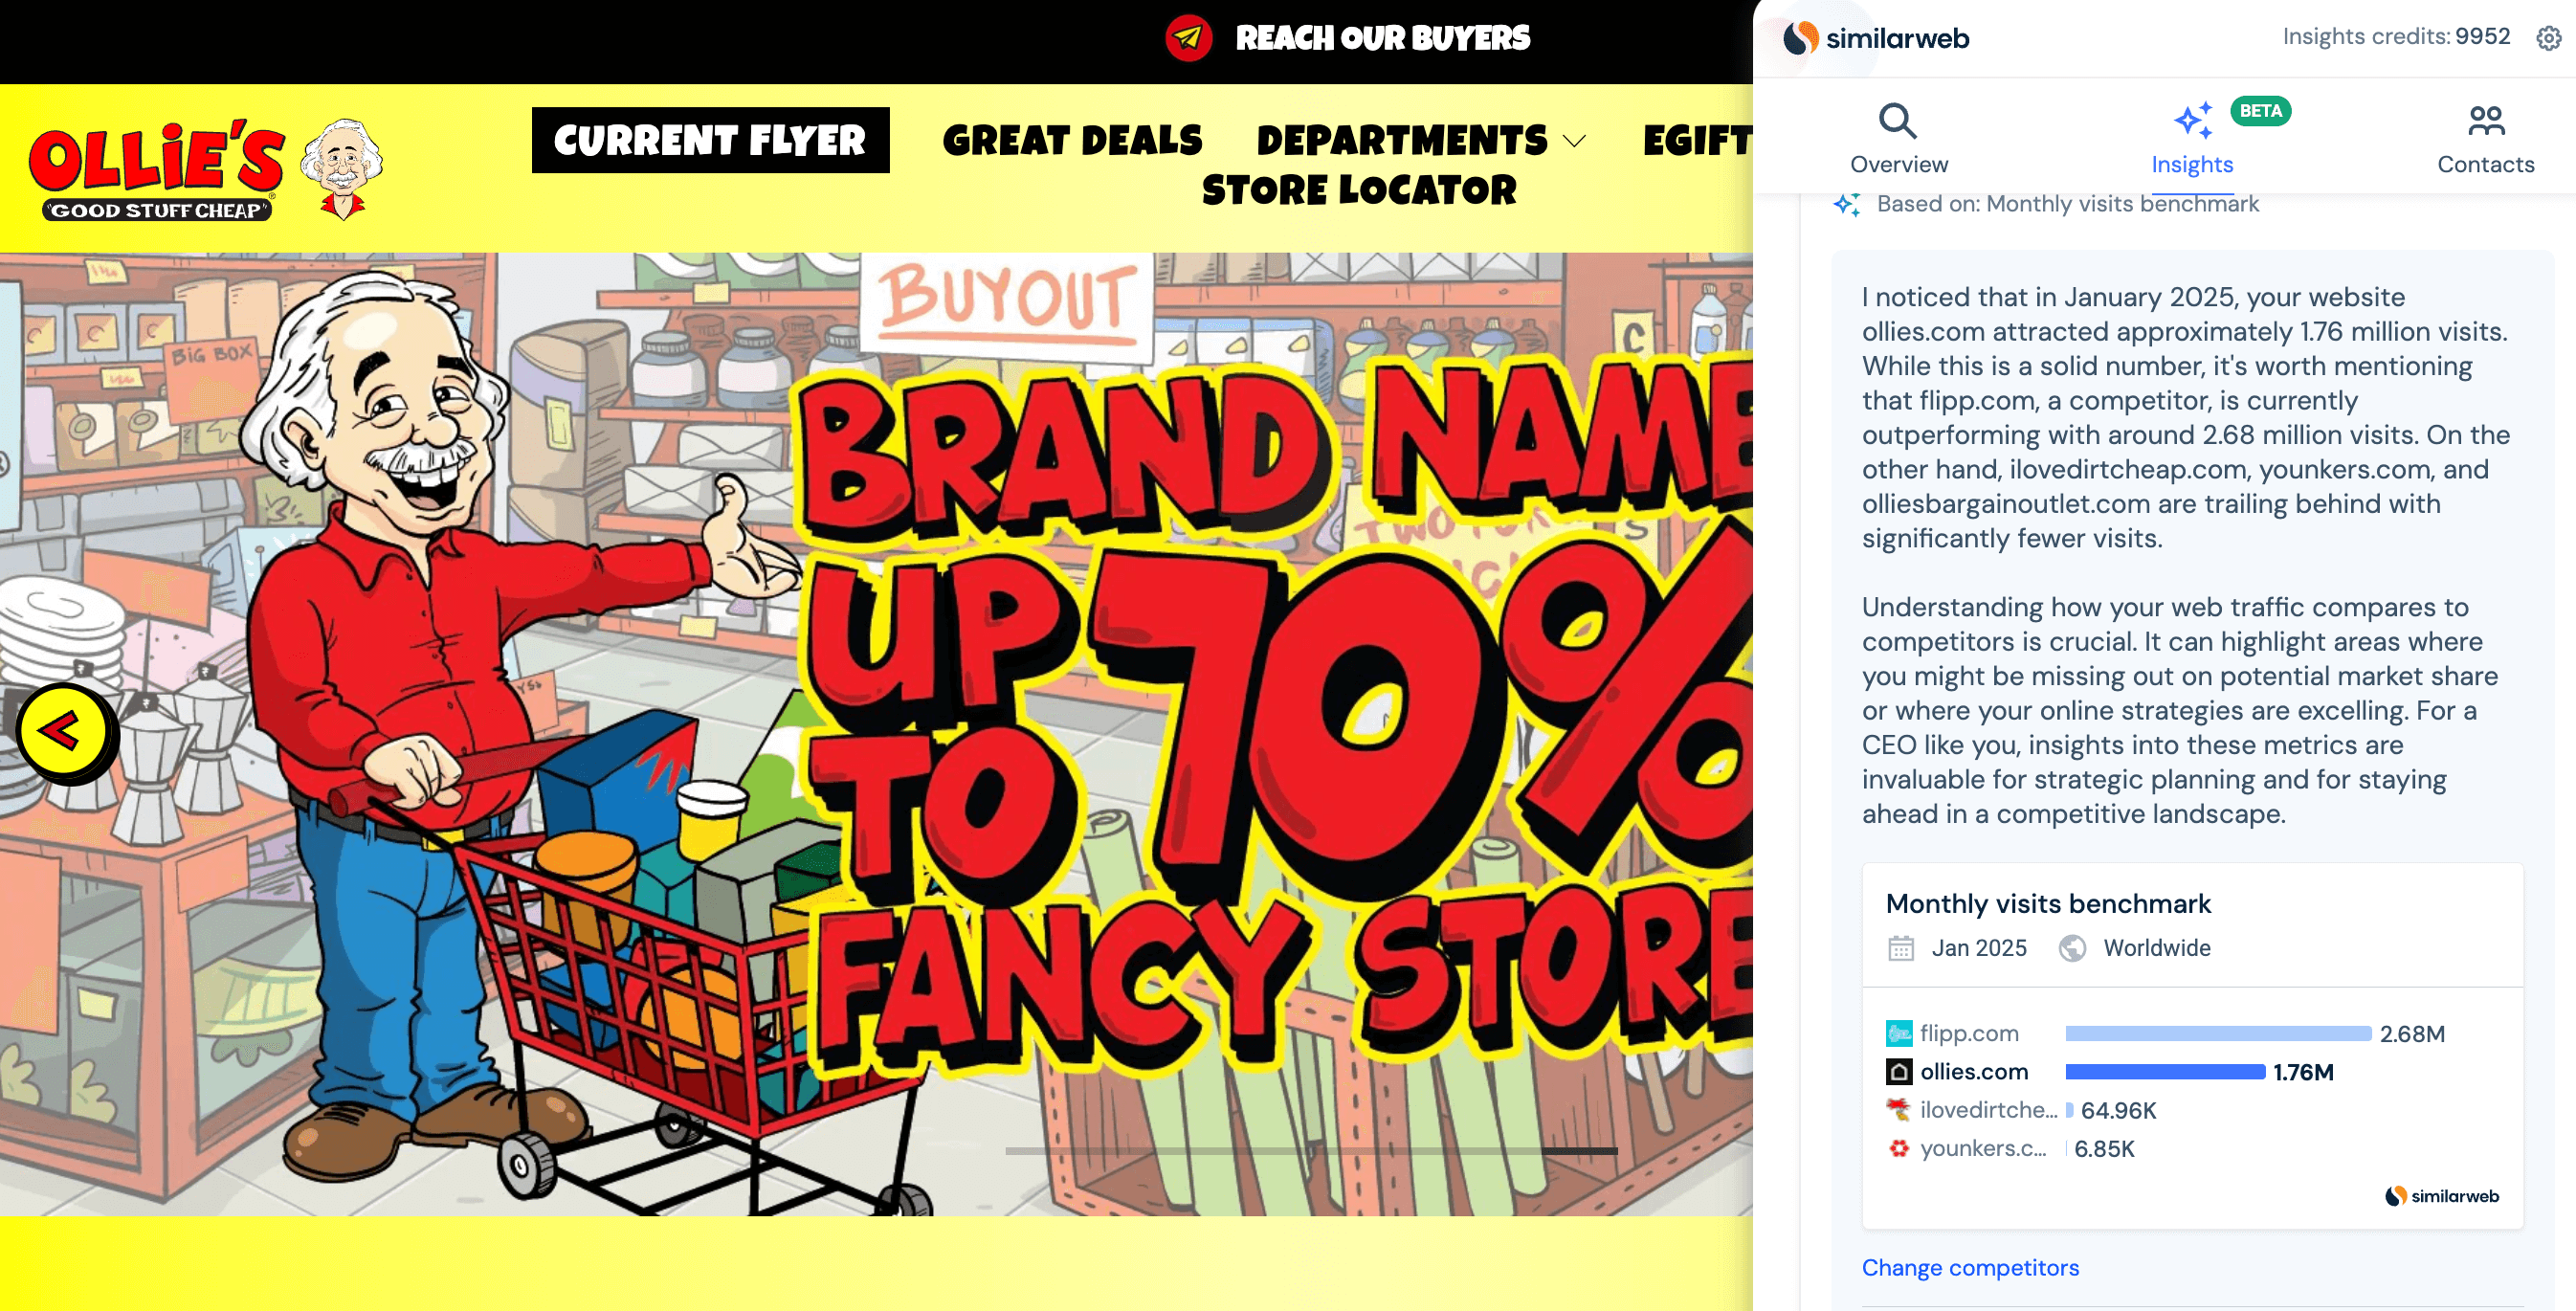
“I noticed that in January 2025, your website ollies.com attracted approximately 1.76 million visits. While this is a solid number, it’s worth mentioning that flipp.com, a competitor, is currently outperforming with around 2.68 million visits. On the other hand, ilovedirtcheap.com, younkers.com, and olliesbargainoutlet.com are trailing behind with significantly fewer visits.
Understanding how your web traffic compares to competitors is crucial. It can highlight areas where you might be missing out on potential market share or where your online strategies are excelling. For a CEO like you, insights into these metrics are invaluable for strategic planning and for staying ahead in a competitive landscape.”
Even with its rapid growth, Ollie’s has opportunities to fine-tune its strategies and capture additional market share.
The company is definitely acknowledging these opportunities with the advertising technologies it installed in February 2025:
- Magnite: A supply-side platform that helps businesses track advertising inventories, display ads across various websites, and monitor revenue via a unified platform
- Tradedesk Advertiser: A buy-side platform that provides access to all RTB inventory for display, television, video, social, mobile, and more
- AppNexus: A leading platform for buying real-time online advertising
3) GameSir
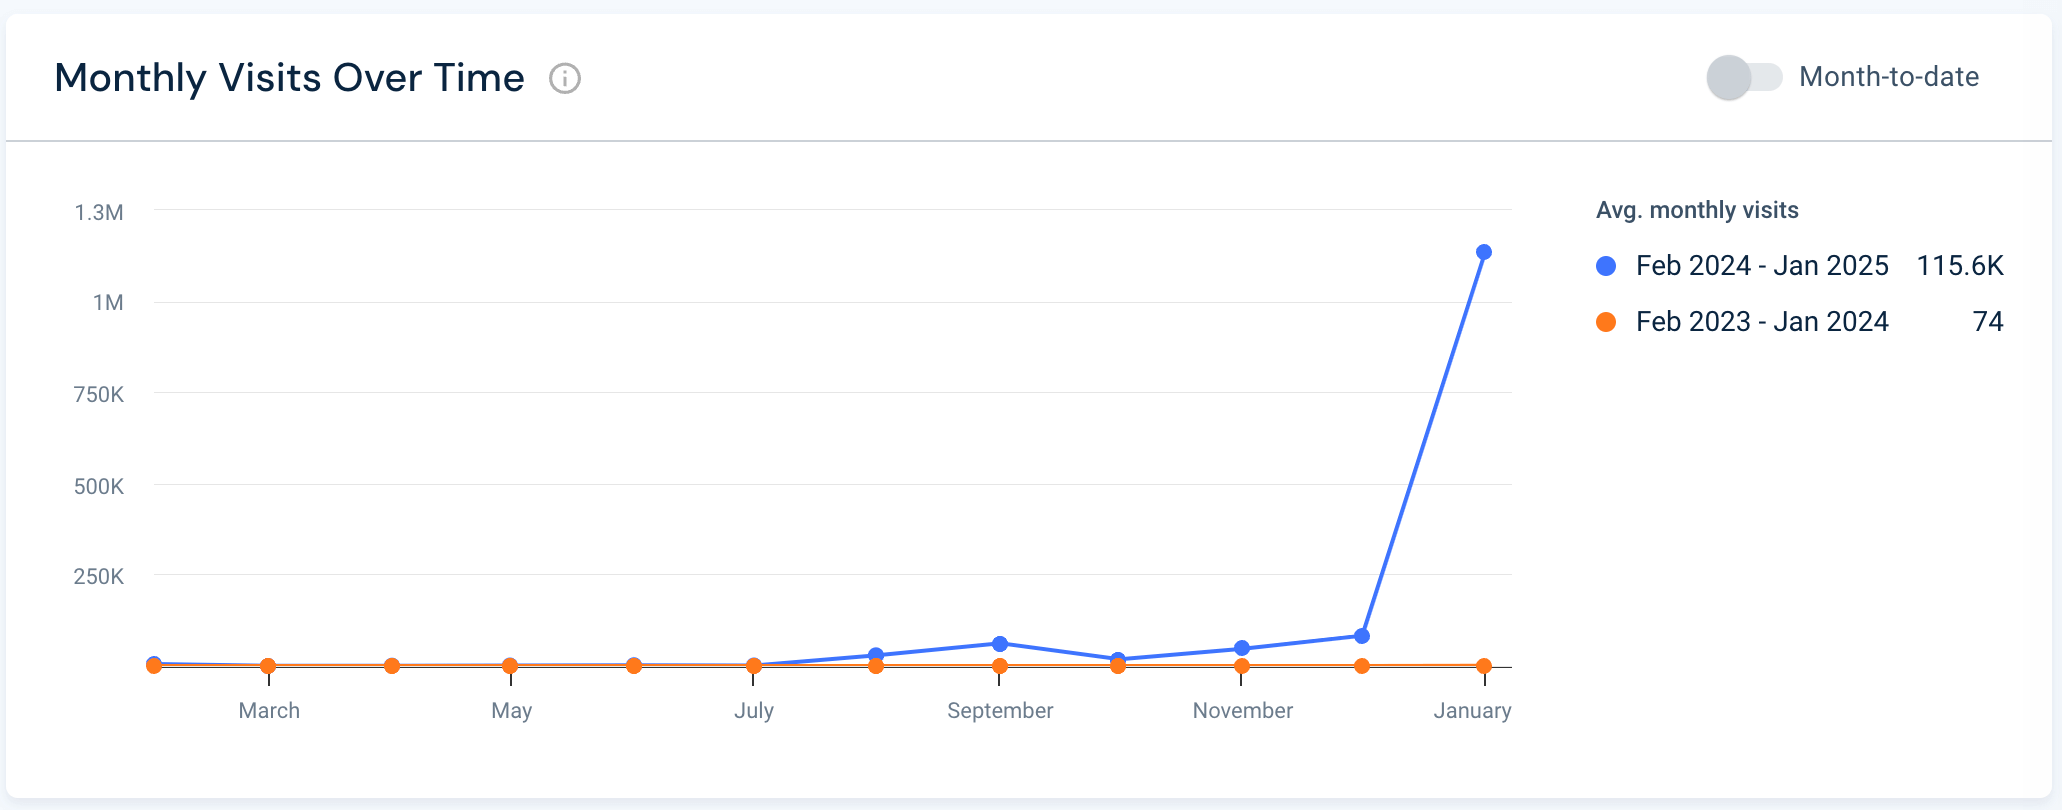
GameSir is a leading global brand founded in 2013, specializing in high-quality gaming peripherals designed to enhance the gaming experience across various platforms. In January, gamesir.com traffic reached 1.4M visits, a 1,367.73% MoM increase.
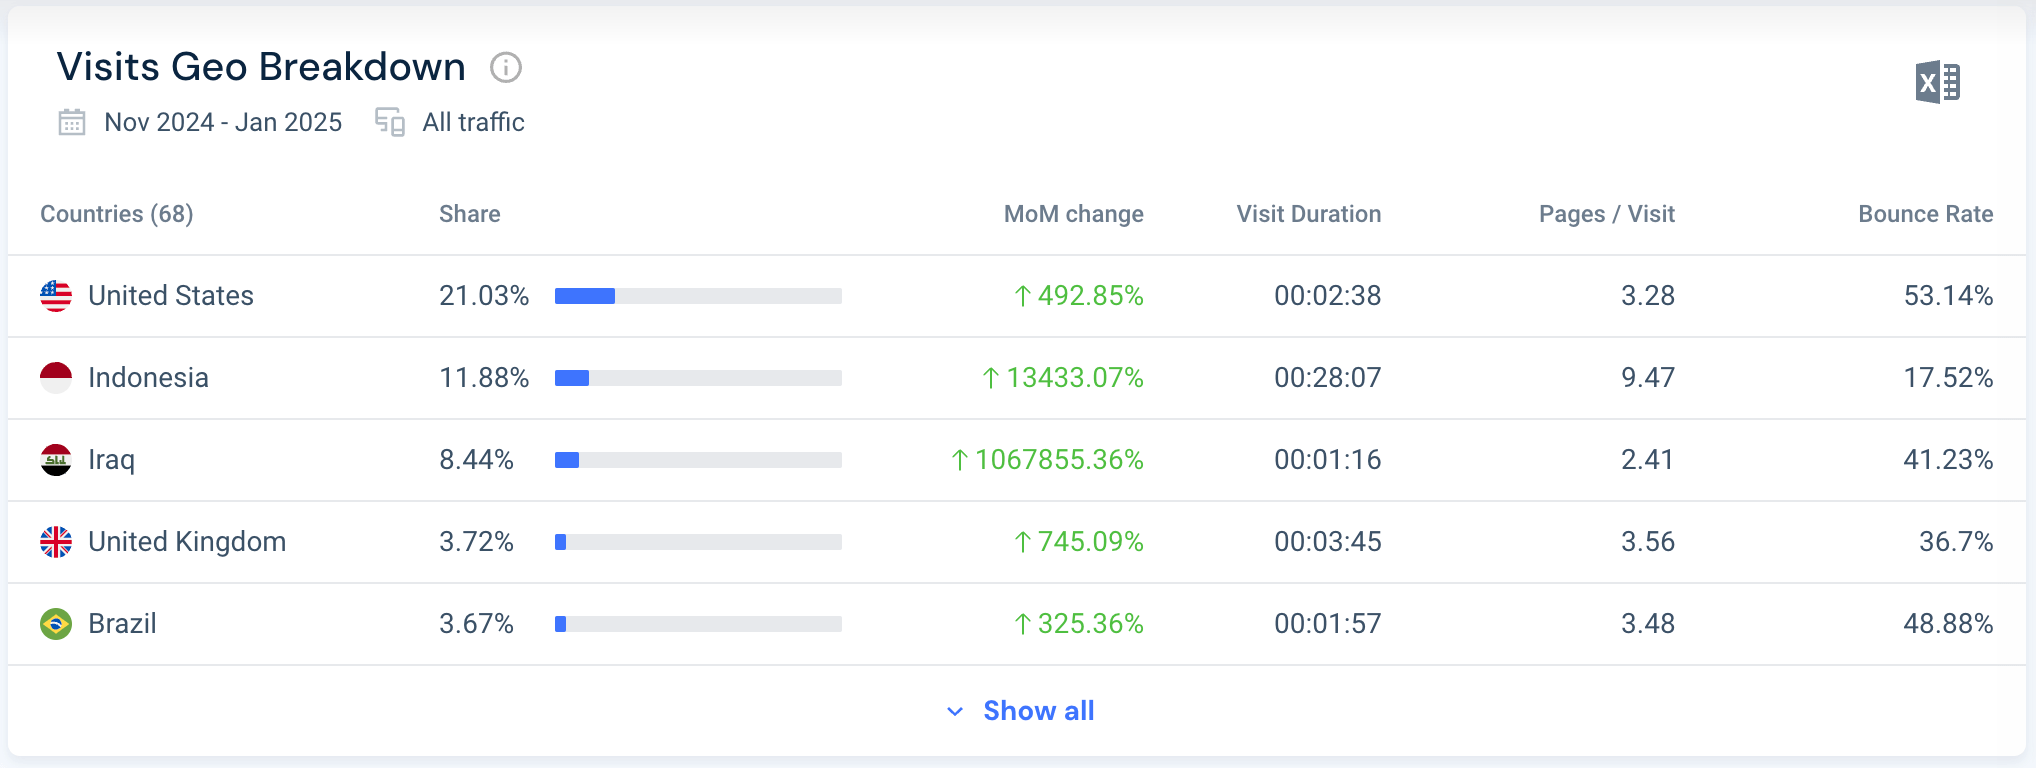
The China-based company’s website traffic primarily comes from the US, at 21.03%, followed by Indonesia at 11.88% and Iraq at 8.44%.
Among the top five fastest-growing ecommerce companies, GameSir is one of the few that utilize a paid search strategy.
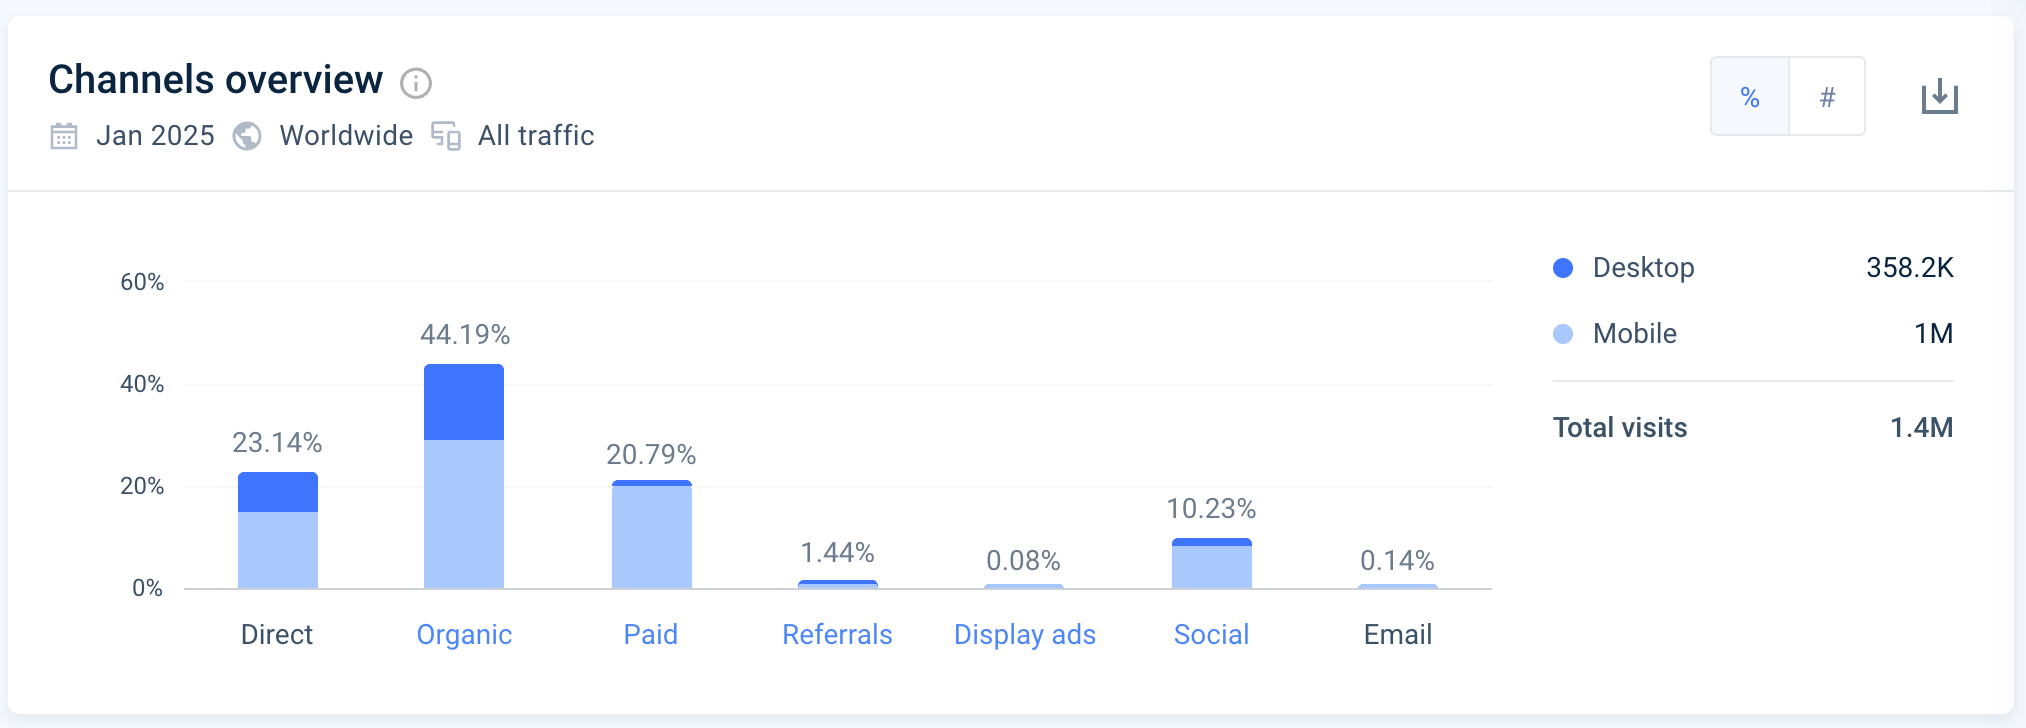
Organic and direct search traffic remains the highest sources, at 44.19% and 23.14%, respectively. Paid search accounts for 20.79% of the website’s traffic.
Here’s a closer look:
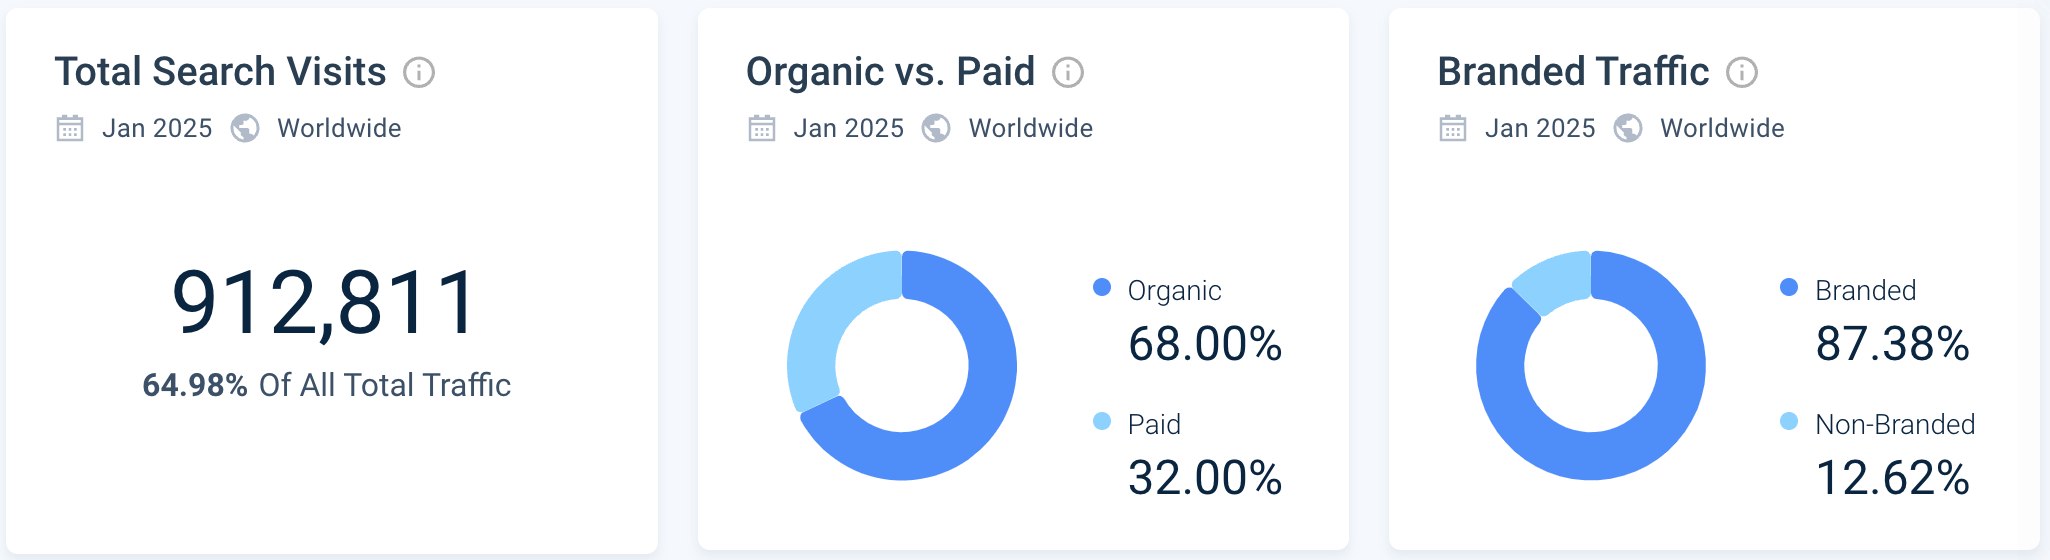
Total search visits account for 64.98% of all traffic, and 32% of that is coming from paid search. GameSir is running an effective paid campaign.

You can tell because its paid search campaign, focused on non-branded keywords, is not cannibalizing its organic search traffic.
Here’s SAM’s take on gamesir.com’s unique website visitor numbers:
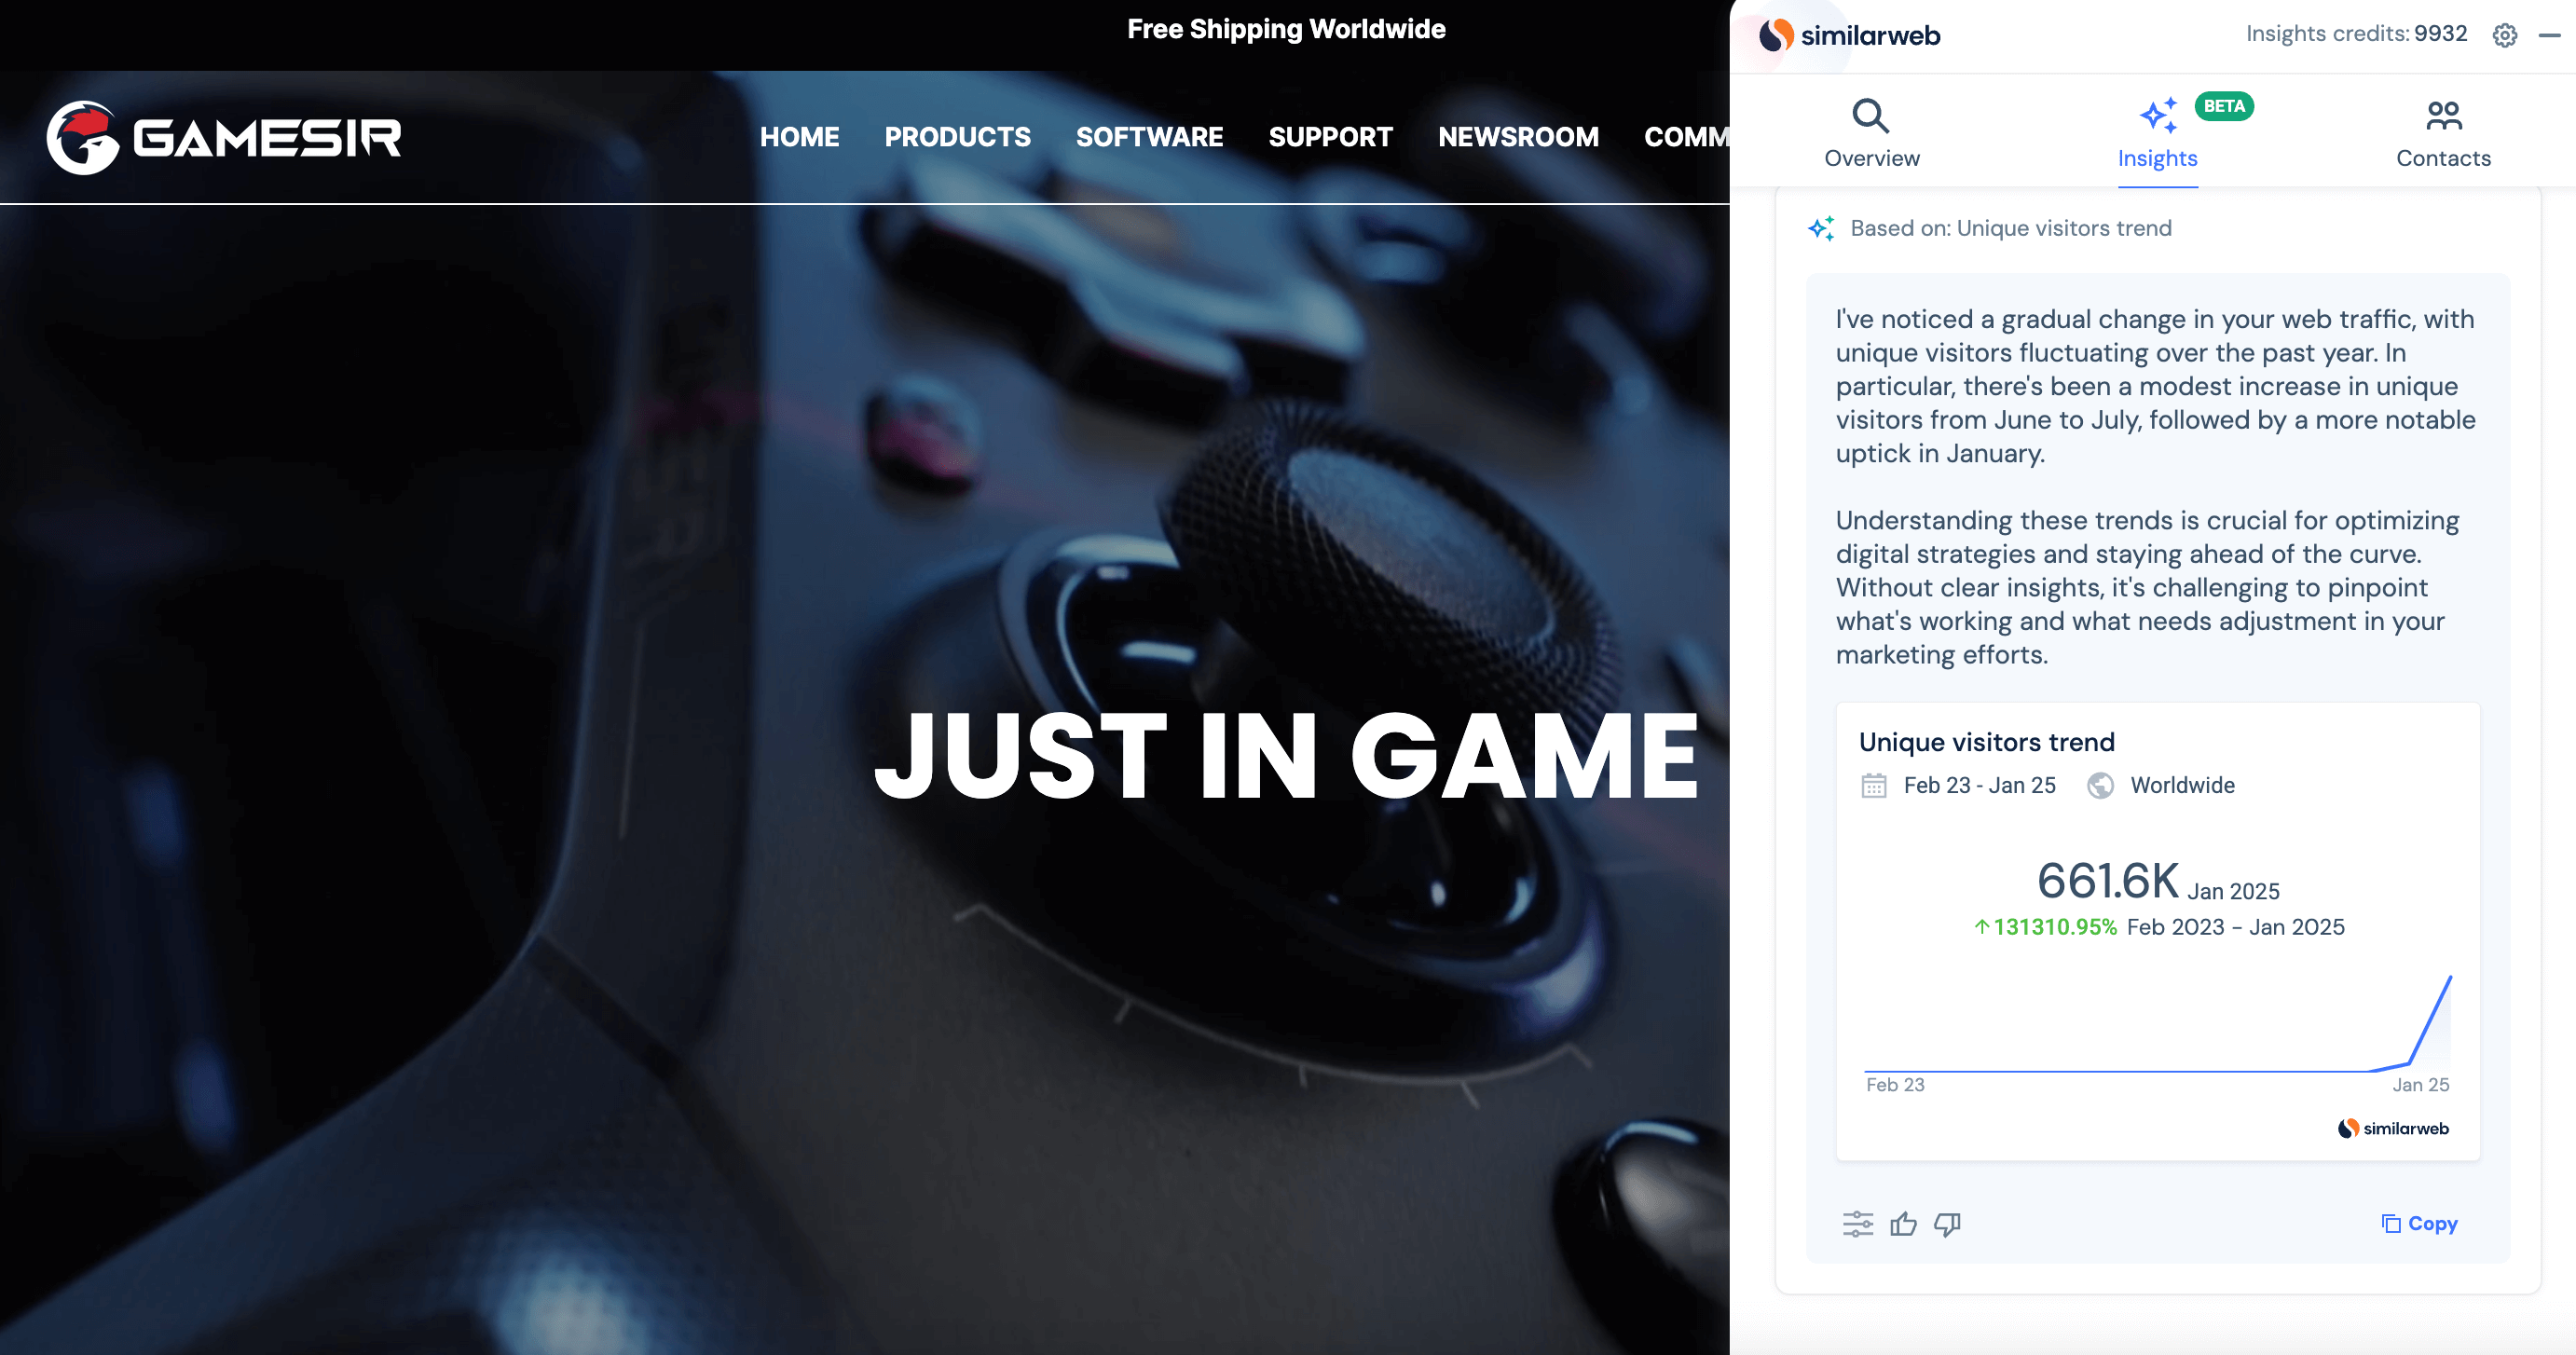
“I’ve noticed that your unique website visitors have fluctuated over the past year, with a notable decrease in April 2023 to around 163 visitors and again in June 2023 to nearly 192 visitors. However, there’s been a steady improvement since then, reaching approximately 661 thousand visitors as of January 2025.
It can be challenging to pinpoint the reasons behind these fluctuations and understand how they impact customer engagement and sales. Insights like these are crucial for adapting your digital strategy to better capture and retain your audience.”
Achieving 1,000% traffic growth is remarkable, especially if the company can sustain engagement and capitalize on its target audience.
Over the last two months, GameSir has been actively upgrading its website and marketing technologies. Here are a few key additions:
- Advertising: Doubleclick (installed January 2025) is a provider of digital marketing technology and services
- Content Delivery Network: Cloudflare (installed January 2025) is a global CDN and DNS provider that can speed up and protect any website online
- Conversion & Analytics: Google Analytics (installed January 2025) is a service offered by Google that offers detailed statistics about a website’s traffic and traffic sources and measures conversions and sales
4) Maha Kumbh Mela 2025
The Maha Kumbh Mela is a massive Hindu pilgrimage and spiritual festival held every 12 years at the Triveni Sangam in Prayagraj (formerly Allahabad), India. It is considered the largest peaceful gathering in the world, attracting over 100 million devotees, saints, and tourists.
This explains why Mahakumbh ranks as the fourth fastest-growing company. The festival may be 2,000 years old, but its website launched just three years ago in preparation for 2025. The site provided accommodations and tour bookings, driving a surge in traffic as the festival approached.
Mahakumbh.in traffic saw a MoM traffic increase of 1,270.91%. Now, with the event concluded, the website states that all packages are sold out, advising visitors not to send inquiries.
As the festival ends and preparations begin for the next one, it will be interesting to see if competitor travel sites emerge to handle future demand.
5) Norelie
Rounding out the top five fastest-growing ecommerce companies is Norelie (originally a Finnish company, now domiciled in the US), which focuses on enhancing the quality of life for individuals aged 50 and above by offering innovative health and wellness products. Norelie’s website traffic reached 1.56M visits in January, a MoM increase of 879.25%.

Norelie sees 99% of its traffic from mobile web, with 99.18% coming from the US. Interestingly, it has the highest social engagement among the top five.
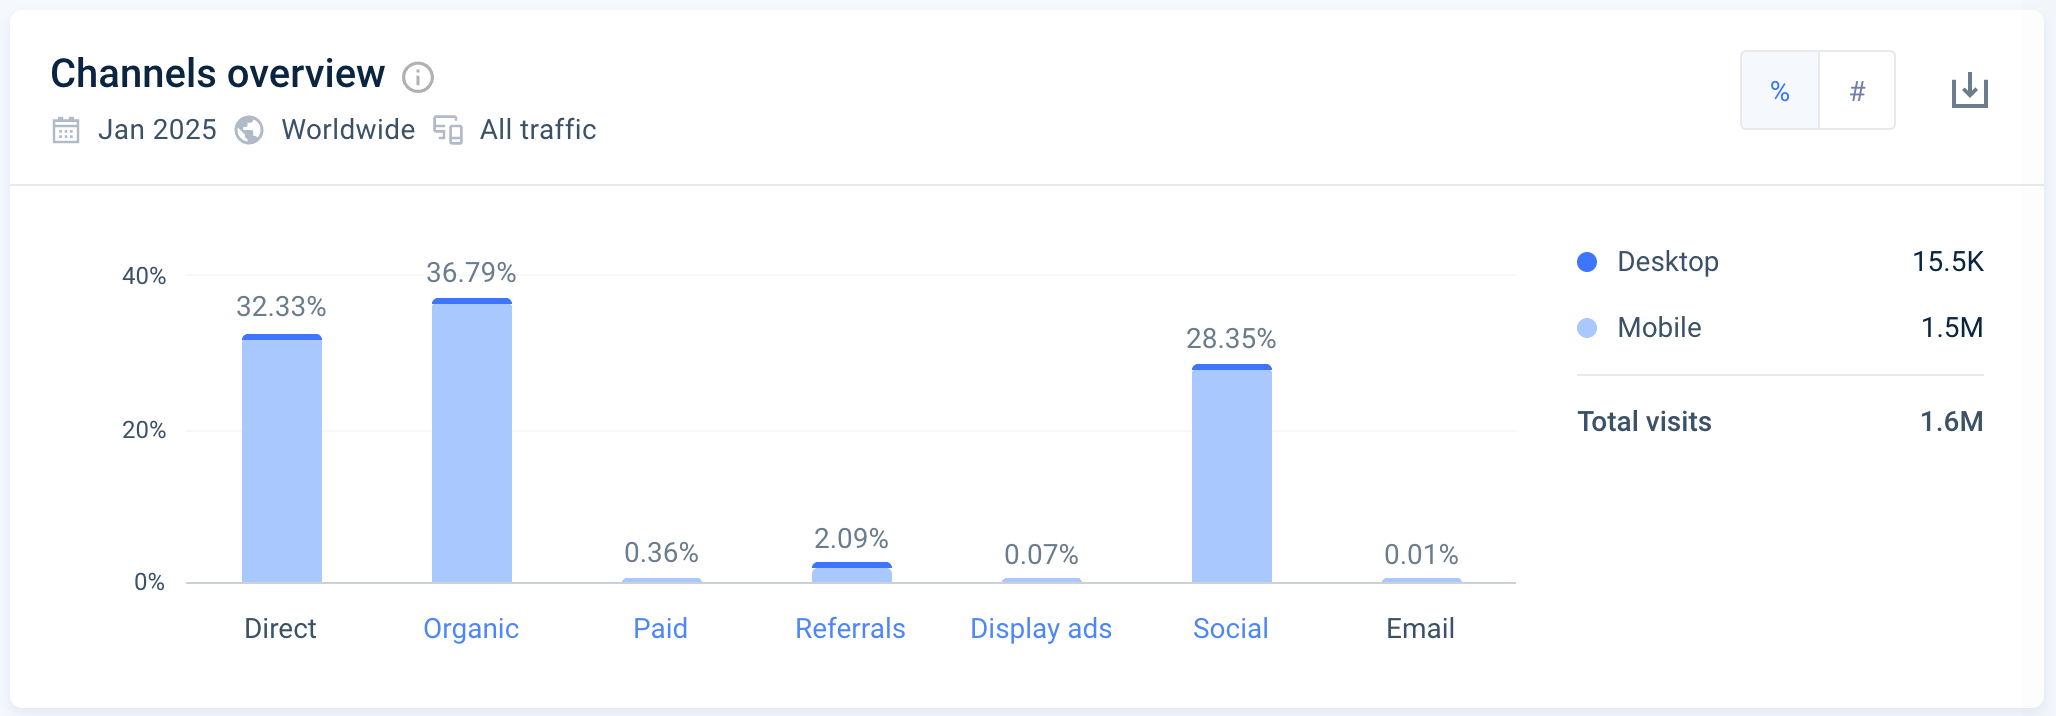
Norelie.co’s direct and organic search traffic is fairly balanced at 32.33% and 36.79%, respectively, while social traffic makes up 28.35%.
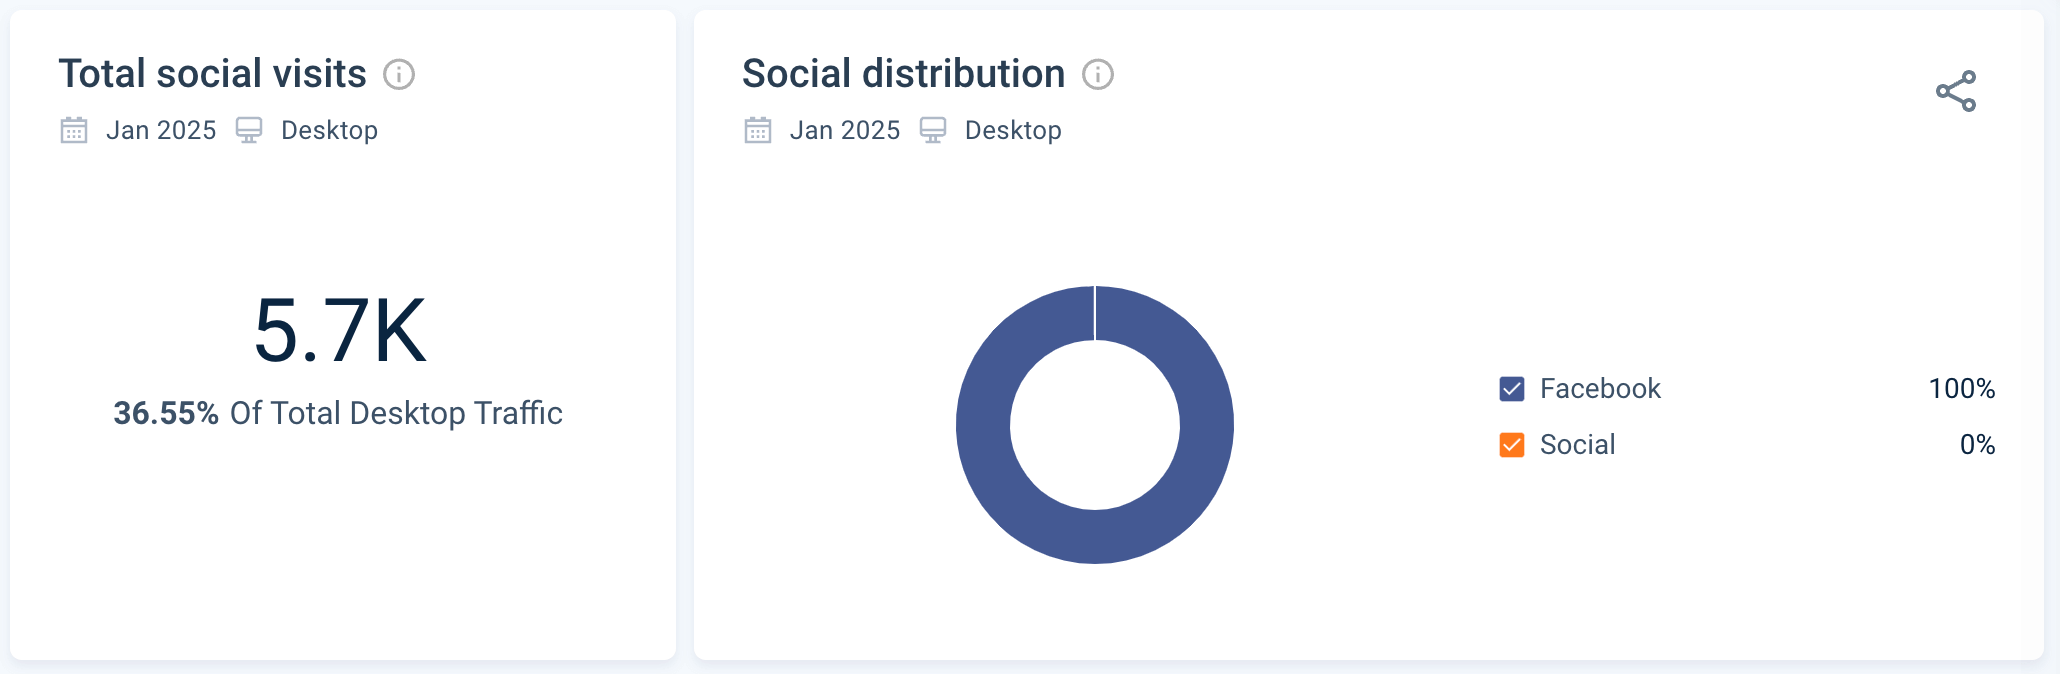
100% of its social traffic comes from Facebook. This is notable, considering Norelie’s target demographic of 50+ isn’t typically among Facebook’s top three user groups. While traffic is increasing, the question remains whether it is the right audience.
Here’s what SAM has to say about this wellness provider:
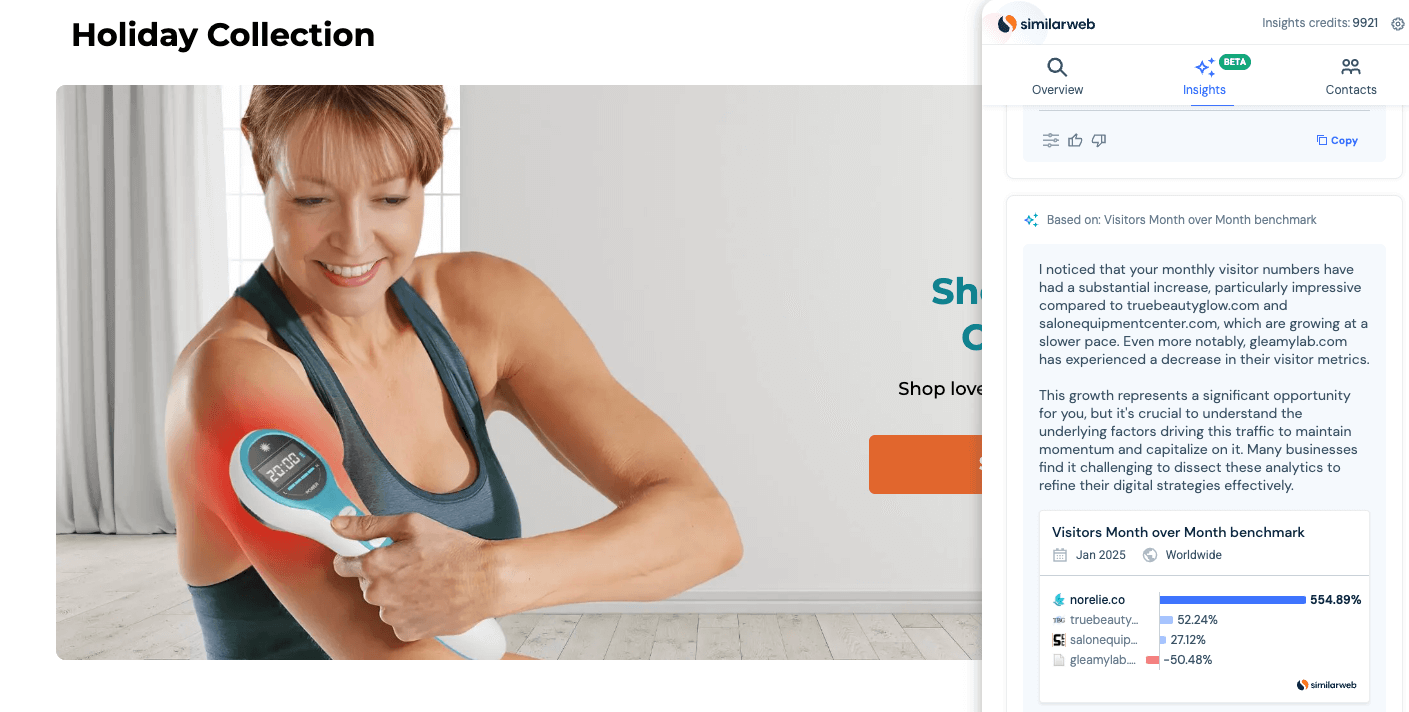
“I noticed that your monthly visitor numbers have had a substantial increase…. This growth represents a significant opportunity for you, but it’s crucial to understand the underlying factors driving this traffic to maintain momentum and capitalize on it. Many businesses find it challenging to dissect these analytics to refine their digital strategies effectively.”
To continue in its growth trajectory, Norelie definitely needs to understand the consumers coming to its website.
Norelie added numerous website technologies in January, with a focus on content delivery networks:
- Content Delivery Networks: Amazon CloudFront, Bootstrap CDN, and jsDelivr provide developers and businesses with an easy way to distribute content with low latency and high data transfer speeds
- Information Technology: Amazon for websites using Amazon’s services
- Server: Amazon Route 53, a scalable domain name system
- Widget: Google Maps
Go beyond the top 50
If you want to pull ecommerce insights like these in seconds — and we think you might — book a live demo to find out just how Similarweb Sales Intelligence can help you uncover your ideal prospects, their tech setups, and their pain points for 2024.
FAQs
Which is the biggest ecommerce company in the world?
Amazon remains the top ecommerce company in the world, with 5.8B total visits in January 2025, followed by eBay, which had 1.1B total visits.
How big is the global ecommerce market?
Based on the latest available data, the leading e-commerce markets by revenue in 2024 are:
- China: Approximately $1.47 trillion
- United States: Around $1.22 trillion
- United Kingdom: Approximately $157.99 billion
- Japan: Approximately $151.03 billion
- Germany: Approximately $89.71 billion
Related Posts

Top Ecommerce Companies in the USA: 100 Brands to Watch Right Now


Take your sales strategy to the next level
Try Similarweb Sales Intelligence today — free of charge